Download presentation
Presentation is loading. Please wait.

1
Implementation and test of HRLDAS in CWB
VV Tsay, Hong, Jing-Shan

2
Outline Concept of HRLDAS Implementation and education
Test of HRLDAS at CWB Future plan

3
Statistical relations between the grid and observations
In atmosphere, most observations were distributed within 3-D model grid. In usual, information is needed when one try to interpolate the observation to model grid: Firstguess, that means somehow, you trust the model atmosphere governed by the fluid dynamic and physical process Statistical relations between the grid and observations

4
In land, the situation is quit different,
In usual, the observation in the land is very limited. In relative, one can find much more observation on the ground level, -- the boundary of the land model. We can use the atmospheric forcing near the surface, and trust the land process in the land model, to initialize the state of the land. The information of the surface forcing will propagate to the deep layer in a certain time. This boundary is most active for the energy and moisture exchange between the land and atmosphere.

5
The first approach for the offline HRLDAS integration in CWB
Ingest the hourly atmospheric forcing: - RAINRATE from CMORPH (satellite retrieval) - PSFC, T2D, Q2D, U2D, V2D (GDAS analysis) - LWDOWN, SWDOWN, WEASD (GLDAS) - VEGFRA (WPS)
 - PSFC, T2D, Q2D, U2D, V2D (GDAS analysis) - LWDOWN, SWDOWN, WEASD (GLDAS) - VEGFRA (WPS)")
6
The second approach for the offline HRLDAS integration
Ingest the hourly atmospheric forcing: - RAINRATE from CMORPH (satellite retrieval) and Taiwan local precipitation data from QPESUMS - PSFC, T2D, Q2D, U2D, V2D (WRF forecast) - LWDOWN, SWDOWN(WRF forecast) VEGFRA (WPS) WEASD (GDAS)
 and Taiwan local precipitation data from QPESUMS. - PSFC, T2D, Q2D, U2D, V2D (WRF forecast) - LWDOWN, SWDOWN(WRF forecast) VEGFRA (WPS) WEASD (GDAS)")
7
Summary of the implementation
NCAR provide an one-month dataset and tutorial. CWB and NCAR perform the same integration using the same dataset and do the inter-comparison in Apr. (NCAR/CWB) Provide a driver to ingest the WRF forecast as the atmospheric forcing in HRLDAS (NCAR) Perform a 5-days integration and to ensure CWB and NCAR have the same results. (NCAR/CWB) Perform a series of the forecast experiment to evaluate the HRLDAS performance.
 Provide a driver to ingest the WRF forecast as the atmospheric forcing in HRLDAS (NCAR) Perform a 5-days integration and to ensure CWB and NCAR have the same results. (NCAR/CWB) Perform a series of the forecast experiment to evaluate the HRLDAS performance.")
8
Data used in the forecast experiment driven by GDAS (NCAR)
Collect the analysis field from GDAS from Jan-Mar Extract PSFC, T2D, Q2D, U2D, V2D and interpolate to 1-hr interval Collect the analysis field from GLDAS from Jan-Mar Extract LWDOWN, SWDOWN, WEASD and interpolate to 1-hr interval Prepare the 3-month CMORPH observations and interpolate to 1-hr interval. Prepare the VEGFRA from WPS

9
Data used in the forecast experiment driven by WRF forecast (CWB)
Re-run the WRF model to extract the hourly forecast output from Jan to June 1-6 hr, 7-12 hr, and hr forecast Extract the PSFC, T2D, Q2D, U2D, V2D, LWDOWN, SWDOWN, from WRF forecast. VEGFRA from WPS It is difficult to find the observational and analysis LWDOWN and SWDOWN in realtime. To further understand the impact of the WRF output in different forecast period on the HRLDAS Prepare the WEASD from GDAS Prepare the 6-month CMORPH observations and interpolate to 1-hr interval. Prepare the 6-month hourly radar estimated rainfall from QPESUMS.

10
Experimental design Exp D1-C (CWB) Exp D1-CA (NCAR) Exp D3-C (CWB)
45-km resolution, 6-month integration Use 7-12-hr WRF forecast as forcing CMORPH rainfall Exp D1-CA (NCAR) 45-km resolution, 3-month integration Use the analysis from GDA and GLDAS as forcing Exp D3-C (CWB) 5-km resolution, 6-month integration Exp D3-Q (CWB) CMORPH rainfall + QPESUMS rainfall WRF (CWB) Land variables in the original couple WRF-NOAH, interpolated from the land model of CWBGFS
 45-km resolution, 3-month integration. Use the analysis from GDA and GLDAS as forcing. Exp D3-C (CWB) 5-km resolution, 6-month integration. Exp D3-Q (CWB) CMORPH rainfall + QPESUMS rainfall. WRF (CWB) Land variables in the original couple WRF-NOAH, interpolated from the land model of CWBGFS.")
11
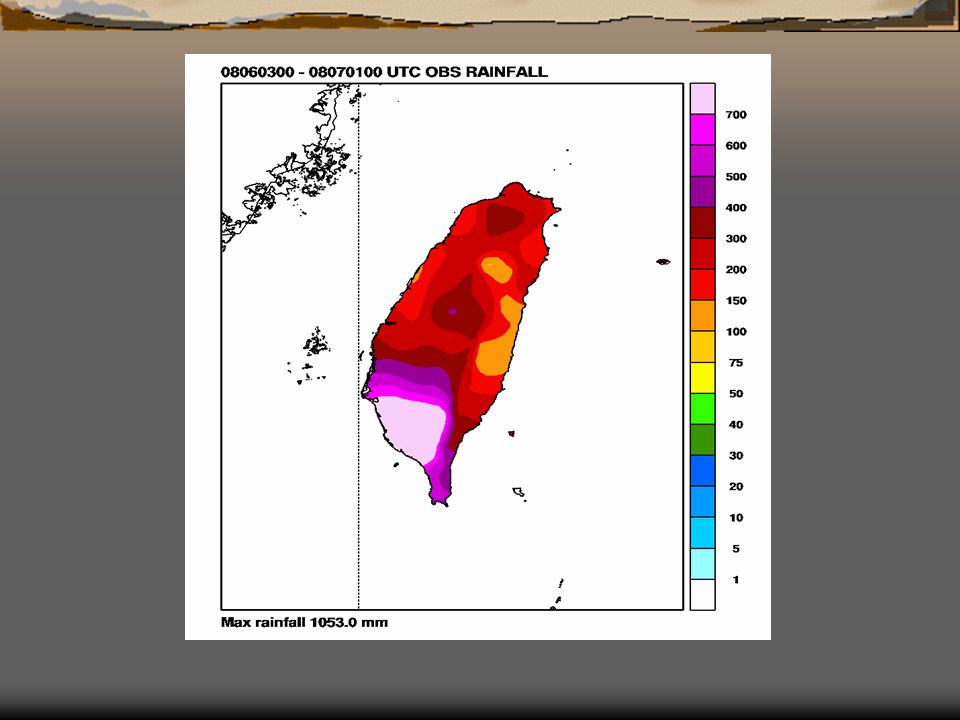
hourly radar estimated rainfall from QPESUMS

12
CMORPH CMORPH+QPESUMS

13
CMORPH CMORPH+QPESUMS

14
CMORPH CMORPH+QPESUMS Case in

15
Tg of EXP D1-C in 20 June, 2008

16
EXP D1-C

17
EXP D1-C

18
D1-C WRF warmer

19
D1-C WRF

20
D1-C WRF

21
drier D1-C WRF Near saturate

22
D1-C WRF

23
D1-CA D1C

25
D1-CA D1C

26
D1-CA D1C

27
D1-CA D1C

28
The same D3-Q D3-C WRF cold warmer

29
D3-Q D3-C WRF

30
D3-Q D3-C WRF

31
D3-Q D3-C WRF Near saturate in deep layer Incorrect soil texture

33
D3-Q D3-C WRF

34
Summary Cases show that the HRLDAS driven by the WRF forecast running in a reasonable way. Comparison among D1C, D1CG, and WRF The amplitude of the diurnal cycle decrease as the depth increased. In 45-km resolution, the ground temperature in D1-C is colder from the surface to 2nd layer, but warmer in 3rd and 4th layer than those in operational WRF-NOAH coupled model. The soil moisture in D1-C is drier than WRF-NOAH, however, the soil is near saturate in WRF-NOAH, it looks questionable

35
Summary The ground temperature is warmest in WRF, the D3-C the second, and the D3-Q the coldest. The soil moisture in D3-Q is wetter than the other 2 runs. Deep layer soil is near saturate in D3-Q, it looks consistent with the heavy rainfall over south Taiwan in Meiyu season?

36
Future plan The test to ingest WRF forecast at 1-6-hr and hr is undergoing, to show the sensitivity of WRF forecast. If not sensitivity, that’s good news. If very sensitivity, that we have to choice the atmospheric forcing very carefully. Can we find the realtime radiation products? Is the HRLDAS reach the equilibrium state in 6-mon integration? The more evaluation about the integration results. How to do?

37
Plan in 2009 Improvement of the soil texture over Taiwan island.
Improve the vegetation type from the MODIS products Enhance the verification of the HRLDAS using flux data and land in-situ data Testing of the coupled HRLDAS-WRF Training about the use of satellite products, advanced education on land process, and coupling the WRF and HRLDAS.

Similar presentations


 Research Applications Laboratory (RAL) and Developmental Testbed.>")
>")


