Download presentation
Presentation is loading. Please wait.

1
Rangeland Carbon Fluxes in the Northern Great Plains Wylie, B.K., T.G. Gilmanov, A.B. Frank, J.A. Morgan, M.R. Haferkamp, T.P. Meyers, E.A. Fosnight, L. Zhang US Geological Survey National Center for Earth Resources Observation Science (EROS) USGS: Earth Surface Dynamics, Land Remote Sensing, and Geographic Analysis and Monitoring National Science Foundation/EPSCoR Grant No. 0091948 through the South Dakota Center for Biocomplexity Studies and by the State of South Dakota USAID GL-CRSP project Grant No. PCE-G-00-98-00036-00 to Univ. of California, Davis USDA Agricultural Research Service Agriflux network US Agency for International Development Grant No. PCE-G-98-00036-00, Global Bureau, Office of Agriculture and Food Security U.S. Department of the Interior U.S. Geological Survey
 USGS: Earth Surface Dynamics, Land Remote Sensing, and Geographic Analysis and Monitoring National Science Foundation/EPSCoR Grant No through the South Dakota Center for Biocomplexity Studies and by the State of South Dakota USAID GL-CRSP project Grant No. PCE-G to Univ. of California, Davis USDA Agricultural Research Service Agriflux network US Agency for International Development Grant No. PCE-G , Global Bureau, Office of Agriculture and Food Security U.S. Department of the Interior U.S. Geological Survey.")
2
Objectives Exhaustively model and map Carbon fluxes in rangelands to quantify the fluxes and Investigate temporal and patterns to understand climate and environmental influences.

3
If NDVI < 0.40 C fluxes = f(X1, X2, X4) If NDVI >= 0.40 C fluxes = f(X1, X4, X6) Localized Detailed Measurements Spatial Variables Through Time C Flux Mapping Model Tree C Flux Maps METHODS: Develop Empirical Model Tree Algorithms to Predict Flux Tower Carbon Observations From Spatial Data Northern Great Plains
 If NDVI >= 0.40 C fluxes = f(X1, X4, X6) Localized Detailed Measurements Spatial Variables Through Time C Flux Mapping Model Tree C Flux Maps METHODS: Develop Empirical Model Tree Algorithms to Predict Flux Tower Carbon Observations From Spatial Data Northern Great Plains")
4
Lethbridge (LE), Canada: Larry Flanagan Ft. Peck (FP), MT; Tilden Meyers Mandan (MA), ND; Al Frank Cheyenne (CN), WY: Jack Morgan Miles City (MC), MT: Marshall Haferkamp Cottonwood, SD Brookings, SD Flux Tower Data is used to Develop Models for the Mapping of 10-day Carbon Dynamics on Rangelands New Towers
, MT; Tilden Meyers Mandan (MA), ND; Al Frank Cheyenne (CN), WY: Jack Morgan Miles City (MC), MT: Marshall Haferkamp Cottonwood, SD Brookings, SD Flux Tower Data is used to Develop Models for the Mapping of 10-day Carbon Dynamics on Rangelands New Towers.")
5
METHODS: Tower C Fluxes Associated with Basic Ecosystem Functions of Gross Primary Production (Pg) and Total Ecosystem Respiration (Re) are Derived From Light Response Curves on 30 min. Datasets. Tagir Gilmanov, SDSU, coordinator of the FLUXNET WORLDGRASSFLUX working group independent Derives estimates of daytime respiration independent of nighttime flux data (others often use relationships derived from nighttime fluxes and apply them to daytime observations) PROVIDES: 1) Tower Pg, Re, and NEE 2) Facilitates flux tower data gap filling 3) Quantifies ecophysiological parameters (quantum yield ( ), maximum gross photosynthesis ( ), & daytime respiration ( )) NEENEE
 PROVIDES: 1) Tower Pg, Re, and NEE 2) Facilitates flux tower data gap filling 3) Quantifies ecophysiological parameters (quantum yield ( ), maximum gross photosynthesis ( ), & daytime respiration ( )) NEENEE.")
6
-2 0 1 2 3 4 5 6-Dec 25-Jan 15-Mar 4-May 23-Jun 12-Aug 1-Oct 20-Nov 9-Jan g C m-2 day-1 NEE Pg Re Ecosystem Process Carbon Partitioning: Added Value Bkwd_finalGPP_RE_NEEmodel4c.xls Source Sink

7
Flux Tower Pg Group: Significant Early Rain, High Pg Flux Tower Pg Group: Moderate Rain, Moderate Pg Flux Tower Pg Group: Low Rain, Low Pg

8
Model Development Data Set Consists of Flux Tower Pg, Re, and NEE Combined With Spatial Variables from Remote Sensing and GIS (10-day Time Step)
")
9
Tower versus Spatial Data - Takes into account the accuracy of spatial data sets when developing model. - Process-based models typically rely heavily on precipitation - Precipitation can have high spatial and temporal variability that is difficult to map accurately.

10
Distinct Model Trees Models that predict: –Net Ecosystem Exchange (NEE) –Gross Primary Production (Pg) –Respiration (Re)
 –Gross Primary Production (Pg) –Respiration (Re)")
11
Empirical Piecewise Regression Model Cubist –Parsimonious and transparent selection of variables –Stratification of data into homogeneous information spaces –Multiple regression defined for each information space

12
NEE Model example (g CO 2 m -2 day -1 ) Rule 1: [98 cases, mean -1.1538022, range -6.22692 to 5.404624, est err 1.2296274] if nd 85 then NEE = 6.25352 + 0.138 nd - 0.091 ppt - 0.19 sosn - 0.009 par - 0.01 temp - 0.0015 sinceSost Rule 2: [21 cases, mean 0.7320258, range -3.83196 to 4.013414, est err 1.8628249] if nd > 140 and par <= 100 then NEE = 1.82742 + 0.046 par - 0.04 temp + 0.033 nd - 0.03 sosn - 0.008 ppt - 0.0014 sinceSost Rule 3: [60 cases, mean 0.9998901, range -4.301141 to 7.026846, est err 1.7766731] if nd <= 140 and sinceSost <= 85 then NEE = 3.42815 + 0.051 par - 0.046 temp - 0.054 tin + 0.043 nd - 0.04 sosn - 0.012 ppt - 0.0019 sinceSost
![NEE Model example (g CO 2 m -2 day -1 ) Rule 1: [98 cases, mean , range to , est err ] if nd 85 then NEE = nd ppt sosn par temp sinceSost Rule 2: [21 cases, mean , range to , est err ] if nd > 140 and par <= 100 then NEE = par temp nd sosn ppt sinceSost Rule 3: [60 cases, mean , range to , est err ] if nd <= 140 and sinceSost <= 85 then NEE = par temp tin nd sosn ppt sinceSost](http://images.slideplayer.com/11/3308316/slides/slide_12.jpg "NEE Model example (g CO 2 m -2 day -1 ) Rule 1: [98 cases, mean , range to , est err ] if nd 85 then NEE = nd ppt sosn par temp sinceSost Rule 2: [21 cases, mean , range to , est err ] if nd > 140 and par <= 100 then NEE = par temp nd sosn ppt sinceSost Rule 3: [60 cases, mean , range to , est err ] if nd <= 140 and sinceSost <= 85 then NEE = par temp tin nd sosn ppt sinceSost")
13
Rules or respective “information spaces”

14
Theme Count Pct. Weight Pct. --------------------------------------------- par 429 34.3 1.712 13.2 nd 390 31.2 2.981 22.9 sinceSost 379 30.3 0.732 5.6 temp 40 3.2 3.360 25.8 ppt 11 0.9 1.636 12.6 tin 0 0.0 1.385 10.7 sosn 0 0.0 1.193 9.2 Variables used to predict NEE Theme Count Pct. Weight Pct. --------------------------------------------- nd 683 37.8 7.031 33.5 par 508 28.1 5.322 25.3 doy 177 9.8 2.231 10.6 temp 136 7.5 2.222 10.6 sinceSost 132 7.3 1.437 6.8 c4pct 111 6.1 0.448 2.1 sost 60 3.3 0.827 3.9 tin 0 0.0 1.482 7.1 Variables used to predict P g Variables used to predict R e Theme Count Pct. Weight Pct. --------------------------------------------- temp 2848 40.4 3.540 4.0 nd 2244 31.8 22.192 25.2 ppt 991 14.1 8.395 9.5 par 343 4.9 10.789 12.3 sinceSost 284 4.0 12.412 14.1 doy 255 3.6 10.735 12.2 pctgrass 81 1.1 14.612 16.6 tin 0 0.0 5.326 6.1

15
Model Accuracy Assessment MAD = Range = 95th percentile - 5th percentile Relative Error = MAD / Range

16
Winter fluxes difficult to estimate…. 30 min. data sets indicate snow depth and wind speed important

17
Winter fluxes (Nov. - Mar.) are need to convert model tree maps (Apr. - Oct.) to Annual Fluxes Mandan 01-02, Gilmanov 2002; Mandan 96-00, Frank et al. 2002, Miles City, Gilmanov 2002; Lacombe, Baron et al. 2004
 to Annual Fluxes Mandan 01-02, Gilmanov 2002; Mandan 96-00, Frank et al. 2002, Miles City, Gilmanov 2002; Lacombe, Baron et al")
18
Cross validation Five-fold NEE (g C m -2 day -1 ) cross-validation (random) Methodology to quantify robustness of small training data sets Random cross-validation produces realistic error estimates Cross-validation by sites evaluates influence of individual sites Cross-validation by year evaluates influence of individual years Average MAD = 0.48 Results
 cross-validation (random) Methodology to quantify robustness of small training data sets Random cross-validation produces realistic error estimates Cross-validation by sites evaluates influence of individual sites Cross-validation by year evaluates influence of individual years Average MAD = 0.48 Results")
19
Cross-validation NEE (g C m -2 day -1 ) by site Cross-validation NEE (g C m -2 day -1 ) by years
 by site Cross-validation NEE (g C m -2 day -1 ) by years")
20
Pg: Jack_site_summary3.xls Robustness of Pg model tree: Cross Validation using Sites Cheyenne and Mandan are influential sites (high Pg in CH 1998 and MA 1999) (MA is only high precipitation, eastern site) Relative Errors on the other sites was from 7 to 12 %
 (MA is only high precipitation, eastern site) Relative Errors on the other sites was from 7 to 12 %")
21
Results How Well do 10-day Model Tree Predictions Averaged over the Growing Season Compare with Flux Tower Observation? Twrlocalbxy_gpp_nee01_Re.xls

22
Model Tree (trained from all towers) MODIS GPP (withheld 2001 MAD was 0.48) Model Tree Predictions Match 2001 Flux Tower Observations Better than MODIS Net Photosynthesis Captures General Tend in Tower Pg Predictions seem site specific
 MODIS GPP (withheld 2001 MAD was 0.48) Model Tree Predictions Match 2001 Flux Tower Observations Better than MODIS Net Photosynthesis Captures General Tend in Tower Pg Predictions seem site specific")
23
MODIS Regional Comparison of 2001 MODIS GPP and Model Tree Pg on Rangelands Pg (g C m-2 day-1) General Agreement MODIS had outlier values > 6 g C m -2 day -1 Model Tree
 General Agreement MODIS had outlier values > 6 g C m -2 day -1 Model Tree")
28
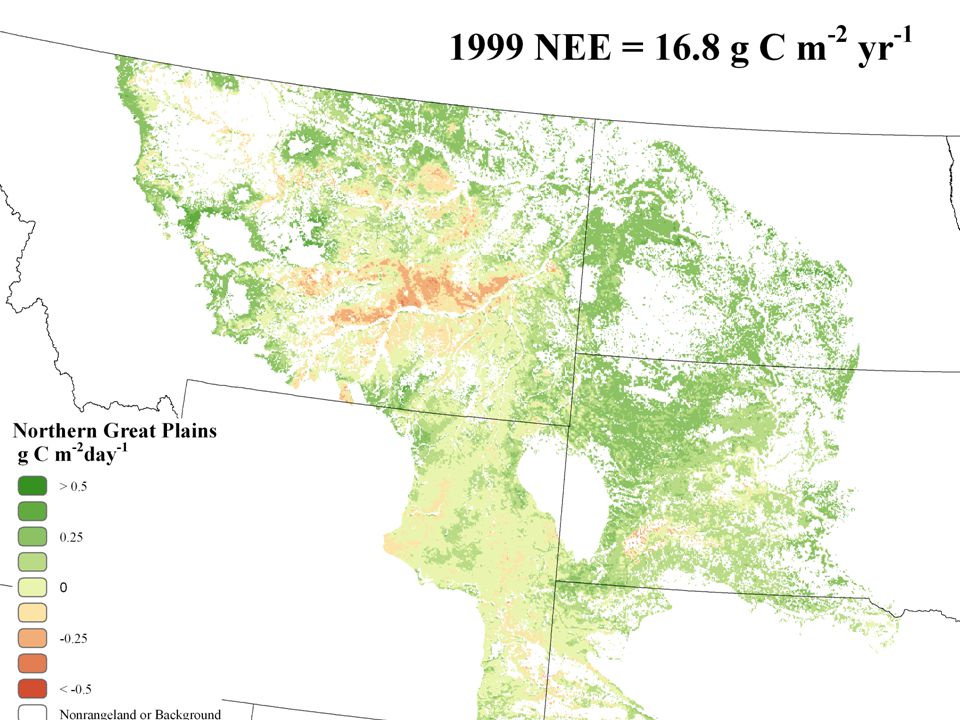
1998 = -15.5 NEE (g C m 2 yr -1 ) 1999 = 16.8 2000 = -59.4 2001 = -6.0 Average = -16.0
 1999 = = = -6.0 Average = -16.0")
29
Ppt_temp_monthly_rangelands.xls Ppt_temp_monthy_rangelands.xls 1998 = -15.5 NEE (g C m 2 yr -1 ) 1999 = 16.8 2000 = -59.4 2001 = -6.0 Average = -16.0 Why was 2000 NEE so low? Low June precipitation Low previous fall precipitation

30
High NEE 1 and 2 Low NEE 1 and 2 Investigating Causes of Sinks and Sources: 1999

31
STATSGO Range Production Normal Year Kg ha -1 1998-2001 April-June Precipitation mm <= 5 25 >= 50 Percent clay STATSGO percent clay Environmental Drivers of 1998-2001 Source Areas Average Temperature (Apr. - Oct., 1998-2001) 13.7 15.5 17.4 18.9 (C)
 (C).")
32
Conclusions Model Tree predictions of Pg and NEE agreed well with tower observations Heavy reliance of Model Tree predictions on NDVI insures tracking of temporal and spatial dynamics not evident in climatic data sets Winter flux estimates need improvement N. Great Plains Rangelands from 1998-2001 were a WEAK source of C.

Similar presentations