Download presentation
Presentation is loading. Please wait.

1
José Juan Barajas de Prat
UPDATING OF THE ELECTROPHYSIOLOGICAL RESPONSE IN THE NEWBORNS José Juan Barajas de Prat ICA 2010 Sao Paulo, Brazil March 28 th – April 1 st

2
WHAT SHOULD THE IDEAL INFANT HEARING ASSESSMENT?
Must be applicable to neonates and children Measure Hearing sensitivity from kHz Assess hearing sensitivity for mild to severe- profound hearing loss Objectively detect an infant´s response to sound To get information of frequency selectively for early intervention Importance to stabled degree of hearing loss Objective nice behavioural responses are not possible The main challenge always is that can be apply to neonates and clidren. To get information of frcuency selectivity is acritical factor for an early hearing aid adaptation or coclear implants. Is inportant to establish the degree of hearig loss. Although the reaction to the child to the sound is important to have an early objective audiological assesmentis is an essential of the auditory infant evaluation. 2

3
ELECTROPHYSIOLOGIC TECHNIQUES
Click and tone- burst evoked ABR Evoked potentials for tones that are amplitude and/or frequency modulated Auditory-steady state responses (ASSR) AMLR and 40 Hz Cortical AEPs Electrophisiological techniques All with advantages and disadvantages. These are the main audiological theniques that have used in neonates and infants auditory evaluation. In general these techniques have been part of our audiological assesment for quite a long time. All of them have as you can imagen advantage and disadvantages. We are going to focus our interest in ASSR as promising tool for infant auditory evaluation. 3
 AMLR and 40 Hz. Cortical AEPs. Electrophisiological techniques. All with advantages and disadvantages. These are the main audiological theniques that have used in neonates and infants auditory evaluation. In general these techniques have been part of our audiological assesment for quite a long time. All of them have as you can imagen advantage and disadvantages. We are going to focus our interest in ASSR as promising tool for infant auditory evaluation. 3.")
4
LIMITATIONS OF CONVENTIONAL EVOKED POTENTIAL TESTS
Click ABR: Cannot be used to estimate the 4 frequency ( Hz) audiogram TB-ABR: Lenghtly procedure, relies on subjective analysis of waveforms AMLR, 40 Hz and CAEP: Unreliable during natural or sedated sleep on infants and children CAEP methods with quietly awake infants may hold promise for estimates of thresholds and speech feature discrimination abilities State of subjetc essential for children TB – ABR: expert identification Click stimulus provide information from the basal part of the coclear partittion. TB take long time to get recordings and not always easy to recognise the responses even for the expert The AMLR, 40 Hz and CAEP are very much related to the state of the subject. CAEP in awake children can more likely correlate with percepcion and can be elicited by a range of speech phonemes. Can be present in children with auditory neuropathy /dysynchrony 4
 audiogram. TB-ABR: Lenghtly procedure, relies on subjective analysis of waveforms. AMLR, 40 Hz and CAEP: Unreliable during natural or sedated sleep on infants and children. CAEP methods with quietly awake infants may hold promise for estimates of thresholds and speech feature discrimination abilities. State of subjetc essential for children. TB – ABR: expert identification. Click stimulus provide information from the basal part of the coclear partittion. TB take long time to get recordings and not always easy to recognise the responses even for the expert. The AMLR, 40 Hz and CAEP are very much related to the state of the subject. CAEP in awake children can more likely correlate with percepcion and can be elicited by a range of speech phonemes. Can be present in children with auditory neuropathy /dysynchrony. 4.")
5
Audiogram configuration from AEP in the eighties
Transient middle latency information apical part of cochlea Influence the state of subject on the MLR In awake The MLR together with Click ABR can provide an over view of the auditory status of the child. In this slide we present a recording from the eigthies of two points audiogram.(Around 4KHz and 500Hz). Jose J. Barajas. (1985). Auditory Brainstem and Middle Latency Response in Early Detection of Hearing Loss in Infants. New dimensions in otorhinolaryngology – head and neck surgery (1); pp 5
. Jose J. Barajas. (1985). Auditory Brainstem and Middle Latency Response in Early Detection of Hearing Loss in Infants. New dimensions in otorhinolaryngology – head and neck surgery (1); pp")
6
STIMULI AND GENERATION
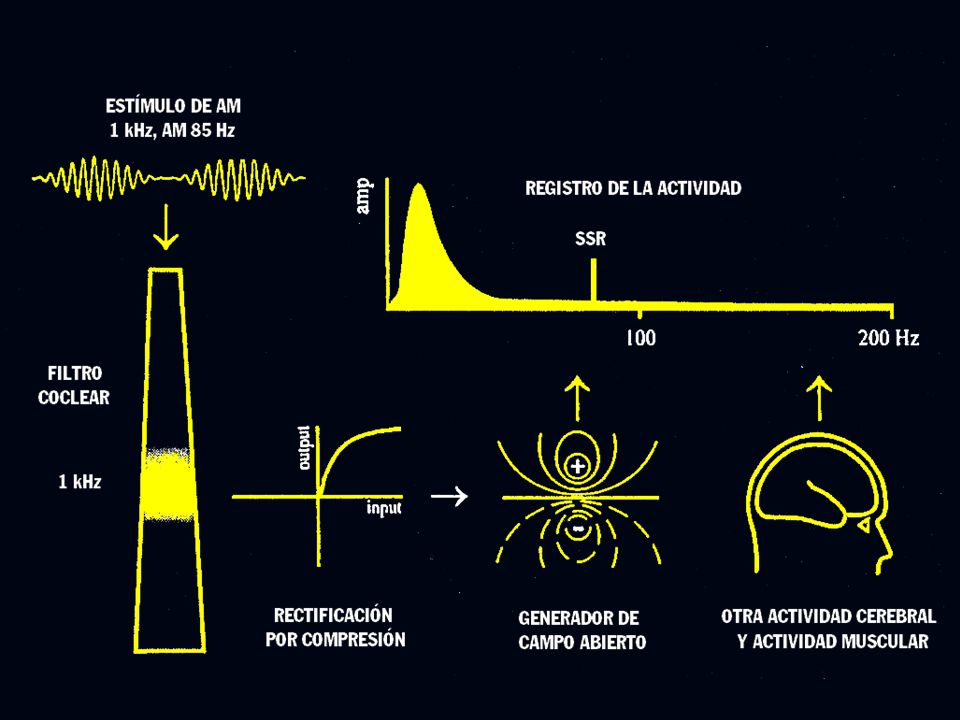
CLICK STIMULI AND GENERATION OF THE MLR 40 HZ PIP (0.25, 0.5, 1, 2, 4 kHz) 25 ms, 40 Hz V Pa N0 (N10) La risposta cosiddetta a 40 Hz rappresenta una risposta composita, costituita dalla sommazione in serie della componente positiva su cui si inscrivono le 5-7 onde dell’ABR con la componente Pa delle MLR. Ciò si ottiene inviando gli stimoli con un intervallo inter-stimolo di 25 ms (frequenza 40 Hz), ed usando una finestra di analisi di 100 msec. Un averaging condotto per circa 1000 ripetizioni (4000 stimoli unitari) permette di distinguere una risposta che occupa tutta la finestra, caratteristicamente costituita da una serie di onde abbastanza regolari, con una frequenza di 40 Hz (25 ms fra ogni picco). La registrazione di questa risposta richiede dei filtri che tagliano la frequenza tipica dell’ABR (circa 1000 Hz) per evitare la sovrapposizione dei picchi tipici dell’ABR. La risposta è generata facilmente da transitori, ma anche da “tone-pip” a Hz. MLR 40Hz ms
 25 ms, 40 Hz. V. Pa. N0. (N10) La risposta cosiddetta a 40 Hz rappresenta una risposta composita, costituita dalla sommazione in serie della componente positiva su cui si inscrivono le 5-7 onde dell’ABR con la componente Pa delle MLR. Ciò si ottiene inviando gli stimoli con un intervallo inter-stimolo di 25 ms (frequenza 40 Hz), ed usando una finestra di analisi di 100 msec. Un averaging condotto per circa 1000 ripetizioni (4000 stimoli unitari) permette di distinguere una risposta che occupa tutta la finestra, caratteristicamente costituita da una serie di onde abbastanza regolari, con una frequenza di 40 Hz (25 ms fra ogni picco). La registrazione di questa risposta richiede dei filtri che tagliano la frequenza tipica dell’ABR (circa 1000 Hz) per evitare la sovrapposizione dei picchi tipici dell’ABR. La risposta è generata facilmente da transitori, ma anche da tone-pip a Hz. MLR 40Hz ms.")
7
40 Hz Publication of Galambos et al (1981)- 40 Hz: superposition of transient middle latencies responses. ASSR smaller with subjects drowsy or sleep. Cohen (1991): ASSR not attenuate by sleep >70 Hz. Jose J. Barajas. (1988). Middle Latency and 40 Hz Auditory Evoked Responses in normal hearing children: 500 Hz thresholds.Scand Audiol Supp 30:99-104
: ASSR not attenuate by sleep >70 Hz. Jose J. Barajas. (1988). Middle Latency and 40 Hz Auditory Evoked Responses in normal hearing children: 500 Hz thresholds.Scand Audiol Supp 30:")
8
MEASUREMENTS OF SIGNAL AND NOISE AT DIFFERENT RATES
The response and noise decrease with increasing stimulus rate. An scalp recording activity averaged across a group of drowsy or sleeping subjects At higher frecuencies the noise decrease exponencially (Cohen1991) because of this ASSR at high frecuency is easily recognizabledespite to be smaller than responses atlow frecuencies Response enhance nearly 40 Hz and 90 Hz. Better to signal to noise ratio at higher frequency rates ASSR around Hz suitable for newborns since can be recording under sedation and unaffected by response state. High rate ASSR equivalent latency ABR (10 msec) Picton TW, John MS, Dimitrijevic A, Purcell D. Human auditory steady-state responses. Int J Audiol Jun;42(4): 8
 because of this ASSR at high frecuency is easily recognizabledespite to be smaller than responses atlow frecuencies. Response enhance nearly 40 Hz and 90 Hz. Better to signal to noise ratio at higher frequency rates. ASSR around Hz suitable for newborns since can be recording under sedation and unaffected by response state. High rate ASSR equivalent latency ABR (10 msec) Picton TW, John MS, Dimitrijevic A, Purcell D. Human auditory steady-state responses. Int J Audiol Jun;42(4):")
9
88 Hz 39 Hz L R ORIGIN SSR (Herdman et al, 2002) Cz 7 1 2 4 6 3 5 1 3
Le sorgenti delle SSR presentano differenze a seconda se la risposta è evocata da frequenze di modulazione lente (39 Hz) o più rapide. In entrambi i casi (stimolazione monolaterale sinistra) la regione che più contribuisce alla riposta è il tronco cerebrale. Per la SSR a 88 Hz concorrono inoltre regioni corticali (3-4). Per la SSR a 40 Hz le regioni corticali (3 e 4) contribuiscono quasi quanto il tronco. Queste differenze spiegano perchè le SSR 40 Hz sono più sensibili alla vigilanza e all’anestesia. 3 1 ms ms
 o più rapide. In entrambi i casi (stimolazione monolaterale sinistra) la regione che più contribuisce alla riposta è il tronco cerebrale. Per la SSR a 88 Hz concorrono inoltre regioni corticali (3-4). Per la SSR a 40 Hz le regioni corticali (3 e 4) contribuiscono quasi quanto il tronco. Queste differenze spiegano perchè le SSR 40 Hz sono più sensibili alla vigilanza e all’anestesia ms ms.")
10
AUDITORY STEADY STATE RESPONSE (ASSR)
Can be recorded in neonates and children Are evoked by frequency –specific tonal stimuli Correlate with elevation in the hearing thresholds Can be objectively evaluated Are used to estimate an audiogram No new describe by (Reagan 1966) visual stimuli Several of these techniques because can be done with sedation Possible tool for hearing evaluation in infants When we review the atributes of ASSR we can think that we have the perfect method of audiological evaluation in neonates. Of course the real life is not so simple as we are going to see. We important point that is not presented in these slides is that ASSR can be recorded under sedation. 10
 visual stimuli. Several of these techniques because can be done with sedation. Possible tool for hearing evaluation in infants. When we review the atributes of ASSR we can think that we have the perfect method of audiological evaluation in neonates. Of course the real life is not so simple as we are going to see. We important point that is not presented in these slides is that ASSR can be recorded under sedation. 10.")
14
OPTIMAL MODULATION RATE FOR EACH CARRIER
500 Hz 1500 Hz 4000 Hz Optimal modulation rate varied with carrier tone but were all within the range Hz (Rickards et al. 1994) > response at 25/37 Hz: difficult to detect by noise (Riquelme et al.2006) Rickards FW, Tan LE, Cohen LT, Wilson OJ, Drew JH, Clark GM. (1994). Auditory steady-state evoked potential in newborns. Br J Audiol.;28(6): 14
 > response at 25/37 Hz: difficult to detect by noise (Riquelme et al.2006) Rickards FW, Tan LE, Cohen LT, Wilson OJ, Drew JH, Clark GM. (1994). Auditory steady-state evoked potential in newborns. Br J Audiol.;28(6):")
15
THE NEONATAL ASSR AVERAGED AMPLITUDE FOR NORMAL- HEARING INFANTS AND ADULTS
Luts found response amplitud approximately ¾ times higher that the infant group whlile John et alt (2002) adult responses are twice the newborn responses. The amplitude of ASSR in newborns at 70 Hz are smaller and highly variable that older subjects. Luts H, Desloovere C, Wouters J Clinical application of dichotic multiple-stimulus auditory steady-state responses in high-risk newborns and young children. Audiol Neurootol.;11(1):24-37. 15
 adult responses are twice the newborn responses. The amplitude of ASSR in newborns at 70 Hz are smaller and highly variable that older subjects. Luts H, Desloovere C, Wouters J Clinical application of dichotic multiple-stimulus auditory steady-state responses in high-risk newborns and young children. Audiol Neurootol.;11(1):")
16
ASSR THRESHOLD IN BABIES
Adults at lower intensities have > significant responses. Thresholds in babies tend to be higher than adults. ASSR thresholds in neonates infants is normal dB HL for low carrier frequency and dB HL for middle to high frequencies (10-15 higher than adults). Direct comparison adult versus babies difficult for different state of subject Reduce noise in babies no compensate the low ASSR amplitude. Luts, H. “Diagnosis of Hearing Loss in Newborns. Clinical Application of Auditory Steady- State responses”. Director: Prof. Dr. J. Wouters . Katholieke Universiteit Leuven, Faculty of Medicine, 2005 16
. Direct comparison adult versus babies difficult for different state of subject. Reduce noise in babies no compensate the low ASSR amplitude. Luts, H. Diagnosis of Hearing Loss in Newborns. Clinical Application of Auditory Steady- State responses . Director: Prof. Dr. J. Wouters . Katholieke Universiteit Leuven, Faculty of Medicine,")
17
ASSR THRESHOLD CHANGES IN INFANCY
Longitudinal studies for 6 weeks (3/6 days at initial assessment). Consistent within subject decrease across this period around 5 dB for both test frequencies 500 Hz and 4 kHz. This slide show four collection points.Results from two children are highligted. ASSR not completed at 6 weeks. ASSR thresholds at 4 kHzAt 12 moths have decreased significantly to near adult levels. In contrast with ASSR thresholds at 500 Hz still relative inmature at 52 weeks with a mean threshold of 35 dB ( a decrease of only 5dB) Rance, G. & Tomlin, D. (2006). Maturation of ASSR in nomal babies. Ear & Hearing, 27, 17
. Consistent within subject decrease across this period around 5 dB for both test frequencies 500 Hz and 4 kHz. This slide show four collection points.Results from two children are highligted. ASSR not completed at 6 weeks. ASSR thresholds at 4 kHzAt 12 moths have decreased significantly to near adult levels. In contrast with ASSR thresholds at 500 Hz still relative inmature at 52 weeks with a mean threshold of 35 dB ( a decrease of only 5dB) Rance, G. & Tomlin, D. (2006). Maturation of ASSR in nomal babies. Ear & Hearing, 27,")
18
ASSRs IN HEARING IMPAIRED BABIES
The low spread of data suggest that ASSR thresholds obtained in infancy can reliable the behavioural audiogram particularly in ear with significant neursensorial hearing loss. ASSR reliably recorded at low levels in newborns ASSR thresholds and behavioural correlation stronger for cochlear hearing impairment- recruitment like phenomenon ASSR between 2/52- 6/52 Condition responses after maduration enough Rance G (2008). ASSR in Neonates & Infants. In The Auditory Steady-State Response: Generation, Recording, and Clinical Applications. Edited by Gary Rance. In review. 18
. ASSR in Neonates & Infants. In The Auditory Steady-State Response: Generation, Recording, and Clinical Applications. Edited by Gary Rance. In review. 18.")
22
Probably neurological factor
Together high variability different identification High variability in the first weeks –> poor for SCREENING Need to be used with other electrphysiological and electroacoustical techniques (Conditioned audiometry)
")
23
Maturation factors affect ASSR.
CONCLUSION Maturation factors affect ASSR. Normally hearing babies present lower amplitudes than adults and older children. Neonatal period threshold higher and more variable. Need to determine typical response levels for babies of different ages and developmental stages. Probably neurological factor Together high variability different identification High variability in the first weeks –> poor for SCREENING Need to be used with other electrphysiological and electroacoustical techniques (Conditioned audiometry) 23
 23.")
24
AEP and early hearing aid fitting and validation
ASSR CAEP (Obligatory Cortical Auditory Evoked Potentials) AEP: Cochlear Implants Evaluation AEP in early intervention. A few slides on early hearing aid fitting 24
 AEP: Cochlear Implants Evaluation. AEP in early intervention. A few slides on early hearing aid fitting. 24.")
25
LOUDNESS AND ASSR Attempt to establish a relationship between subjective. Loudness growth derivated from the Contour Test and physiological responses obtained from ASSR. Loudness for adjustment hearing aids and site lession in neurosensorial hearing loss The Contour test well established clinical method to quantify loudness perception (soft to uncomfortable) Zenker Castro F., Barajas de Prat JJ & Larumbe Zabala E. (2008): Loudness and Auditory Steady State responses in normal hearing subjects. Int J Audiol May;47(5):269-7. 25
 Zenker Castro F., Barajas de Prat JJ & Larumbe Zabala E. (2008): Loudness and Auditory Steady State responses in normal hearing subjects. Int J Audiol May;47(5):")
26
LOUDNESS MAP ASSR Usually Hearing Aid characteristics are prescribed from a Loudness Perception Map derived from hearing thresholds obtained by psychophysical procedures.Normalmente las carateristicas de las protesis se establecen a partir de mapas de percepcion de la sonoridad.Obtenidas a partir de unbrales psicoacusticos de audicion. Here we show the Loudness Perception Map of a normal hearing subject for these four frequencies.Aqui presentamos el mapa de percepcion de la sonoridad en un sujeto con audicion normal. The sensation of loudness decreased as the intensity of the stimulus decreased. La sensacion de sonoridad e intensidad decrececen de forma univoca.( a la vez) On the rigth we show the SSR for the same normal hearing subject.A la derecha se presentan los PEAee de este sujeto normooyente. As expected the amplitude of the physiological response decreased as the intensity of the stimulus decreased.Como cabia esperar la amplitud de las respuestas fisiologicas disminuyen con la intensidad del estimulo. Our attempt is to prove whether it is possible to establish a relationship between subjective loudness growth and these physiological responses.Nuestro objetivo es tratar de establecer una posible relacion entre el escalamiento de la sonoridad subjetiva y las respuestas fisiologicas Zenker F. & Barajas J.J. ASSRs: Their Role in Hearing Device Fitting. In: Gary Rance, editor. The Auditory Steady-State Response: Generation, Recording & Clinical Application. San Diego: Plural Publishing; p
 On the rigth we show the SSR for the same normal hearing subject.A la derecha se presentan los PEAee de este sujeto normooyente. As expected the amplitude of the physiological response decreased as the intensity of the stimulus decreased.Como cabia esperar la amplitud de las respuestas fisiologicas disminuyen con la intensidad del estimulo. Our attempt is to prove whether it is possible to establish a relationship between subjective loudness growth and these physiological responses.Nuestro objetivo es tratar de establecer una posible relacion entre el escalamiento de la sonoridad subjetiva y las respuestas fisiologicas. Zenker F. & Barajas J.J. ASSRs: Their Role in Hearing Device Fitting. In: Gary Rance, editor. The Auditory Steady-State Response: Generation, Recording & Clinical Application. San Diego: Plural Publishing; p")
27
PREDICTION OF LOUDNESS GROWTH FUNCTION FROM THE ASSR
Y = 0.75X0.4 In a recent study we established this relationship.En este estudio establecemos la relacion entre la prediccion de la sonoridad derivada de las respuestas electrofisiologicas PEAee y la escala de sonoridad psicoacustica. (contour Test). In this figure we show the subject's loudness ratings and the predicted loudness obtained from the intensity and the amplitude of the SSR. The data was adjusted to an exponential growth function defined by this formula. En esta figura presentamos el escalamiento de la sonoridad y la prediccion de la sonoridad obtenida de la intensidad y la amplitud de PAEee.La data puede ser representada (adaptada segun una funcion exponencial ) A significantly high correlation was found regardless of the carrier frequency. El coeficiente de correlacion fue significativo independiente de la frecuencia portadora. Predicted Loudness (fo) = B0 + B1 * Intensity + B2 * Amplitude Zenker Castro, Franz, Juan Barajas de Prat, Jose and Larumbe Zabala, Eneko (2008). Loudness and auditory steady-state responses in normal-hearing subjects. International Journal of Audiology, 47:5, 269 — 275.
. In this figure we show the subject s loudness ratings and the predicted loudness obtained from the intensity and the amplitude of the SSR. The data was adjusted to an exponential growth function defined by this formula. En esta figura presentamos el escalamiento de la sonoridad y la prediccion de la sonoridad obtenida de la intensidad y la amplitud de PAEee.La data puede ser representada (adaptada segun una funcion exponencial ) A significantly high correlation was found regardless of the carrier frequency. El coeficiente de correlacion fue significativo independiente de la frecuencia portadora. Predicted Loudness (fo) = B0 + B1 * Intensity + B2 * Amplitude. Zenker Castro, Franz, Juan Barajas de Prat, Jose and Larumbe Zabala, Eneko (2008). Loudness and auditory steady-state responses in normal-hearing subjects. International Journal of Audiology, 47:5, 269 — 275.")
28
Loudness Perception Map
Subject TP023 - Right ear Loudness Perception Map predicted from ASSR ASSR Recording soft speech average speech loud speech A potential application of this study is the possibility to predict an individual Loudness Perception Map from an SSR recording.Una aplicacion potencial de este estudio esla posibilidad de predecir el mapa de percepcion sonora individual apartir de los PEAee. This possibility is illustrated in this example case. Esta posibilidad se ilustra en este ejemplo. Here we have the SSR recording from the right ear of a four years old child.This PEAee del oido derechode un nino de 4 anos Significant responses are identified in the Polar Plots by a square.Las respuestas significativas estan representadas en esta representacion Polar por estos cuadrados y hacen referencia a su sensibilidad auditiva. This hearing sensitivity is obtained for this patient On the right we show the Predicted Loudness Perception Map. A la derecha tenemos el mapa de prediccion de la sonoridad obtenida apartir de esta equation Once we have this map we can establish the input speech levels in order to prescribe the adjustment of the hearing aid for this patient.Una vez obtenido el mapa de sonoridad podemos establecer los niveles de input del lenguaje para el ajuste del audifono para este paciente. Y = 0.75X0.4 500 1000 2000 4000 dB HL 45 50 60 65

29
HEARING AID PRESCRIPTION FROM ASSR
We can calculate the dynamic range, the gain and the compression factor. APP (Amplitude proyection procedure) to obtain dynamic range Amplitude level function for a group of normal hearing subjetcs Amplitude level function for a group of hearing impaired children Dynamic range of speech (40-80 dB) Zenker F. & Barajas J.J.(2008) ASSRs: Their role in hearing device fitting. In: The Auditory Steady State response: generation, recording and clinical application. Edited by Gary Rance. 29
 to obtain dynamic range. Amplitude level function for a group of normal hearing subjetcs. Amplitude level function for a group of hearing impaired children. Dynamic range of speech (40-80 dB) Zenker F. & Barajas J.J.(2008) ASSRs: Their role in hearing device fitting. In: The Auditory Steady State response: generation, recording and clinical application. Edited by Gary Rance. 29.")
30
More likely to correlate well with perception.
Why are we using obligatory cortical responses to evaluate hearing aid function? More likely to correlate well with perception. Can be elicited by a range of speech phonemes. Reliable present in awake young infants. Can be present in children with auditory neuropathy/dys-synchrony. Need to considerer the different CAEP responses in infancy versus adults. The maduration course of CAEP.

31
CAEP Adults complex P1 N1 P2 within 300 ms after the stimulus onset. Grand average adults and infants CAEP waveform. P1 N1 P2 response thresholds agree very well with audiometric thresholds determined behaviorally Affected by arousal and atention In infants P2 is absent and the response is derivated by a large late P1 response Suzanne C. Purdy et al. (2004). Aided cortical auditory evoked potentials for hearing instrument evaluation. 3rd Pediatric Conference “A Sound Foundattion through early amplification”. Chicago, Illinois
. Aided cortical auditory evoked potentials for hearing instrument evaluation. 3rd Pediatric Conference A Sound Foundattion through early amplification . Chicago, Illinois.")
32
MATURATIONAL EFFECTS ON CORTICAL EVOKED RESPONSE
The birth and up to about 6 years of age wave P2 is absent and the response is dominated by a large late P1 response. . Ponton et al. (2000) Maturation human central auditory system activity: evidence from multi-channel evoked potentials. Clinical Neurophysiology 111 (2): 32
 Maturation human central auditory system activity: evidence from multi-channel evoked potentials. Clinical Neurophysiology 111 (2):")
33
EFECTO OF AGE OVER THE LATE RESPONSES
Los efectos de la maduracion es un aspecto siempre a tener en cuenta para cualquier tipo de componentes.En esta diapositiva presentamos el proceso de maduracion de P300 potenciales cognitivos.En la diapositiva de la derecha se puede detectar la relacion curvilinea entre la latencia de la P300 y la edad se puede observar un floor effect a los 19/21 anos. Barajas JJ (1990) The effects of age on human P3 latency. Acta Otolaryngol Suppl;476: F Zenker & J J Barajas (1999) Auditory P300 development from an active, passive and single-tone paradigms., International Journal of Psychophysiology 33 (2).
 The effects of age on human P3 latency. Acta Otolaryngol Suppl;476: F Zenker & J J Barajas (1999) Auditory P300 development from an active, passive and single-tone paradigms., International Journal of Psychophysiology 33 (2).")
34
CAEP CAN ELICITED BY DIFFERENT SPEECH PHONEMES IN NEWBORNS
Speech stimuli across the speech spectrum evoked a normal response at the level of auditory córtex and therefore likely to be perceived. D. KURTZBERG 1989 34

35
CAP (P1) Amplitud (µV) Latencia (mseg) 20.0 10.0 0.0 -10.0 -100.0 0.0
Aqui presentamos un ejemplo de como los potenciales corticales pueden corelacionarse con la ganancia del audifono.El umbral auditivo se presenta en el angulo inferior derecho. La ganancia se representa en el angulo superior derecho.El registro cortical correspodiente a esta ganacia no permite identificar P1(se trata de un nino de 6 meses repuestas obtenidas por VRA) -10.0 -100.0 0.0 100.0 200.0 300.0 400.0 500.0 Latencia (mseg)
 Latencia (mseg)")
36
CAP (P1) Amplitud (µV) Latencia (mseg) 20.0 10.0 0.0 -10.0 -100.0 0.0
Aumentamos la ganancia de la protesis y vamos obteniendo una mejor definicion del componente P1. -10.0 -100.0 0.0 100.0 200.0 300.0 400.0 500.0 Latencia (mseg)
")
37
CAP (P1) P1 Amplitud (µV) Latencia (mseg) 20.0 10.0 0.0 -10.0 -100.0
En esta diapositiva presentamos un procedimiento de adaptación protésica “a la inversa”.A esta intensidad se obtiene una clara y robusta P1.En realidad este procedimiento lo que nos manifiesta son dos informaciones importantes:1)nos dice que el sonido llega a la corteza cerebral y 2) que existe una relacion entre el aumento de la ganancia y la actividad cerebral.Cual es la ganancia optima del audifono es asunto que no se puede inferir de este procedimiento Está especialmente indicado en aquellos pacientes en los que se disponga de poca o ninguna información acerca de la sensibilidad auditiva. Lo que vamos a hacer es determinar el umbral auditivo a partir de la Respuestas en Oído Real Amplificada pero en vez de con respuestas comportamentales lo haremos a través de la observación de la respuesta cerebral. En este caso tenemos un niño con una pérdida plana de 60 dB (70 dB SPL) de pérdida. Sólo se disponía de los PEATC En la derecha de la diapositiva observamos la Ganancia Prescrita a partir de este umbral y a la izquierda, en el mismo color, observamos la respuesta cerebral desencadenada. En el potencial elicitado no se reconoce componente alguno en respuesta a la estimulación. Aumentando en 5 dB la Ganancia podemos observar que comienza a insinuarse una deflexión en el registro. Con 10 dB más de los prescritos en un principio podemos observar claramente como se elicita finalmente el componente P1. En estos casos, en los que solo disponemos de los PEATC, una buena estrategia es ajustar el audífono modificando la ganancia a partir de las respuestas corticales. El tipo de estímulo empleado por este tipo de registros son impulsos tonales específicos en frecuencia. -10.0 -100.0 0.0 100.0 200.0 300.0 400.0 500.0 Latencia (mseg)
nos dice que el sonido llega a la corteza cerebral y 2) que existe una relacion entre el aumento de la ganancia y la actividad cerebral.Cual es la ganancia optima del audifono es asunto que no se puede inferir de este procedimiento. Está especialmente indicado en aquellos pacientes en los que se disponga de poca o ninguna información acerca de la sensibilidad auditiva. Lo que vamos a hacer es determinar el umbral auditivo a partir de la Respuestas en Oído Real Amplificada pero en vez de con respuestas comportamentales lo haremos a través de la observación de la respuesta cerebral. En este caso tenemos un niño con una pérdida plana de 60 dB (70 dB SPL) de pérdida. Sólo se disponía de los PEATC. En la derecha de la diapositiva observamos la Ganancia Prescrita a partir de este umbral y a la izquierda, en el mismo color, observamos la respuesta cerebral desencadenada. En el potencial elicitado no se reconoce componente alguno en respuesta a la estimulación. Aumentando en 5 dB la Ganancia podemos observar que comienza a insinuarse una deflexión en el registro. Con 10 dB más de los prescritos en un principio podemos observar claramente como se elicita finalmente el componente P1. En estos casos, en los que solo disponemos de los PEATC, una buena estrategia es ajustar el audífono modificando la ganancia a partir de las respuestas corticales. El tipo de estímulo empleado por este tipo de registros son impulsos tonales específicos en frecuencia Latencia (mseg)")
38
P1 IN HEARING AIDS P1 latencies changes for child with a congenital hearing impairment fitting with hearing aids at age 11 months. Waveforms for different times intervals after the hearing aid fitting. Anu Sharma, Emily Tobey, Michael Dorman, Sneha Bharadwaj, Kathryn Martin, Phillip Gilley, Fereshteh Kunkel. Central Auditory Maturation and Babbling Development in Infants With Cochlear Implants. ARCH OTOLARYNGOL HEAD NECK SURG/VOL 130, MAY 2004. 38

39
P1 IN COCHLEAR IMPLANTS P1 latencies changes for the early and late implanted groups. The solid line 95% of confidence intervals for normal development of P1 latency. Anu Sharma, Michael F. Dorman, Andrej Kral. (2005). The influuence of a sensitive period on central auditory development in children with unilateral and bilateral cochlear implants. Hearing Research 203, 134–143. 39
. The influuence of a sensitive period on central auditory development in children with unilateral and bilateral cochlear implants. Hearing Research 203, 134–")
40
BRASIL

41
ASSR & TONE-BURST ABRs IN NEONATES
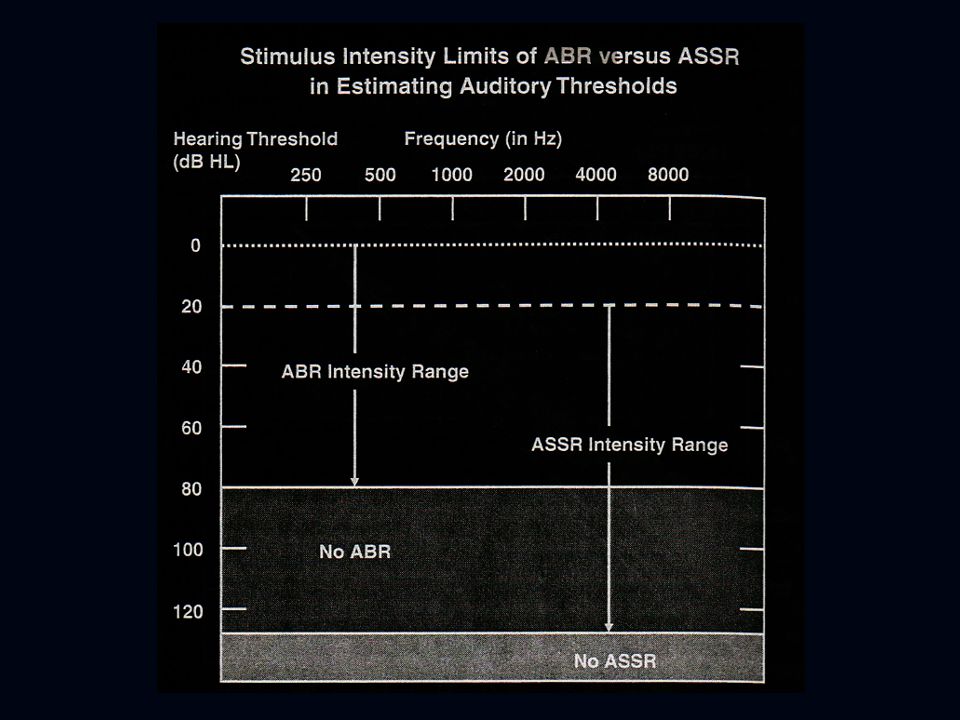
ASSR and TB ABR the most pronucing objective mesaure before conditioned audiometry is possible The ASSR be recorded 30/40 dB HL while TB ABR can be reliable recorded 5-15 dB nHL. ASSR threshold on average 4dB higher at 500 Hz frequency and 19.3 higher at 4 kHz ( Rance). ASSR (dB HL)- TB (dB nHL)- SPEL 5 to 15 dB higher for TB at 0 dB nHL. Rance G (2008). Assr in Neonates & Infants. In Auditory Steady-State Response Generation, Recording, and Clinical Applications. Gary Rance 41
. ASSR (dB HL)- TB (dB nHL)- SPEL 5 to 15 dB higher for TB at 0 dB nHL. Rance G (2008). Assr in Neonates & Infants. In Auditory Steady-State Response. Generation, Recording, and Clinical Applications. Gary Rance. 41.")
44
Average 1 2 3 Stimuli EEG FFT

45
Modulation Frequency (Hz)
SSR Recordings Thresholds Right Left Modulation Frequency (Hz)
")
47
Maturation factors affect ASSR.
CONCLUSION Maturation factors affect ASSR. Normally hearing babies present lower amplitudes than adults and older children. Neonatal period threshold higher and more variable. Need to determine typical response levels for babies of different ages and developmental stages. Probably neurological factor Together high variability different identification High variability in the first weeks –> poor for SCREENING Need to be used with other electrphysiological and electroacoustical techniques (Conditioned audiometry)
")
Similar presentations


, Zenker Castro,>")

 Reasonably frequency specific stimuli>")


>")


>")
