Download presentation
Presentation is loading. Please wait.

1
Palmetto Health Richland August 2008
35 yo AAF presents with confusion, agnosia, apraxia, right-sided lower extremity paresis Symptoms first noticed 2 hours ago CT scan- no blood MRI- single hyperintense lesion in the left periventricular white matter Started IV steroids, ran a panel of CSF & blood studies 3 days later- Symptoms resolved Diagnosed with Multiple Sclerosis

2
Jessica Floyd, M4 The Imaging of Multiple Sclerosis * Utility of MRI * Differential of White Matter Lesions * Future direction of neuroradiology

3
What is Multiple Sclerosis?
Chronic Inflammatory demyelinating disease of the CNS 2nd-3rd decade of life (“belongs to the climax of life”) 2:1 Female predominance ,000 people with MS in the US Cyclical inflammatory reactions followed by remission of symptoms and variable recovery Relapsing-Remitting- 80% Primary Progressive- 20%; closer incidence M:F Secondary Progressive There is a whole host of interesting topics to discuss with MS but since this is focused mainly on the imaging of MS, we will save that for another time.
 2:1 Female predominance ,000 people with MS in the US. Cyclical inflammatory reactions followed by remission of symptoms and variable recovery. Relapsing-Remitting- 80% Primary Progressive- 20%; closer incidence M:F. Secondary Progressive. There is a whole host of interesting topics to discuss with MS but since this is focused mainly on the imaging of MS, we will save that for another time.")
4
Charcot’s description
First described by Charcot in 1835 Patient history, physical exam, autopsy Salpetriere (1865) to the United States Blood vessel at the center of each lesion Preserved axis cyllinder Atrophy of the medullary sheath Types: Cephalic Spinal Mixed: cerebrospinal
 to the United States. Blood vessel at the center of each lesion. Preserved axis cyllinder. Atrophy of the medullary sheath. Types: Cephalic. Spinal. Mixed: cerebrospinal.")
5
Broad Symptom Complex Sensory disturbances Unilateral optic neuritis
Diplopia- Internuclear opthalmoplegia Nystagmus Lhermitte’s sign Limb weakness Clumsiness Gait ataxia Neurogenic bladder Bowel symptoms

6
Symptoms Fatigue Post Partum worsening of Symptoms ~ 4wk
Worse in the afternoon Physiologic increases in temperature Post Partum worsening of Symptoms ~ 4wk Uhthoff’s symptom- hot shower, hot bath Pseudoexacerbations with fever

7
Symptoms Highly suggestive of MS: Less common:
Paroxysmal pain, paresthesias Trigeminal neuralgia Episodic clumsiness, nysarthria Tonic limb posturing Less common: Prominent cortical signs Aphasia, apraxia, recurrent seizures, visual field loss, early dementia Extrapyramidal phenomena Chorea, rigidity

8
WHAT DOES IT LOOK LIKE?

9
Brain Lesions Most sensitive modality is MRI
Sensitive to inflammation Sensitive to demyelination CT is a poor tool unless very severe destruction Callosal atrophy Whole brain atrophy

10
T2 Lesions Inflammation (water) & Demyelination (loss of fat) Hyperintensities on T2 weighted images Confirm with FLAIR images Round, Ovoid Vary in size. Few mm Few cm Periventricular region, corpus callosum Perivascular distribution, penetrating venules Dawson’s fingers Juxtacortical Lesions, U-fibers

11
T2 Lesions Temporal Lobe Brainstem- peripherally
Deep Gray Matter- BG, Thalamus (LC) Cerebellum Spinal Cord Recurrent Lesions in Same Area CONFLUENT lesions MC anterior & posterior to lateral ventricle Vasogenic edema = “fuzzy extension” of T2 signal LARGE DIFFERENTIAL FOR T2 Hyperintensities These will help with differentiating from vascular pathology
 Cerebellum. Spinal Cord. Recurrent Lesions in Same Area CONFLUENT lesions. MC anterior & posterior to lateral ventricle. Vasogenic edema = fuzzy extension of T2 signal. LARGE DIFFERENTIAL FOR T2 Hyperintensities. These will help with differentiating from vascular pathology.")
12
T2 Lesions- FLAIR Red arrow- involvement of the temporal lobe
Green arrow- juxtacortical lesions, touching the cortex Blue arrow- involvement of the corpus callosum Periventricular lesions- touching the ventricles

13
Dawson’s Fingers- Sagital FLAIR

14
T1 Holes SEVERE Tissue Injury T1 dark signals
Rarely seen in the spinal cord or post fossa Stronger correlation with demyelination & axonal loss than T2 hyperintensities Evolution of enhancing lesions T1 Holes associated with more progressive disease

15
T2 lesions & T1 Holes Fig 3 = Typical ovoid periventricular lesions of ms in 31 yo man with 10 yr h/o RR neurologic Sx A : First echo T2 MR sequence showing several ovoid lesions with T2 prolongation, with long axes perpendicular to ventricular walls B: T1-weighted MRI shows that T1 is also prolonged within lesions

16
Gadolinium-Enhancing Lesions
Indicates breakdown of the blood-brain barrier Very active inflammation Pattern of enhancement Homogenous Ring reactivation of an old lesion Heterogeneous Enhancement duration varies- days, weeks 5% pts have >3 months of single lesion enhancement

18
Spinal Cord Lesions Round, Ovoid on T2
Limited to 1-2 spinal cord segments 80% involve half of cord cross sectional area Ddx- ITM, Devic’s Dz Typically unilateral Inflammatory edema temporary cord expansion Ddx- Tumor (bx) Gadolinum enhancment with active BBBB Post mortem path studies show greater demyelination than assumed with conventional t2 imaging But can be central or bilateral Not the case with Brain demyelination- not seen outside of T2 lesion
 Gadolinum enhancment with active BBBB. Post mortem path studies show greater demyelination than assumed with conventional t2 imaging. But can be central or bilateral. Not the case with Brain demyelination- not seen outside of T2 lesion.")
19
35 yo female- acute onset Quadriparesis
Figure 5 = MS involving upper spinal cord in 35 yo woman with acute onset of quadriparesis. T2 weighted MRI shows a large area of demyelination in upper cervical spinal cord and cervicomedullary junction

20
Spinal Lesions- Gad-enhancement
Sagittal (A) T2 weighted and (B) post-gad T1 weightedimages froma pt with MS showing a discrete enhancing T2 lesion; and a nonenhancing lesion seen in the medulla (arrow)
 T2 weighted and (B) post-gad T1 weightedimages froma pt with MS showing a discrete enhancing T2 lesion; and a nonenhancing lesion seen in the medulla (arrow)")
21
Brain Atrophy Significant Clinical Implications
Correlates with clinical disability Predictive of later progressive disability Many standard therapies slow progression of atrophy over time

22
Callosal Atrophy Figure 4 = Callosal involvement with MS in 48 yo woman with clinically definite MS for 20 years. A: T1 weighted midline sagittal MRI shows diffuse callosal atrophy B: Inner Callosal hyperintensity, and multiple confluent periventricular lesions, are shown on first echo of T2-weighted series

23
Diagnosis Ensuring MS is of high suspicion, consider prevalence and a priori probability

25
How suspicious are you? Imaging is only one part of the story, clinical picture Incidental Finding versus Manifesting Clinically Normal Aging or Virchow Robin Spaces Vascular disease Infarction Multi-infarct Dementia Hypertensive encephalopathy Sarcoidosis- ACE level, pulmonary Sx, CXR SLE- discoid/malar rash, other organ involvment Lyme Disease- CN7 palsy, rash, influenza-like illness HIV- test, immunocompromised Progressive Multifocal Leukoencephalopathy- immunocompromised Largest differential concerns Vascular versus MS

26
Normal Aging & Fazeka’s
Can have caps and bands around the ventricles I: small punctate lesions in the deep white matter- considered normal in aging II: larger WMLs that are beginning to become confluent- abnormal in pts <75 yo III: abnormal in any age group; probably due to microangiopathy and seen more frequently in patients with vascular risk factors.

27
Virchow Robin Spaces CSF spaces around penetrating leptomeningeal vessels Typically located in the BG, anterior commissure and in the middle of the brainstem; they follow the signal intensity of CSF; enlarge with age and HTN secondary to atrophy of surrounding structures

28
Vascular vs Multiple Sclerosis

29
Vascular disease vs Multiple Sclerosis
66 yo Male T2 Hyperintensities None being Ovoid Few Periventricular Lesions No Juxtacortical lesions Figure 6 = Multiple Ischemic WM Lesions in 66 yo man with Sx of cerebellar infarction. First echo of T2 weighted MR sequence shows hyperintensities similar to those of demyelinating dz, but none are ovoid and few periventricular lesions are present

30
Vascular vs. Multiple Sclerosis
Juxtacortical lesions- specific for MS This is not subcortical. In Small vessel dz, these juxtacortical U-fibers are not involved, there will be a dark band between the WML and the cortex which is also bright

31
Criteria for Diagnosis of MS
Since MRI revolutionized the diagnosis of MS, needed specific criteria Crux of the Dx is demonstrating attacks of neurologic dysfunction are separated in space and time Clinical criteria* pt hx, PE findings, Laboratory Criteria* oligoclonal bands, IgG index MRI * 2001 McDonald Criteria, 2005 revised

34
Diagnostic Criteria Fig 1 = typical cerebral lesions of MS in 64 yo woman with sudden onset of diplopia & ataxia; Multiple periventricular lesions of MS, with lumpy-bumpy contour, on first echo of T2 weighted MR sequence Fig 2 = MS lesions in brainstem of 38 yo man with bilateral weakness & sensory Sx in LE. T2 weighted MRI shows lesion of MS in R cerebral peduncle

35
Dissemination in TIME- 3 months
Re-examined 3 months after the first clinical attack. Multiple Enhancing lesions, many touch the cortex & must be located in the U-fibers These enhanced lesions are all new lesions, since Gad enhancement is only visible for about 1 month, so this finding is proof of dissemination in time

36
One episode, treat or not to treat?
Cannot diagnose MS on MRI alone- need the clinical exam & history However, MRI can now show us what even a vigorous clinical exam cannot Revolutionizing treatment treat earlier Mild cognitive deficits discovered earlier

37
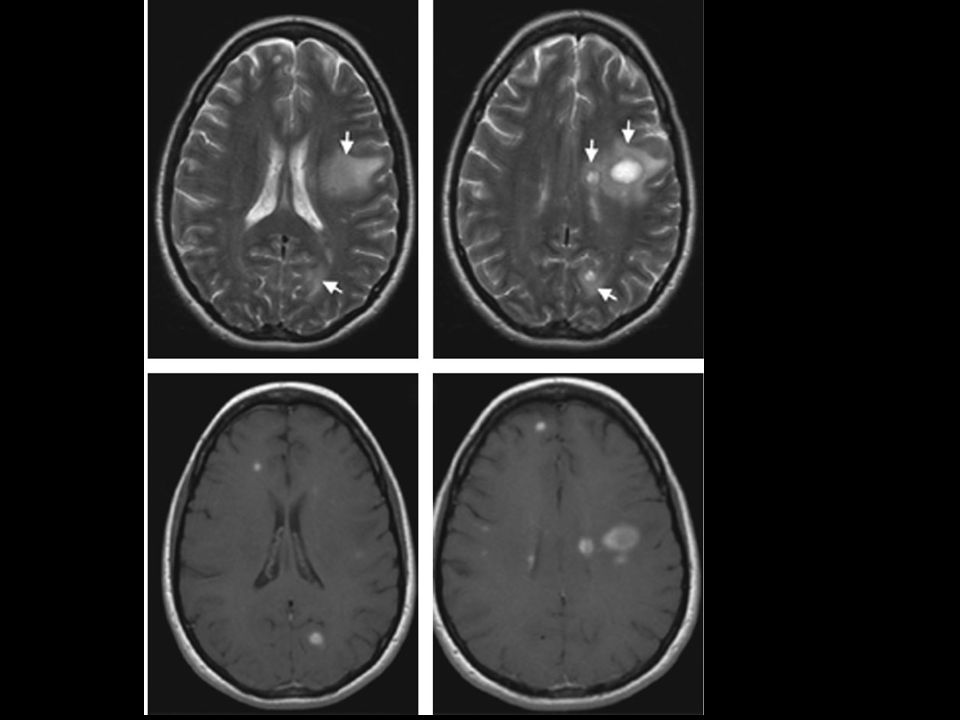
42 yo woman with MS, no Sx Figure 7 = Multiple sclerosis in 42 yo woman with clinically definite MS but no acute Sx A: T1 weighted MRI after administration of gadolinum shows several enhancing ovoid lesions in cerebral white matter bilaterally. Contrast enhancement defines areas of acute inflammation; indicating areas of BBB breakdown B: First echo of T2 weighted series at same level as A shows many more white matter lesions; primarily periventricular in distribution.

38
Coming in the future… MR Spectroscopy- N-acetyl aspartate, Lactate
Diffusion Tensor Imaging Able to pick up on lesions not yet detectable on MRI Ability to give you information on precisely how damaged the lesion is compared to other lesions

39
Diffusion Tensor Imaging
Artist’s depiction of water diffusion. (A) w/in fiber tracts where axons and myelin orient diffusion longitudinally, water diffusion oriented along the fiber tract. (B) In areas of demyelination and axonal injury, water diffusion is greater in overall amount (increased mean diffusivity), and also less ELONGATED (decreased fractional anisotropy). This indicates the diff vectors.
 w/in fiber tracts where axons and myelin orient diffusion longitudinally, water diffusion oriented along the fiber tract. (B) In areas of demyelination and axonal injury, water diffusion is greater in overall amount (increased mean diffusivity), and also less ELONGATED (decreased fractional anisotropy). This indicates the diff vectors.")
40
Diffusion Tensor Imaging
3-D water diffusion Mean Diffusivity- overall diffusion Fractional anisotropy- amount of elongatedness of diffusion Colorized primary eigenvector maps- illustrate different directions of the primary fiber tract RED = L-R GREEN = Up-Down BLUE = In-Out of page Diffusion tensor images from a patient with MS. (A) Mean diffusivity shows the overall amount of diffusion. (B) fractional anisotropy shows the amount of anisotropy, or “elongatedness” of diffusion; and © colorized primary eigenvector maps illustrate different directions of the primary eigenvector, or fiber tract. Red is L-R, Green is Up-Down; Blue is In-Out of the page Arrows indicate the effect of 2 MS lesions; mean diffusivity is increased (BRIGHT); Fraciational anisotropy is decreased (Dark), and the primary fiber direction is disrupted (DARK)
 Mean diffusivity shows the overall amount of diffusion. (B) fractional anisotropy shows the amount of anisotropy, or elongatedness of diffusion; and © colorized primary eigenvector maps illustrate different directions of the primary eigenvector, or fiber tract. Red is L-R, Green is Up-Down; Blue is In-Out of the page. Arrows indicate the effect of 2 MS lesions; mean diffusivity is increased (BRIGHT); Fraciational anisotropy is decreased (Dark), and the primary fiber direction is disrupted (DARK)")
41
Gad- enhancement T1 & T2 Dawson Fingers:
Ovoid lesions perpendicular to the ventricles Enhancing lesion on T1 with Gad- indicating active breakdown of BBB Multiple lesions adjacent to the ventricles Result of inflammation around penetrating venules Enhancement is present for about one month after the occurrence of a lesion; simultaneous demonstration of enhancing and non-enhancing lesions in MS is the radiological explanation for clinical dissemination in time and space; The edema will regress and finally only the center will remain as a hyperintense lesion on T2

42
Dawson’s fingers – T1 & T2 Sagittal FLAIR image provide best appreciation of Dawson’s fingers in which lesions extend radially from the ventricular surface into the surrounding white matter (fluid-attentuated inversion recovery) T1 weighted image from typical MS patient/ periventricular lesions dark on T1 but not all are dark Axial T2 and Flair
 T1 weighted image from typical MS patient/ periventricular lesions dark on T1 but not all are dark. Axial T2 and Flair.")
43
FLAIR & T-1 black hole Axial A FLAIR and B T1 weighted images showing a T1 black hole which is mixed hypo-hyperintense on FLAIR

44
Confluent Lesions & Atrophy
SEMINARS Figure 3 Axial FLAIR images from a 52-year-old patient with multiple sclerosis. The formerly discrete T2 lesions have now become confluent (arrows). Also, significant atrophy can be appreciated through loss of brain parenchyma as well as enlargement of the lateral ventricles, peripheral sulci, and third ventricle (arrowhead). FLAIR, fluid-attenuated inversion recovery.
. Also, significant atrophy can be appreciated through loss of brain parenchyma as well as. enlargement of the lateral ventricles, peripheral sulci, and third ventricle (arrowhead). FLAIR, fluid-attenuated inversion recovery.")
45
Progressive Multifocal Leukoencephalopathy
MRI of the brain from a patient with PML Axial T2 weighted (left and middle) and post-contrast T1 weighted (right) images show two lesions in the left hemisphere without mass effect and contrast enhancement. The outer border of the lesion follows exactly the cortical lesion.
 and post-contrast T1 weighted (right) images show two lesions in the left hemisphere without mass effect and contrast enhancement. The outer border of the lesion follows exactly the cortical lesion.")
46
Sarcoidosis MRI of a patient with sarcoidosis.
Post-contrast T1-weighted coronal image of the brain (left) and axial image of the cord (right) show simultaneous enhancement of multiple white-matter lesions, Virchow-Robin spaces (left), and leptomeninges.
 and axial image of the cord (right) show simultaneous enhancement of multiple white-matter lesions, Virchow-Robin spaces (left), and leptomeninges.")
47
Acute Disseminated Encephalomyelitis
Axial FLAIR (left column) and post gad T1 (right) images from pt with ADEM. Most lesions demonstrate gad enhancement suggesting similar age to ongoing inflammatory process
 and post gad T1 (right) images from pt with ADEM. Most lesions demonstrate gad enhancement suggesting similar age to ongoing inflammatory process.")
Similar presentations


 LaTasha Wilson Nate Jr.. Pathophysiology of MS In MS, the body’s own defense system attacks myelin, the fatty substance that surrounds.>")

 Recent evidence shows early involvement of CNS axons as.>")


 is an inflammatory disease of the Central Nervous System (CNS) - that's the brain and spinal cord. Predominantly,>")


 By: Morgan Farr Biology 1010.>")
 “Multiple Sclerosis is a progressive demyelination of neurons in the central nervous system (the Brain and the Spinal.>")