Download presentation
Presentation is loading. Please wait.

1
Dr R. Anjan Bharathi

2
3 rd leading cause of mortality & morbidity. Goal of imaging Early and accurate diagnosis Information about the intracranial vasculature and brain perfusion to guide appropriate therapy.

3
Goals of Acute Stroke Imaging 4 Ps of acute stroke imaging ParenchymaAssess early signs of acute stroke, rule out hemorrhage PipesAssess extra cranial & intra cranial circulation for intravascular thrombus PerfusionAssess cerebral blood volume, cerebral blood flow, and mean transit time PenumbraAssess tissue at risk of dying if ischemia continues without recanalization of intravascular thrombus Rowley HA. The four Ps of acute stroke imaging: parenchyma, pipes, perfusion, and penumbra. AJNR Am J Neuroradiol 2001;22:599–601

4
ModalityUtility Unenhanced CTQuick/ identify early signs of stroke /rule out h’gge. CT angiographyDepict intravascular thrombi/ stenosis/occlusion CT perfusionSalvageable tissue →penumbra DWIHyper acute ischemia Gradient- echoH’gge MR angiographyStatus of neck and intracranial vessels Diffusion and perfusion mismatch Presence of a penumbra

5
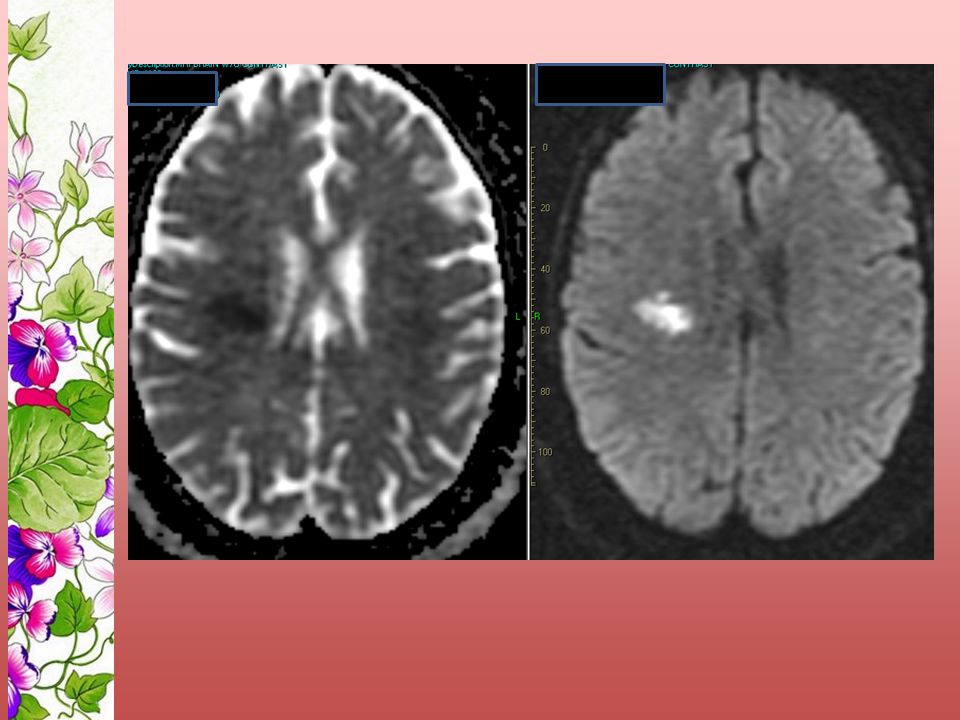
DWI Sensitive to random motion of water molecules by a value called ADC which is measured. As the water molecules moved in the direction of the field gradient, in transverse the accumulate a phase shift magnetization which is related to that of a stationary one; this results in signal attenuation. ADC in ischemic areas is < 50% than the brain and appear hyperintense on DWI

6
Ischemia Na-K pump failure Cytotoxic edema with in tissue water by 3-5%. The ADC values are rarely reversible though IAT may occasionally cause disappearance of the diffusion defect. Acute drop in ADC -- normalizes to baseline at 5- 10 days after ischemia [pseudonormalization]. ADC values can be > normal levels at the time passes does aiding in differentiation between acute, subacute and chronic infarcts.

9
PWI Principle of dynamic susceptibility contrast (DSC) imaging. --Bolus-contrast ie tracking a nondiffusible paramagnetic (gadolinium) which is passing through brain tissue on a T2* 0.2 mmol/kg (roughly double at a high flow rate (3-5 cc/sec) 10 to 12 s after scan initiation. Blood oxygen level and arterial spin tagging.
 which is passing through brain tissue on a T2* 0.2 mmol/kg (roughly double at a high flow rate (3-5 cc/sec) 10 to 12 s after scan initiation. Blood oxygen level and arterial spin tagging..")
10
The signal intensity declines as contrast material passes through the infarcted area and returns to normal as it exits this area. A curve is derived from this tracing data (ie, signal washout curve), which represents and estimates the cerebral blood volume (CBV).
, which represents and estimates the cerebral blood volume (CBV)..")
11
Diffusion and perfusion mismatch

12
Take home msg

13
Copyright ©2005 American Heart Association Topakian, R. et al. Stroke 2005;36:e162-e164 BeforeAfter thrombolysis

16
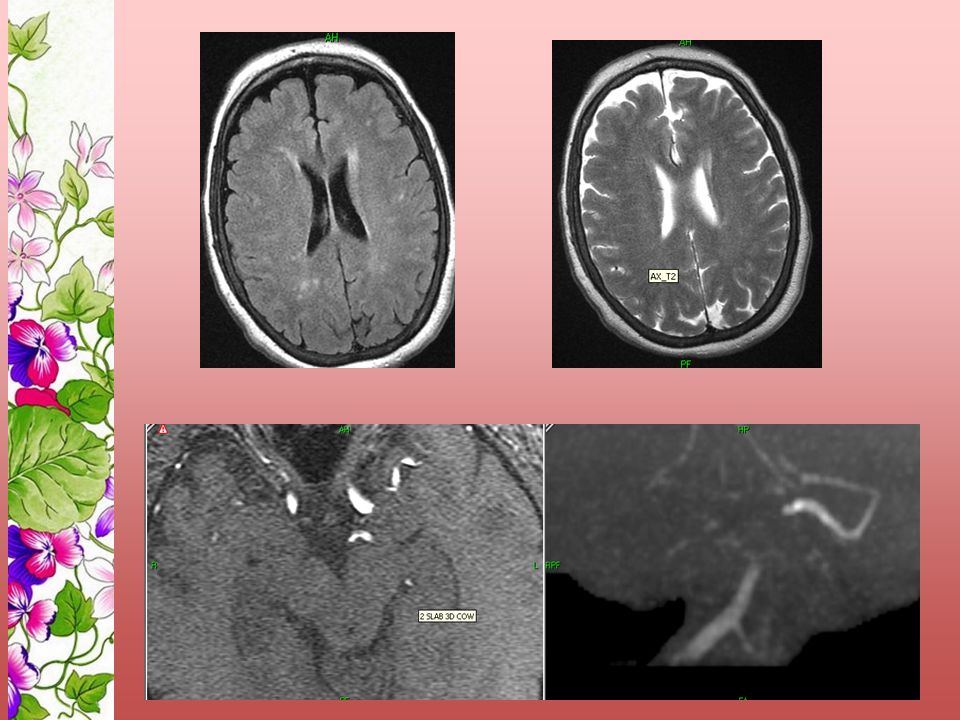
Although conventional MRI sequences often do not show evidence of stroke in the acute phase, conventional MRI may show signs of intravascular thrombus such as absence of flow void on T2-WI, vascular hyperintensity on FLAIR.

17
80 yr old male with right TIA T2

18
MRI in acute stroke – Acute phase (1-7 d) Edema maximizes at 48-72 h and MRI signals become more prominent and well demarcated. Hypo intensity on T1-WI and as a hyperintense area on T2-WI. Mass effect. Arterial enhancement usually persists throughout the acute phase Parenchymal enhancement appreciated at the end of this phase in complete infarction.

19
In incomplete infarction, the parenchymal enhancement is usually earlier. Reperfusion occurs and both petechial and frank hemorrhage can be observed, typically 24-48 hours after the onset of the stroke. Usually, petechial hemorrhages cause the "fogging" phenomenon, due to hemoglobin degradation products, that masks the infarction on both T1-WI and T2-WI.

20
Acute stroke (0-6 hr)NECT/ MRI+ DWIHgge +No therapyNo Hgge0-3 hrsIV thrombolysis3-6 hrsCTA+CTP/MRA+PWI IC thrombus with penumbra IA therapy No penumbra ± thrombus IA therapy is not useful
NECT/ MRI+ DWIHgge +No therapyNo Hgge0-3 hrsIV thrombolysis3-6 hrsCTA+CTP/MRA+PWI IC thrombus with penumbra IA therapy No penumbra ± thrombus IA therapy is not useful")
22
30 yr female Acute demyelination

24
Acute infarct in a background of chronic small vessel disease

27
Comatose 64 yr old

28
Hyperacute infarct

31
TimeMRI FindingEtiology 2-3 minDWI - Reduced ADC Decreased motion of protons 2-3 min PWI - Reduced CBF, CBV, MTT Decreased CBF 0-2 h T2-WI - Absent flow void signal Slow flow or occlusion 0-2 h T1-WI - Arterial enhancement Slow flow 2-4 h T1-WI - Subtle sulcal effacement Cytotoxic edema 2-4 h T1-WI - Parenchymal enhancement Incomplete infarction 8 h T2-WI - Hyperintense signal Vasogenic and cytotoxic edema 16-24 h T1-WI - Hypointense signal Vasogenic and cytotoxic edema 5-7 d Parenchymal enhancement Complete infarction

Similar presentations


 Sensitive indicator of perfusion Diagnosis and prognosis of.>")


