Download presentation
Presentation is loading. Please wait.

1
Analysis of Variance and Covariance

2
Chapter Outline 1) Overview 2) Relationship Among Techniques 3) One-Way Analysis of Variance 4) Statistics Associated with One-Way Analysis of Variance 5) Conducting One-Way Analysis of Variance i. Identification of Dependent & Independent Variables ii. Decomposition of the Total Variation iii. Measurement of Effects iv. Significance Testing v. Interpretation of Results

3
6) Illustrative Applications of One-Way Analysis of Variance 7) Assumptions in Analysis of Variance 8) N-Way Analysis of Variance 9) Analysis of Covariance 10) Issues in Interpretation i. Interactions ii. Relative Importance of Factors iii. Multiple Comparisons 11) Repeated Measures ANOVA 12) Nonmetric Analysis of Variance
 Repeated Measures ANOVA 12) Nonmetric Analysis of Variance.")
4
13) Multivariate Analysis of Variance 14) Internet and Computer Applications 15) Focus on Burke 16) Summary 17) Key Terms and Concepts 18) Acronyms
 Multivariate Analysis of Variance 14) Internet and Computer Applications 15) Focus on Burke 16) Summary 17) Key Terms and Concepts 18) Acronyms")
5
Relationship Among t Test, Analysis of Variance, Analysis of Covariance, & Regression Fig. 16.1

6
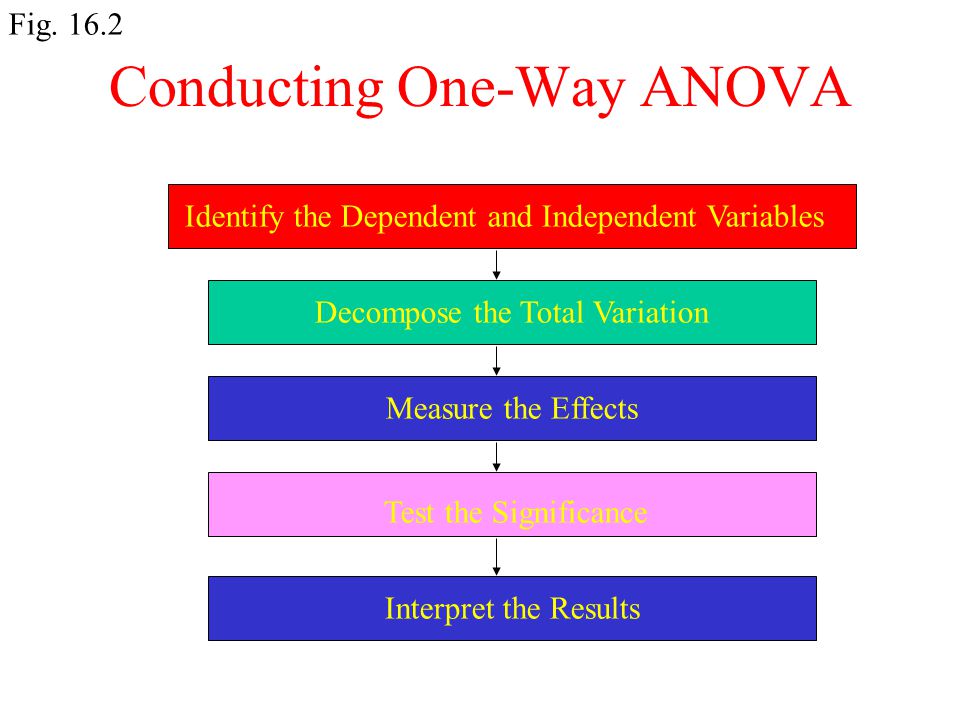
Conducting One-Way ANOVA Identify the Dependent and Independent Variables Decompose the Total Variation Measure the Effects Test the Significance Interpret the Results Fig. 16.2
7
Independent VariableX Total CategoriesSample X1X2X3…Xc Y1Y1Y1Y1Y1 Y2Y2Y2Y2Y2 : : YnYnYnYnYN Y1Y2Y3YcY Within Category Variation =SSwithin Between Category Variation = SS between Total Variation =SS y Category Mean Decomposition of the Total Variation: One-Way ANOVA Table 16.1

8
Table 16-2

9
Store Level of In-Store Promotion NumberHigh MediumLow 110 85 29 87 310 76 48 94 59 65 68 42 79 53 8 7 52 97 61 106 42 Column totals83 6237 Category means:83/10 62/1037/10 Y= 8.3 = 6.2= 3.7 Grand mean: Y= (83 + 62 + 37)/30 = 6.067 j Effect of In-Store Promotion on Sales Table 16.3
/30 = j Effect of In-Store Promotion on Sales Table 16.3")
10
Cell means Level of CountMean Promotion High (1)108.300 Medium (2)106.200 Low (3)103.700 TOTAL306.067 Source of Sum ofdfMean F ratio F prob. Variationsquaressquare Between groups106.067253.033 17.944 0.000 (Promotion) Within groups79.800272.956 (Error) TOTAL185.867296.409 One-Way ANOVA: Effect of In-store Promotion on Store Sales Table 16.4
 Within groups (Error) TOTAL One-Way ANOVA: Effect of In-store Promotion on Store Sales Table")
11
Source ofSum ofMean Sig. of Variationsquares dfsquare F F Main Effects Promotion106.067 253.033 54.862.000.557 Coupon 53.333 153.333 55.172.000.280 Combined159.400 353.133 54.966.000 Two-way 3.267 21.633 1.690.226 interaction Model162.667 532.533 33.655.000 Residual (error) 23.200 240.967 TOTAL185.867 296.409 2 Two-Way Analysis of Variance Table 16.5
 TOTAL Two-Way Analysis of Variance Table")
12
Cell Means PromotionCoupon Count Mean High Yes 5 9.200 High No 5 7.400 Medium Yes 5 7.600 Medium No 5 4.800 Low Yes 5 5.400 Low No 5 2.000 TOTAL 30 Factor Level Means PromotionCoupon Count Mean High 10 8.300 Medium 10 6.200 Low 10 3.700 Yes 15 7.400 No 15 4.733 Grand Mean 30 6.067 Table 16.5 Contd.

13
Possible Interaction Effects No Interaction (Case 1) Interaction Ordinal (Case 2) Disordinal Noncrossover (Case 3) Crossover (Case 4) A Classification of Interaction Effects Figure 16.3
 Interaction Ordinal (Case 2) Disordinal Noncrossover (Case 3) Crossover (Case 4) A Classification of Interaction Effects Figure 16.3")
14
Y XXX 111213 Case 1: No Interaction Patterns of Interaction Figure 16.4 X 22 X 21 XXX 111213 X 22 X 21 Y Case 2: Ordinal Interaction Y XXX 111213 X 22 X 21 Case 3: Disordinal Interaction: Noncrossover Y XXX 111213 X 22 X 21 Case 3: Disordinal Interaction: Noncrossover

15
Sum ofMeanSig. Source of Variation SquaresdfSquare Fof F Covariance Clientele 0.8381 0.838 0.862.363 Main effects Promotion 106.067253.03354.546.000 Coupon 53.333153.33354.855.000 Combined 159.400353.13354.649.000 2-Way Interaction Promotion* Coupon 3.2672 1.633 1.680.208 Model 163.505627.25128.028.000 Residual (Error) 22.36223 0.972 TOTAL 185.86729 6.409 CovariateRaw Coefficient Clientele -0.078 Analysis of Covariance Table 16.6
 TOTAL CovariateRaw Coefficient Clientele Analysis of Covariance Table")
16
Independent VariableX SubjectCategoriesTotal No.Sample X1X2X3…Xc 1Y11Y12Y13Y1cY1 2Y21Y22Y23Y2cY2:: nYn1Yn2Yn3YncYN Y1Y2Y3YcY Between People Variation =SS between people Total Variation =SSy Within People Category Variation = SS within people Category Mean Decomposition of the Total Variation: Repeated Measures ANOVA Table 16.7

17
A study examined marketing professionals’ perceptions of the commonality of unethical marketing research practices on a cross- national basis. The sample of marketing professionals was drawn from Australia, Canada, Great Britain, and the United States. Respondents’ evaluations were analyzed using computer programs for MANOVA and ANOVA. Country of respondent comprised the predictor variable in the analysis, and 15 commonality evaluations served as the criterion variables. The F-values from the ANOVA analyses indicated that only two of the 15 commonality evaluations achieved significance (p<.05 or better). Further, the MANOVA F value was not significant, implying the lack of overall differences in commonality evaluations across respondents of the four countries. Therefore, it was concluded that marketing professionals in the four countries evince similar perceptions of the commonality of unethical marketing research practices. The finding is not surprising, given research evidence that organizations in the four countries reflect similar corporate cultures. The Commonality of Unethical Research Practices Worldwide RIP 16.1
. Further, the MANOVA F value was not significant, implying the lack of overall differences in commonality evaluations across respondents of the four countries. Therefore, it was concluded that marketing professionals in the four countries evince similar perceptions of the commonality of unethical marketing research practices. The finding is not surprising, given research evidence that organizations in the four countries reflect similar corporate cultures. The Commonality of Unethical Research Practices Worldwide RIP")
18
In order to investigate differences between research ethics judgements in men and women, the statistical techniques of MANOVA and ANOVA were used. Respondents were asked to indicate their degree of approval with regards to series of scenarios involving decisions of an ethical nature. These evaluations served as the dependent variable in the analysis, while sex of the respondent served as the independent variable. MANOVA was used for multivariate analysis and its resultant F value was significant at the p<0.001 level - indicating that there was an “overall” difference between males and females in research ethics judgements. Univariate analysis was conducted via ANOVA, and F values indicated that three items were the greatest contributors to the overall gender difference in ethical evaluations: the use of ultraviolet ink to precode a mail questionnaire, the use of an ad that encourages consumer misuse of a product, and unwillingness by researcher to offer data help to an inner city advisory group. “MAN” OVA Demonstrates that Man is Different from Women RIP 16.2

Similar presentations
Overview 2)Relationship Among Techniques 3) One-Way Analysis of Variance 4)Statistics Associated.>")


?>")


