Download presentation
Presentation is loading. Please wait.

1
Mathematics Mrs. Sharon Hampton

2
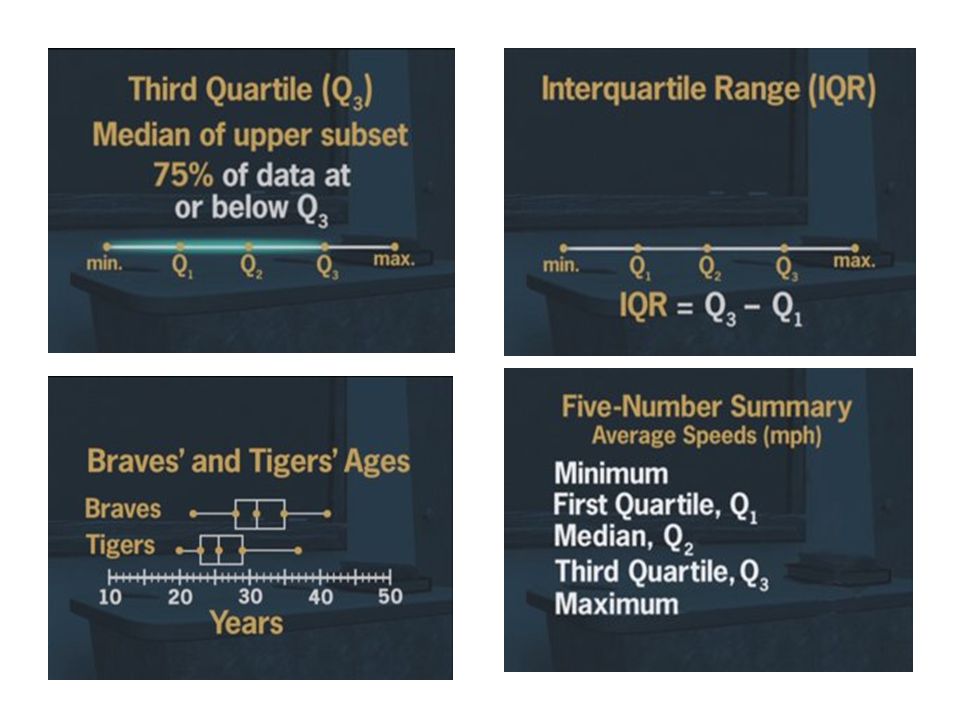
VOCABULARY Lower extreme: the minimum value of the data set Lower quartile: Q1 the median of the lower half of the data set (divides the lower half into two equal parts) Median: Q2 divides a data set into two equal parts Upper quartile: Q3 the median of the upper half of the data set (divides the upper half into two equal parts) Upper extreme: the maximum value of the data set Interquartile range: the difference between the upper quartile and the lower quartile. It represents the middle half or 50% of the data in the set. Outliers: values separated from the rest of the data (more than 1.5 times the IQR from the quartiles) not included in the whiskers of the box-and-whisker graph
 not included in the whiskers of the box-and-whisker graph.")
5
HOW TO FIND OUTLIERS 1)Find the IQR ( Q3-Q1) 2)Multiply the IQR by 1.5 3)Add the result to Q3 -- if you have data values greater than this sum those are outliers 4)Subtract the result from Q1-- if you have data values less than this difference those are outliners
Find the IQR ( Q3-Q1) 2)Multiply the IQR by 1.5 3)Add the result to Q3 -- if you have data values greater than this sum those are outliers 4)Subtract the result from Q1-- if you have data values less than this difference those are outliners")
6
Using the TI-83 Plus Smart View with the SMART Board

7
DATA SET {85,100,97,84,73,89,73,65,50,83,79,92,78,10} Step 1: Enter data Stat/enter/^/clear/enter Then enter data into L1 Input each number and press enter Step 2: Choose the type of graph -- Press 2 nd [stat plot] enter choose plot 1 Highlight ON, modified box-and-whisker plot for type., L1 for xlist, and 1 as frequency. Step 3: Choose the display window -- Press window and choose appropriate settings for x value. The calculator ignores the y-values when plotting box-and- whisker graphs. Step 4: Display the graph -- Press graph pres trace and the arrow keys to determine the five key data points.
![DATA SET {85,100,97,84,73,89,73,65,50,83,79,92,78,10} Step 1: Enter data Stat/enter/^/clear/enter Then enter data into L1 Input each number and press enter Step 2: Choose the type of graph -- Press 2 nd [stat plot] enter choose plot 1 Highlight ON, modified box-and-whisker plot for type., L1 for xlist, and 1 as frequency.](http://images.slideplayer.com/11/3261898/slides/slide_7.jpg "Step 3: Choose the display window -- Press window and choose appropriate settings for x value. The calculator ignores the y-values when plotting box-and- whisker graphs. Step 4: Display the graph -- Press graph pres trace and the arrow keys to determine the five key data points..")
8
Enter DataChoose the type of graph Choose the display windowDisplay the graph

9
Five Number Summary The "five number summary", or five statistical summary", consists of (1) the minimum, (2) the maximum, (3) the median, (4) the first quartile and (5) the third quartile. Find the "five number summary" for the data set {85, 100, 97, 84, 73, 89, 73, 65, 50, 83, 79, 92, 78, 10}.

10
Method 1. A box and whisker plot will clearly show a five number summary. See box-and-whiskers for information on creating these graphs. Pressing the TRACE key will display the values. The whiskers extend from the minimum data point in the set to the first quartile, and from the third quartile to the maximum point. The box itself is defined by Q1, the median and Q3. The spider will jump from the minimum value to Q1, to median, to Q3 and to the maximum value.box-and-whiskers

11
Method 2. A complete five number summary is displayed on the lower portion of the 1-Var Stats screen. Enter the data in a list. Go to STAT - CALC and choose 1-Var Stats On the HOME screen, when 1-Var Stats appears, type the list containing the data. Hit ENTER. When the 1-Var Stats information appears, notice that there is an arrow pointing downward at the bottom of the screen. Arrow down. The five number summary is the listed as the last 5 items on this screen.

Similar presentations

: the 25 th percentile Median: the.>")

 13.2 Measures of Center and Spread>")


. Comparing Data Using Boxplots Each section of the boxplot represents 25% of the data. The median (50%tile) is the line.>")


. Boxplot and Modified Boxplot 25% of data in each section.>")


