Download presentation
Presentation is loading. Please wait.

1
Diplomas Now benefits students, their schools and communities

2
How to Read the 2012-2013 Q1 Reports

3
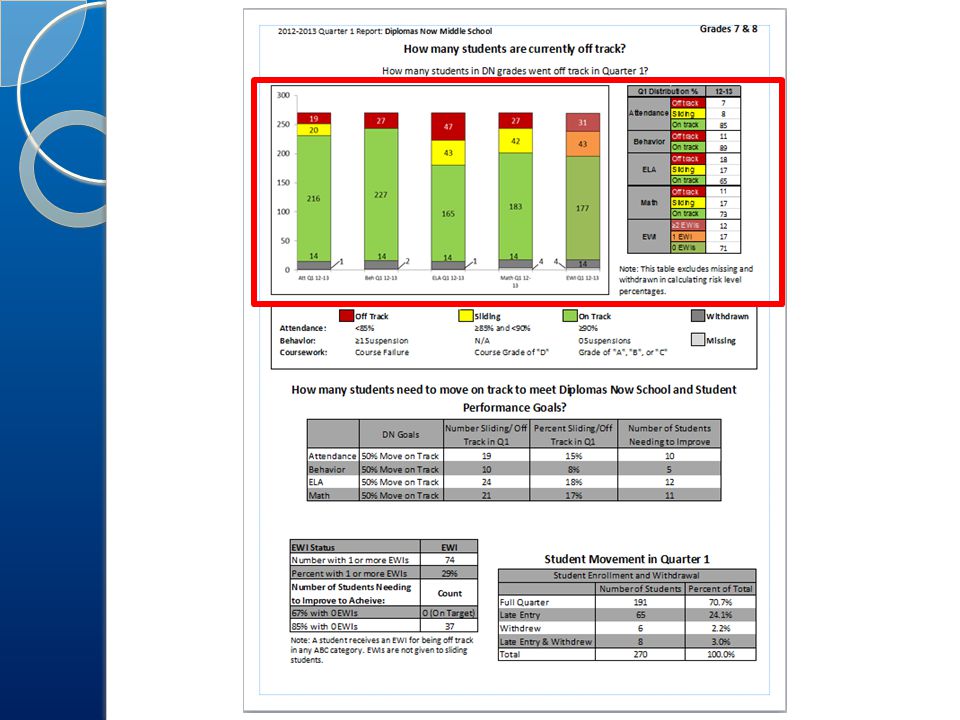
Contents of the Quarter 1 Report Student risk level distributions School progress towards DN goal attainment Student mobility Results are reported for: ◦ overall school level (all DN grades combined) ◦ individual grade level.
 ◦ individual grade level.")
4
ABC Risk Level Criteria Risk CategoryOn TrackSlidingOff Track AttendanceADA ≥ 90%ADA ≥ 85% and <90%ADA < 85% Behavior0 Out-of-School Suspensions N/A1 or more Out-of- School Suspensions English/Language ArtsCourse Grade of A, B, or C Course Grade of DCourse Grade of F or Course Failure MathCourse Grade of A, B, or C Course Grade of DCourse Grade of F or Course Failure

5
Early Warning Indicators Given to students Off Track in an ABC category Sliding and On-Track students do not receive EWIs Students may have from 0 to 4 IDAttendanceBehaviorELAMathEWI 1564354Off Track On Track 2

7
Distribution Graph The first four bars ◦ distributions of Q1 performance in each ABC category The final bar ◦ distribution of students based on their respective number of EWIs. ABC Categories EWI Score ColorMeaning GreenOn Track in ABC Categories YellowSliding in ABC Categories RedOff Track in ABC Categories Kiwi Green0 Early Warning Indicators Orange1 Early Warning Indicator Light Red2-4 Early Warning Indicators Light GreyMissing Q1 Data Dark GreyWithdrew during Q1

8
Distribution Percentage Chart Percentages based on distributions Calculated by dividing the total number of students at each risk level by the total number of students who were on-track, sliding, or off-track. Missing and withdrawn students are excluded from these calculations ABC Category Risk Level Percentage

9
Schools with Data from Last Year Note: This table excludes missing and withdrawn in calculating risk level percentages. 6 th Grade

11
DN End of Year Goals Overall EWI Distribution: At least 67% (two-thirds) of students within DN focus grades have no EWIs at the end of the school year. Attendance Of students that were sliding/off-track at any data point: 50% or more move on-track Behavior Of students that were sliding/off-track at any data point: 50% or more move on-track ELA/Literacy Of students that were sliding/off-track at any data point: 50% or more move on-track Math Of students that were sliding/off-track at any data point: 50% or more move on-track Off-trackOn-track Attendance: ≤90% average daily attendance >90% average daily attendance Behavior: 1 or more suspensionsno suspensions ELA/Literacy: a “D” or an “F” ELA gradea “C” or higher ELA grade Math: a “D” or an “F” math gradea “C” or higher math grade *Comparative data must be across two data submissions On-track/Off-track Definitions

12
DN Performance Goals Chart Shows school and grade targets for DN goal attainment based on Q1 performance. Third column ◦ Number of students who were sliding or off track in Q1. Fourth column ◦ Percent of students sliding or off track in Q1 Final column ◦ Number of students who need to move from sliding or off track to on track in order for the school to meet the DN goals for that ABC category

14
EWI Status Chart Shows ◦ Number and percentage of students with EWIs in Q1 ◦ Number of students needing to improve to meet 67% and 85% goals. EWIs are only given to students who are off track in at least one ABC category DN goal for EWIs is that 67% of students will have 0 EWIs at the end of the year. If a goal is already met, then “0 (On Target)” is written in the chart.
 is written in the chart..")
16
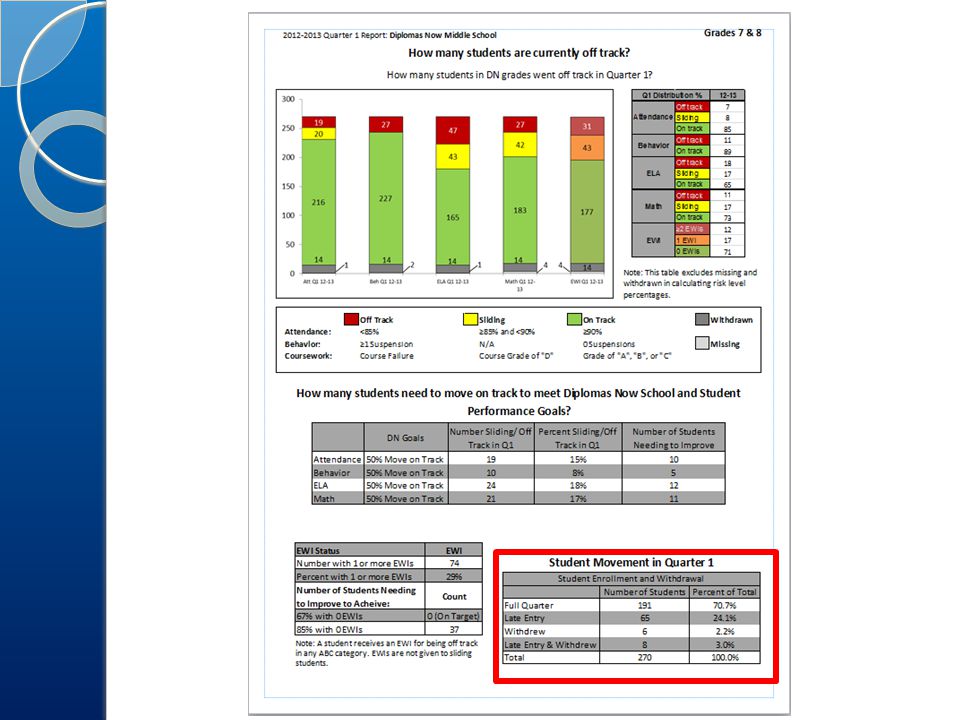
Student Movement Chart Distributions and percentages of students who: ◦ Enrolled the entire quarter ◦ Enrolled late ◦ Withdrew in Marking Period 1 ◦ Both enrolled late and withdrew in Marking Period1 Only present if school submits enrollment and withdrawal data

Similar presentations


>")


 Board Presentation March 25, 2008.>")


