Download presentation
Presentation is loading. Please wait.

1
Lecture 14 - Complex Traits and QTL Maping Doerge (2001) Nature Genetics Reviews 3:43-52 Neale, chapter 18 Liu, chapters 13-14
 Nature Genetics Reviews 3:43-52 Neale, chapter 18 Liu, chapters 13-14")
3
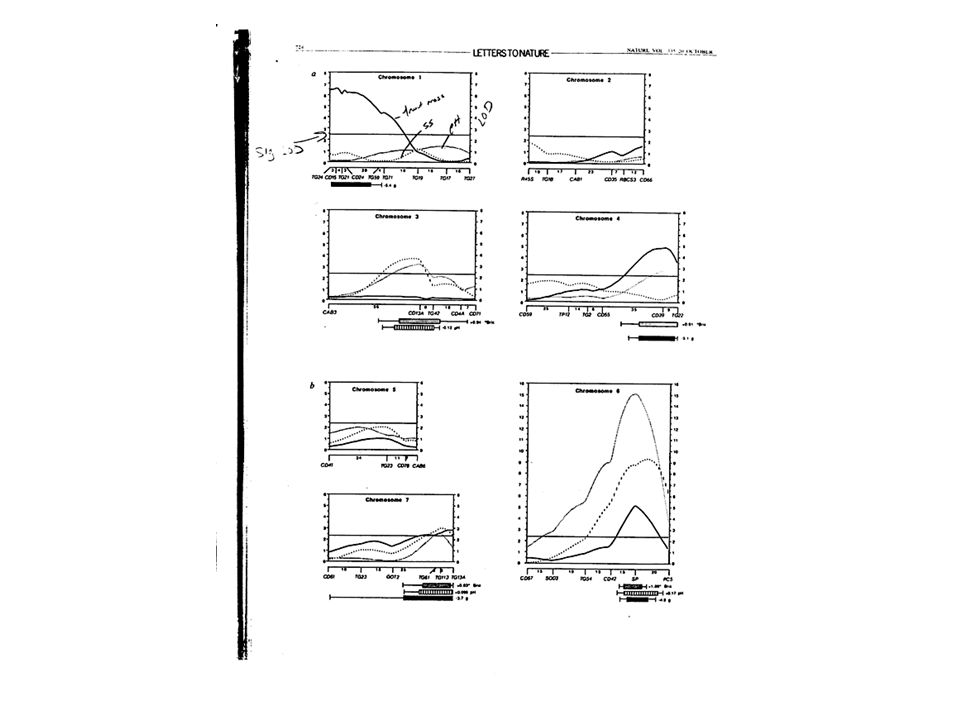
Figures from Lander and Schork, Science, 265-September 1994-pp2037

4
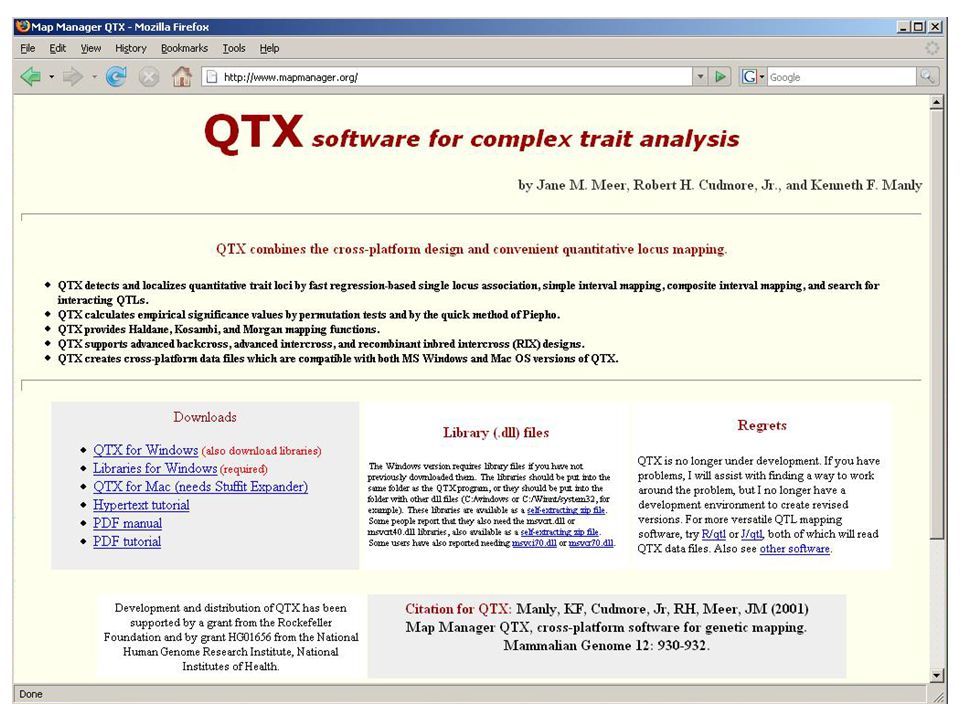
QTL Mapping Mapping population Markers and a map Phenotypes (trait measurements) QTL mapping software
 QTL mapping software")
5
Distribution of Phenotypic Values Continuous Catagorical Binary

6
Pitch Canker Phenotypes Fusiform Rust Phenotypes SusceptibleResistant SmallRoughLarge

8
QTL Mapping - Basic Approaches Single-factor mapping Interval mapping

9
X A1 Q1 B1 A1 Q1 B1 A2 Q2 B2 A2 Q2 B2 Genotypic value= 20 Genotypic value= 4 A1 Q1 B1 A2 Q2 B2 A2 Q2 B2 A2 Q2 B2 X A1 Q1 B1 A2 Q2 B2 A2 Q2 B2 A2 Q2 B2 A1 Q1 B2 A2 Q2 B2 A2 Q2 B1 A2 Q2 B2 Genotypic value= 12 Genotypic value= 4 12 4 4 A1-A2 = (12+12) -(4+4) = 16 B1-B2 = (12+4) -(12+4) = 0 Genotypic Value Q1= 10 Q2 =2 Q = additive
 -(4+4) = 16 B1-B2 = (12+4) -(12+4) = 0 Genotypic Value Q1= 10 Q2 =2 Q = additive")
10
Edwards et al. 1987, Genetics, 113-125 Single factor QTL mapping

11
Advantages of Single Factor QTL Mapping No map needed Standard stat packages, SAS

12
Disdvantages of Single Factor QTL Mapping Map position not precisely determined Biased estimates of a and d Phenotypic effect overestimated Multiple testing

13
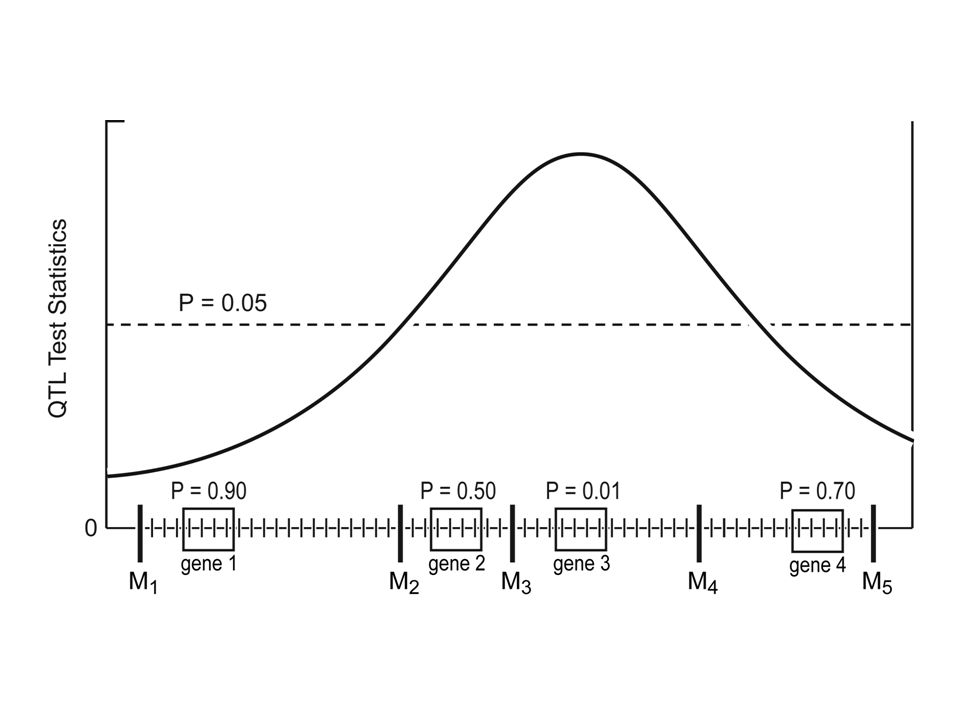
Interval Mapping Fig 21.1 from Falconer and Mackay. Pg 364 Recombination frequencies between two marker loci, M and N, and a QTL, A M1 N1A1 M2 N2A2 c2 c1 c

14
Table 21. 3. Falconer and Mackay

16
Advantages of Interval QTL Mapping More precise location of QTL Better estimates of %PVE

17
Disdvantages of Interval QTL Mapping Computationally demanding Custom software

18
ewsg lwsg vol% emfa lmfa ecwc lcwc DETECTION VERIFICATION RELATED UNRELATED Aco_1 0.0 PtIFG_3012_43 12.7 15.0 PtIFG_2150_A 19.6 19.9 PtIFG_2885_B 20.1 estPtIFG_8569_a 29.5 PtIFG_2538_B 30.2 PtIFG_2564_A 40.3 PtIFG_1A7_A 42.6 estPtIFG_9022_a 43.1 PtIFG_2536_1 46.5 PtIFG_1A7_D 46.8 estPtIFG_48_a 58.3 estPaINRA_PAXY13_a 59.5 estPtIFG_464_a 62.2 PtIFG_1633_a 66.0 PtIFG_48_1 78.4 estPtIFG_8939_a PtIFG_3006_1 83.4 PtIFG_1918_h 83.8 86.1 86.3 PtIFG_1623_A 90.9 estPtIFG_66_a 92.8 94.6 PtIFG_1626_a 95.4 PtIFG_2986_A 102.7 PtIFG_1D11_A 104.0 PtIFG_1165_a 121.1 6Pgd_11 140.7 estPpaINRA_AS01C10-1_a 154.6 LG 2 PtIFG_2006_C 0.0 estPtIFG_1934_a 0.3 PtIFG_2145_1 3.4 PtIFG_2068_A 7.8 PtIFG_2897_d 10.4 PtIFG_975_3 12.2 estPtIFG_8500_a 18.8 PtIFG_138_B 24.1 estPtNCS_22C5_a 30.1 PtIFG_2588_1 32.5 estPtNCS_C612F_a 33.8 PtIFG_2718_3 44.8 PtIFG_2745_1 54.2 PtIFG_1918_3 57.4 59.5 estPtIFG_8612_a 64.2 PtIFG_2090_2 67.6 69.4 PtIFG_1636_3 70.1 78.2 PtIFG_2988_21 83.6 PtIFG_2718_1 86.8 estPtIFG_2889_a 95.7 PtIFG_2889_21 98.9 estPtIFG_8781_a 104.1 PtIFG_2145_76 107.4 PtIFG_2145_5 109.0 113.4 PtIFG_1D9_2 113.6 116.2 LG 3 C4H-1 Pta14A 9 SAMS-1 DETECTION VERIFICATION RELATED UNRELATED DETECTION VERIFICATION RELATED UNRELATED PtIFG_2819_12 PtIFG_653_d PtIFG_2086_13 PtIFG_1626_c PtIFG_2697_A PtIFG_2006_A estPtINCS_20G2_a estPtIFG_9053_a estPtIFG_8843_a PtUME_Ps3_A estPtIFG_8537_a estPtIFG_2253_a estPpINR_AS01G01_a estPtIFG_1576_a PtIFG_2253_A PtIFG_2782_31 PtIFG_1457_b estPtIFG_9198_a estPtIFG_8496_a PtIFG_2146_31 PtIFG_2441_1 estPtIFG_107_a PtIFG_2931_b estPtNCS_6N3E_a PtIFG_2393_1 PtIFG_2931_A PtIFG_851_1 LG 1 LAC GlyHMT PtNCS_CAD-08_b SCALE 0 cM 10 cM Brown et al. 2003 Genetics164:1537-46

20
What can be learned from a QTL mapping experiment Estimate of number of genes controlling complex trait Location of genes in the genome Estimates of a and d Estimate of %PVE

Similar presentations


>")
 t-tests Interval Mapping Method (Lander and Botstein,>")


