Download presentation
Presentation is loading. Please wait.

2
Our group measured… Arm length- From shoulder to farthest finger tip. Wrist circumference- Wrapped tape measure around the subject’s wrist. Lower Leg- (Had subject sit down) From top of knee to ankle. Actual height and gender were also collected.
 From top of knee to ankle. Actual height and gender were also collected..")
4
Describe graph (form, direction, strength) Give correlation value (r) LSR line Interpret slope… Interpret r-squared… Describe residual plot (form, outliers) Is the linear model appropriate? Use correlation, residual plot, and original plot

6
FEMALES: Describe female plot List Female LSR line List female correlation List female r-squared Describe female resid plot and comment on fit of linear model for females

7
MALES: Describe male plot List male LSR line List male correlation List male r-squared Describe male resid plot and comment on fit of linear model for males

8
Compare male and female data

10
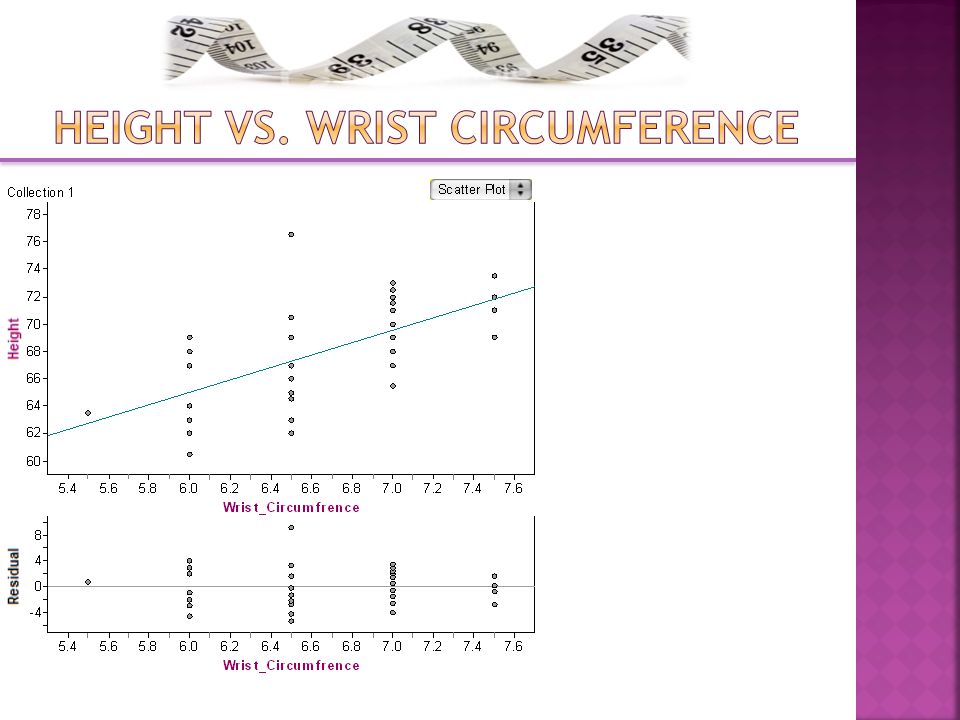
Describe graph (form, direction, strength) Give correlation value (r) HEIGHT = a + b(wrist circ) Interpret slope… Interpret r-squared… Describe residual plot (form, direction, strength) Is the linear model appropriate? Use correlation, residual plot, and original plot

11
Same gender analysis as before See slides 5 – 8

13
Describe graph (form, direction, strength) Give correlation value (r) HEIGHT = a + b(arm length) Interpret slope… Interpret r-squared… Describe residual plot (form, direction, strength) Is the linear model appropriate? Use correlation, residual plot, and original plot

14
Same gender analysis as before See slides 5 – 8

15
Justify choice

16
Justify choices

17
(use gender specific models) Partner #1 Lower leg measurement = 17.5 inches Height = 21.2 + 2.68(17.5) = 68.1 inches Actual Height = 64 inches Residual = 64 – 68.1 = -4.1 inches Overestimate Partner #2 Lower leg measurement = 18 inches Height = 21.2 + 2.68(18) = 69.44 inches Actual Height = 67 inches Residual = 67 – 69.44 = -2.44 inches Overestimate Partner #3 Lower leg measurement = 17.5 inches Height = 21.2 + 2.68(17.5) = 68.1 inches Actual Height = 71 inches Residual = 71 – 68.1 = 2.9 Underestimate
 Partner #1 Lower leg measurement = 17.5 inches Height = (17.5) = 68.1 inches Actual Height = 64 inches Residual = 64 – 68.1 = -4.1 inches Overestimate Partner #2 Lower leg measurement = 18 inches Height = (18) = inches Actual Height = 67 inches Residual = 67 – = inches Overestimate Partner #3 Lower leg measurement = 17.5 inches Height = (17.5) = 68.1 inches Actual Height = 71 inches Residual = 71 – 68.1 = 2.9 Underestimate")
18
(use gender specific models) Mrs. McNelis Height = 2.68(17.5) + 21.2 = 68.1 inches Mrs. Ladley Height = 2.68(17.5) + 21.2 = 68.1 inches Mr. Smith Height = 5.2(17) + 10.4 = 66.8 inches Mrs. Tannous Height = 2.68(17.5) + 21.2 = 68.1 inches Miss Gemgnani Height = 2.68(17.5) + 21.2 = 68.1 inches Mrs. Bolton Height = 2.68(17) + 21.2 = 66.8 inches
 = 68.1 inches Mr. Smith Height = 5.2(17) = 66.8 inches Mrs. Tannous Height = 2.68(17.5) = 68.1 inches Miss Gemgnani Height = 2.68(17.5) = 68.1 inches Mrs. Bolton Height = 2.68(17) = 66.8 inches.")
19
State how confident you are in your predictions of the guest teachers, and JUSTIFY WHY!

20
Create linear model for best measurement and copy onto ppt

21
Do lin Reg t test using the output above Ho: β 1 = 0 Ha: β 1 >, <, ≠ 0 Conditions (with graphs! Do not say “see previous slides”) & statement t = b1 – 0 = # SEb P(t > ______|df = n—2) = We reject Ho…. We have sufficient evidence… Therefore…
 & statement t = b1 – 0 = # SEb P(t > ______|df = n—2) = We reject Ho…. We have sufficient evidence… Therefore….")
22
Since we rejected Ho, we need to complete a conf. int. Statement b + t*(SE b ) = (____, ____) We are 90% confident that for every 1 X variable unit increase, the Y variable increases btw ____ and ____ units on average.
 = (____, ____) We are 90% confident that for every 1 X variable unit increase, the Y variable increases btw ____ and ____ units on average..")
23
Summary Stats: (do not copy this table from Fathom. Instead, type these on your slide neatly)
")
24
Ho: μ males = μ females Ha: μ males ≠ μ females Conditions & statement t = mean1– mean2 = s 1 2 + s 2 2 n1 n2 2* P(t > _______| df = ___) = We reject….. We have sufficient evidence ….

25
If you reject Ho, complete an appropriate confidence interval

26
DO NOT put this type of table on your power point!! Write out the numbers neatly.

27
Ho: μ males = μ females Ha: μ males ≠ μ females Conditions & statement t = mean1– mean2 = s 1 2 + s 2 2 n1 n2 2* P(t > _______| df = ___) = We reject….. We have sufficient evidence ….

28
If you reject Ho, complete an appropriate confidence interval

29
List and explain possible sources of bias and error in your project.

30
Make conclusions about ALL of your data analysis Each measurement Each test of significance and confidence interval Overall conclusion about predicting heights Can be a bulleted list with explanation

Similar presentations


 at which their child first crawled.>")


 using the other variable (say X) GOAL: Set up an equation connecting X and Y. Linear regression linear.>")


