Download presentation
Presentation is loading. Please wait.

1
It’s All Bull Seminars UW Extension Livestock Focus Team March 23 rd, 2004-----Elk Mound March 25 th, 2004-----Almond March 26 th, 2004-----Platteville By: Keith Vander Velde, Marquette County Agriculture Agent

2
It’s All Bull Seminars What’s In the Toolbox Overview –History of Selection Tools –Performance Data –Expected Progeny Differences –Selection Indexes – Gene Marker Assisted Selection

3
It’s All Bull The Herd Impact of Three Generations

4
It’s All Bull Lets compare dollars invested 30 cows at $800= $24,000 1 bull at $1,800= $1,800 Each contribute 50% of the genetics

5
Beef Producers’ Motivation Hobby Property tax reduction Profit

6
Genetic Merit of Breeds Van Vleck and Cundiff, 2003

7
Breed Differences Van Vleck and Cundiff, 2003

8
Genetic Merit of Breeds Breeds differ for: –Maintenance –Reproduction –Carcass Genetic merit must match production environment. Some economically relevant traits go unmeasured.

9
Evolution of Seedstock Production Visual selection Performance Testing Expected Progeny Differences Ultra-Sound Measurements DNA Marker Assistance

14
It’s All Bull From 1950-1968 PerformanceTesting Calves were weighed at: Birth Weaning Yearling Calves were compared within herd A ratio of 100 was herd average 50% of herd above average 50% below average

15
It’s All Bull Sire Summaries Began in 1968 –American Simmental Produced first sire summary using herd performance data and reference sires –All breeds followed this example –Allowed bulls and cows to be compared to the entire population in the breed –Expected Progeny Difference were born

16
Heritability Makes It All Possible Portion of a trait’s variation attributable to genetics In general, heritability is: –High for carcass traits and mature size –Moderate for growth rate and milk production –Low for reproductive traits

17
Heritability Highly heritable traits are the easiest to change with selection Traits that are low in heritability can be changed with selection, but change is slower Heritability of a trait is reflected in the range of EPD across a population

18
Heritability of Production Traits about 30 to 35% Birth, Wean, Year. Wts. Feed Intake Feed Conversion Mature Wt. ~ 50%

19
Weaning Weight Genetic Trend

20
Maternal Milk Genetic Trend

21
Heritability of Product Traits about 40% Fat REA Cutabilty Marbling Shear ?

22
Heritability of Reproduction Traits about 20% Conception rate Calving rate Calving ease

23
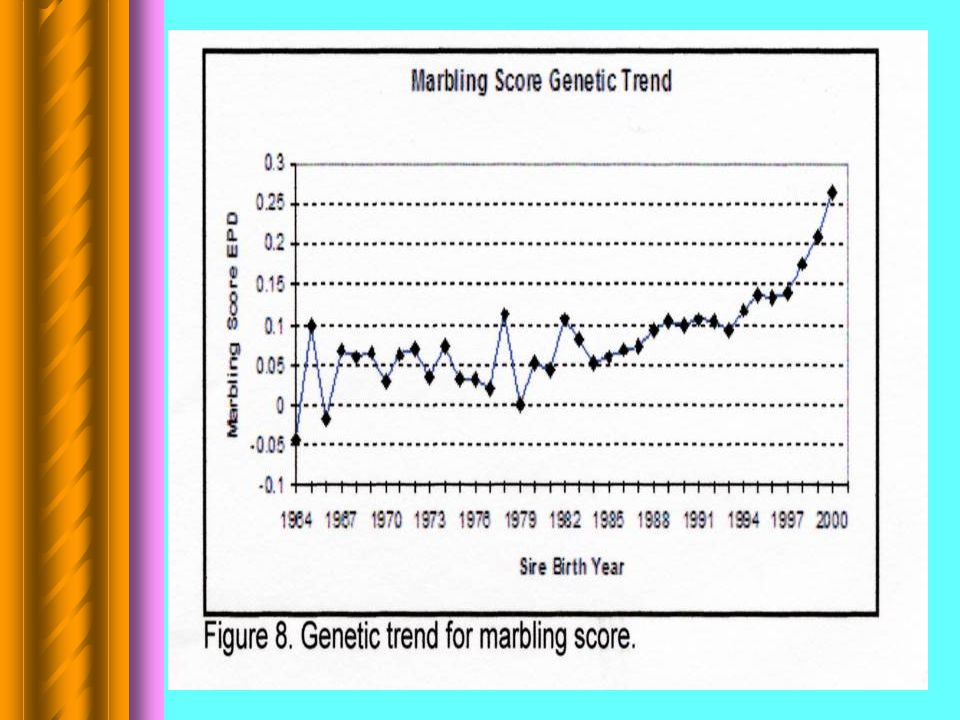
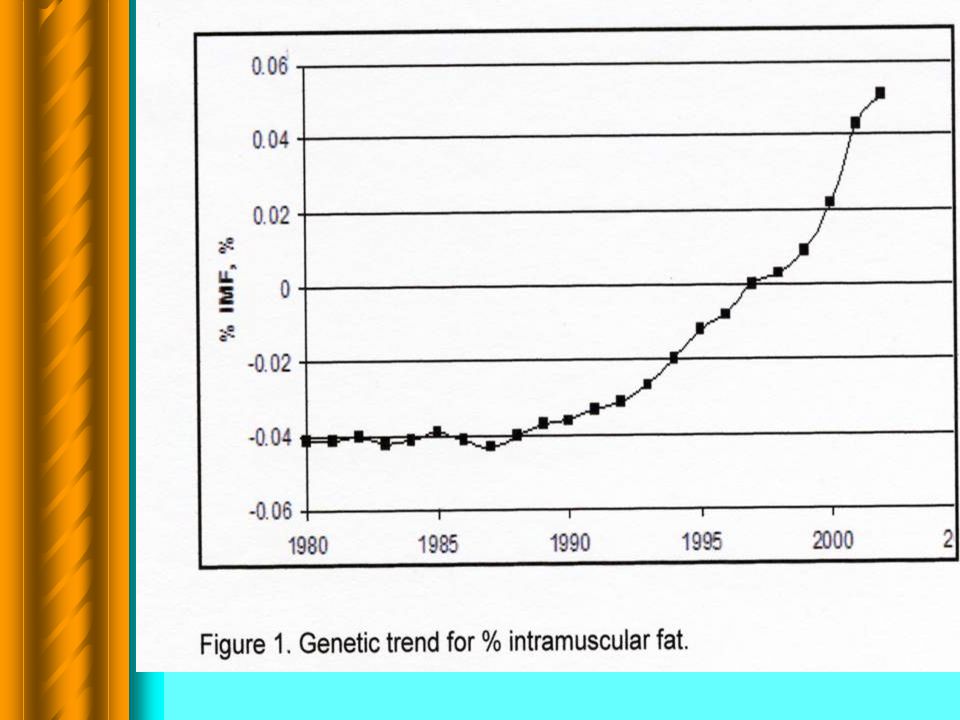
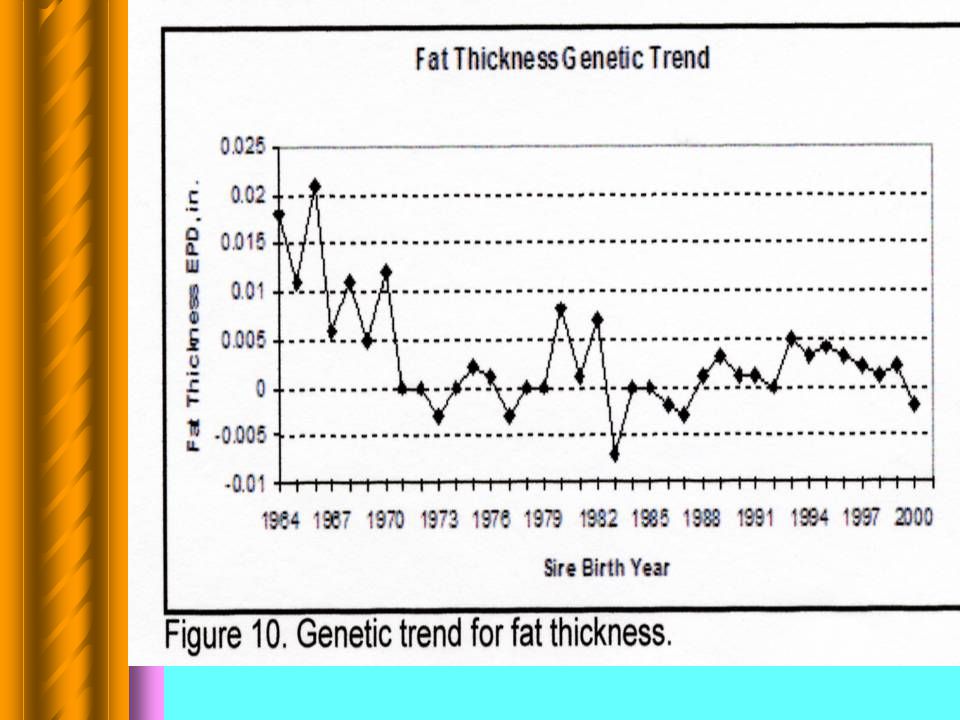
Carcass Traits can be changed Rapidly Using Genetics!!!!!!!!! Angus genetic trends for slaughter and ultrasound data indicate breeders have changed carcass traits in a very short time interval

28
It’s All Bull It is Important to Remember – Highly to moderately heritable traits are usually best changed by direct selection –Traits with low heritability can be changed faster by crossbreeding and taking advantage of heterosis

29
It’s All Bull-Bulls are Different You Decide Which One Matches the Job Do You Have Particular Job in Mind for Your Bull??

30
It’s All Bull-Job Description Bull Needs vary with uses: –Yearling Heifers –Sell calves at weaning –Retain Replacements –Sell as yearlings –Sell as finished Cattle –Sell grade and yield –Sell on the Grid –Sell beef direct to customer

31
BW=+1.3 WW=+68 YR=+116 Milk=+27 It’s All Bull EPD’s==A Look Inside

32
Typical Genetic Evaluation Birth Weight Weaning Weight Milk Total Maternal Yearling Weight Carcass Traits Calving Ease Mix of others…

34
Sire Summary of the Future? Birth direct Birth maternal Weaning direct Weaning maternal Total maternal Yearling direct 600 d direct Calving direct Calving maternal Carcass wt Rib fat Rump fat LMA Marb score Quality grade % Retail yield Lbs (kg) retail yield Yield grade Us LMA US rib fat Us % IMF Fat percentage Condition score Gestation length Days to calving Calving interval Stayability Heifer pregnancy rate Rebreeding rate Calf weaned/cow exposed Scrotal circumference Pelvic area Frame score Muscle score Udder score Docility Tick score Parasite egg count Mature weight Maintenance energy Feed efficiency Drop weight Type score Uterine score Tooth score Precocity score Feedlot feed consumption Feedlot surv. Pre-wean surv. Serving capacity Serving proportion Semen volume Hip height Leg score Length productive life Doing ability Grand-maternal weaning Twinning rate Days to 11mm BF Days to 75% Choice Days to carc wt. Hair whorl score Average daily gain Wt. /day of age Liver weight Resting heart rate Pulmonary arteriole pressure Brisket disease rate Bravery Aggression
 retail yield Yield grade Us LMA US rib fat Us % IMF Fat percentage Condition score Gestation length Days to calving Calving interval Stayability Heifer pregnancy rate Rebreeding rate Calf weaned/cow exposed Scrotal circumference Pelvic area Frame score Muscle score Udder score Docility Tick score Parasite egg count Mature weight Maintenance energy Feed efficiency Drop weight Type score Uterine score Tooth score Precocity score Feedlot feed consumption Feedlot surv. Pre-wean surv. Serving capacity Serving proportion Semen volume Hip height Leg score Length productive life Doing ability Grand-maternal weaning Twinning rate Days to 11mm BF Days to 75% Choice Days to carc wt. Hair whorl score Average daily gain Wt. /day of age Liver weight Resting heart rate Pulmonary arteriole pressure Brisket disease rate Bravery Aggression.")
35
Sire Summary of the Future? Birth direct Birth maternal Weaning direct Weaning maternal Total maternal Yearling direct 600 d direct Calving direct Calving maternal Carcass wt Rib fat Rump fat LMA Marb score Quality grade % Retail yield Lbs (kg) retail yield Yield grade Us LMA US rib fat Us % IMF Fat percentage Condition score Gestation length Days to calving Calving interval Stayability Heifer pregnancy rate Rebreeding rate Calf weaned/cow exposed Scrotal circumference Pelvic area Frame score Muscle score Udder score Docility Tick score Parasite egg count Mature weight Maintenance energy Feed efficiency Drop weight Type score Uterine score Tooth score Precocity score Feedlot feed consumption Feedlot surv. Pre-wean surv. Serving capacity Serving proportion Semen volume Hip height Leg score Length productive life Doing ability Grand-maternal weaning Twinning rate Days to 11mm BF Days to 75% Choice Days to carc wt. Hair whorl score Average daily gain Wt. /day of age Liver weight Resting heart rate Pulmonary arteriole pressure Brisket disease rate Bravery Aggression
 retail yield Yield grade Us LMA US rib fat Us % IMF Fat percentage Condition score Gestation length Days to calving Calving interval Stayability Heifer pregnancy rate Rebreeding rate Calf weaned/cow exposed Scrotal circumference Pelvic area Frame score Muscle score Udder score Docility Tick score Parasite egg count Mature weight Maintenance energy Feed efficiency Drop weight Type score Uterine score Tooth score Precocity score Feedlot feed consumption Feedlot surv. Pre-wean surv. Serving capacity Serving proportion Semen volume Hip height Leg score Length productive life Doing ability Grand-maternal weaning Twinning rate Days to 11mm BF Days to 75% Choice Days to carc wt. Hair whorl score Average daily gain Wt. /day of age Liver weight Resting heart rate Pulmonary arteriole pressure Brisket disease rate Bravery Aggression.")
36
It’s All Bull New Carcass Index Traits in Angus in 2004

37
It’s All Bull Feedlot Value ($F) –Uses Weaning and Yearling Weight EPD’s along with trait interrelationships –Uses typical feedlot gain value,days on feed, feed consumption and cost differences –Trait range -$43 to +$67
 –Uses Weaning and Yearling Weight EPD’s along with trait interrelationships –Uses typical feedlot gain value,days on feed, feed consumption and cost differences –Trait range -$43 to +$67")
38
It’s All Bull Grid Value ($G) –Combines quality grade and yield grade –Gives premiums for Prime,CAB and Choice –Yield grade premiums for YG1and YG2 and discounts YG4 and YG5 –Range -$20 to +$43
 –Combines quality grade and yield grade –Gives premiums for Prime,CAB and Choice –Yield grade premiums for YG1and YG2 and discounts YG4 and YG5 –Range -$20 to +$43")
39
It’s All Bull Beef Value ($B) –Represents the expected average dollar per head difference in progeny post weaning performance and carcass value –Calculated from the Feedlot Value ($F) and the Grid Value ($G) –Designed to be a reflection of feedlot and carcass merit –Value Range -$36 to +$61
 –Represents the expected average dollar per head difference in progeny post weaning performance and carcass value –Calculated from the Feedlot Value ($F) and the Grid Value ($G) –Designed to be a reflection of feedlot and carcass merit –Value Range -$36 to +$61")
40
It’s All Bull Tenderness: Warner Bratzler Shear Force(WBSF) Calpain-enzyme increases tenderness Calpastatin-enzyme inhibits calpain TenderGENE- a DNA marker test for Calpain genes Gene Star Tenderness I-DNA test for less Calpastatin
 Calpain-enzyme increases tenderness Calpastatin-enzyme inhibits calpain TenderGENE- a DNA marker test for Calpain genes Gene Star Tenderness I-DNA test for less Calpastatin")
42
Typical Genetic Evaluation Today EPD’s are: –Proven –Accepted –Well-used In the Future will: –More EPD allow us to better characterize the genetic potential of animals –They be designed for more profitable selection decisions What does the future hold

43
Combining EPD for financially sound selection decisions Selection index (Hazel, 1943) Has been successfully implemented in other livestock species
 Has been successfully implemented in other livestock species")
44
Methods of Multiple-Trait Selection Independent Culling Levels-Sire Search –Most commonly used –Set min/max levels for each trait (EPD) Selection Index- –Most effective for overcoming antagonisms –Weight traits (EPD) on economic importance
 Selection Index- –Most effective for overcoming antagonisms –Weight traits (EPD) on economic importance")
45
Selection Index Selection Index is fairly aggressive Most producers will be able to design a simple index using a spreadsheet such as Microsoft Excel Many breed association and university personnel are working on an index Bull test stations have used indexes for years to determine which bulls qualify for the sale.

47
It’ All Bull What is the value difference in the following two bulls: –Bull AWW EPD = +16 –Bull BWW EPD = +32 –Difference = 16 pounds in EPD Price is $1.05 per pound –16 * 1.05 = $16.80 Assume we will keep replacements for a 400 cow herd

49
Our desire is that producers use EPDs to build indexes that are consistant with their business goal(s) Profit = Income – Expense
 Profit = Income – Expense")
50
It’s All Bull How Do Our Bull Measure Up –Reviewed the Angus Sold in 2000- 2002 at Platteville WBIA Bull Sales Fourteen(14 Bulls) had progeny data with accuracies above.75 for birth and weaning weight Used in Registered herds where AI sires were available for comparison EPD’s from Sale Catalog compared to Current EPD values(Spring 2004 Angus Sire Summary
 had progeny data with accuracies above.75 for birth and weaning weight Used in Registered herds where AI sires were available for comparison EPD’s from Sale Catalog compared to Current EPD values(Spring 2004 Angus Sire Summary")
51
It’s All Bull-----Platteville Catalog EPD values of 14 bulls Sale catalog BW WW YR Milk 3.2 40 74 20 Current Value 3.0 40 74 19

52
It’s All Bull-----Platteville No Difference in the group average As Individuals most changed two lbs or less in growth traits More change in Milk EPD up to 14 lbs –Why—Bulls sires had no daughter history when used and when proven the values reflect it –These bulls have no daughter data in summary, they are their parent averages

53
Top Use Bull in 2002

54
Top Use Bull in 2001

55
It’s All Bull Summary –Bulls play large role in herd genetics –Many tools are now available to decide –Producers must decide what traits are important to them, visual & $$$ –Indexes will play a role in the future as we have more traits to evaluate and use to sort bulls

56
It’s All Bull Thanks for your attendance Have a safe trip home

Similar presentations


 Agricultural Research Council, Private Bag X2, Irene 0062 University.>")


 succeed through enabling the success (profit) of their commercial.>")


