Download presentation
Presentation is loading. Please wait.

1
Does 3D Really Make Sense for Visual Cluster Analysis? Yes! Bing Wang and Klaus Mueller Visual Analytics and Imaging Lab Computer Science Department Stony Brook University and SUNY Korea

5
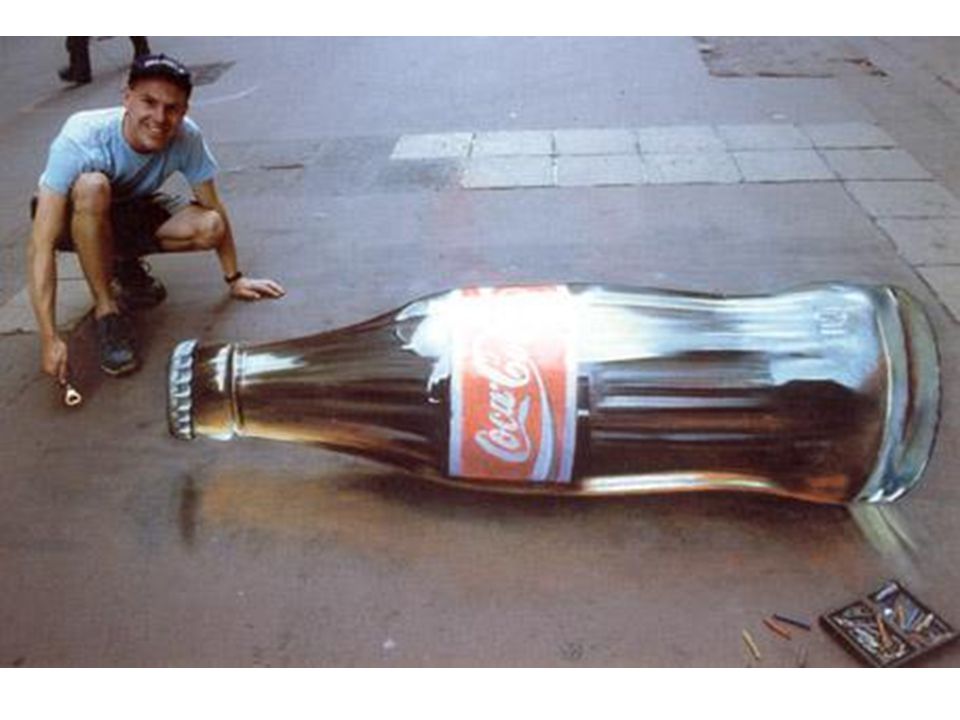
but they’re just illusions….

6
still just illusions….

7
Why Do These Work So Well? Because they appeal to learned depth cues: shading occlusion shadows perspective depth of field And they are also illusions of known 3D objects learned in childhood often in conjunction with touching no need for stereo motion parallax is just as good

8
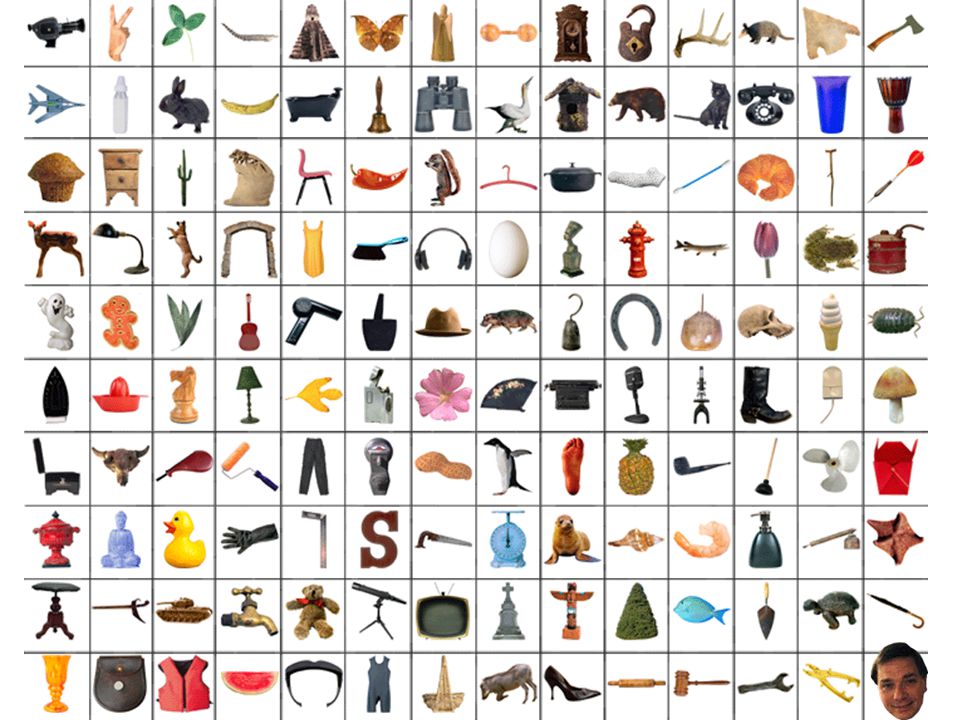
Indexing the Brain Next time a similar object is seen the 3D shape is retrieved Already recognized by H. von Helmholtz in the 19 th century see also G. Hatfield “Perception as Unconscious Inference”

10
What’s Cluster Analysis Goal tries to find shapes and trends in ND point clouds a common tool is the Scatterplot matrix

11
Scatterplot Matrices Don’t Scale Can’t see multivariate relationships especially not when D is high

12
What Can 3D Do for Cluster Analysis Cluster analysis research and practice is reluctant to use 3D but why not take advantage of this collection of learnt 3D shapes A common argument is what will you do when the data is 4D, 5D, …, ND? so we tested how many datasets are truly way beyond 3D here we looked at each cluster separately, as a low-D subspace

13
Workflow Unclustered data Clustered data DBSCAN Eigenvalues Principal Components PCA Intrinsic Dimensionality Elbow Subspace Similarity Cosine

14
What’s DBSCAN Can find arbitrary shaped clusters based on density DBSCAN = Density-Based Spatial Clustering of Applications with Noise recruits points to a cluster based on reachability two parameters -neighborhood radius ε -the minimum number of points minPtn a cluster needs to have -difficult to find good settings

15
DBSCAN – Example

16
Visual Interface for DBSCAN Parameters Distance histogram shows all pairwise distances helps to choose Neighborhood heat map shows for each point the number of points within a certain helps to choose minPtn number of neighbors 0 20

17
Intrinsic Dimensionality We used the elbow method on the scree plot but typically there are long tails due to noise might be better to use the percentage, say 5% (0.05) ordered normalized Eigenvalue % PCA Eigenvalue
 ordered normalized Eigenvalue % PCA Eigenvalue")
18
Cosine Similarity We computed the cosine similarity of the PCA vectors did this for every ordered pair of PCA vectors and subspace determines the similarity of the subspaces helps to plan transitioning in the visualization

19
Results We studied a (so far) small set of public domain datasets from the UCI machine learning repository Boston Housing (n=506, d=14) Image Segmentation (n=1,200, d=18) We also studied datasets from our own collection atmospheric dataset ISDAC (n=221, d=33)
 small set of public domain datasets from the UCI machine learning repository Boston Housing (n=506, d=14) Image Segmentation (n=1,200, d=18) We also studied datasets from our own collection atmospheric dataset ISDAC (n=221, d=33)")
20
Boston Housing Analysis there are 3 representative clusters according to screeplot 3D seems to be OK subspace 3 quite different from subspace 1 and 2 which are similar

21
Image Segmentation Analysis elbow at d=3 and 5% mark is at d=4 or 5 for all clusters d=3 has 15% or lower PCA similarity analysis showed that all but one subspace pair were quite different

22
ISDAC Analysis 3D with perhaps some transitioning seems to be OK PCA similarity analysis indicated that subspaces are different

23
Visualization System Overview 2D scatterplot shaded 3D display SPLOM

24
Our System 3D exploration interface with subspace hopping capability trackball interface for continuous rotation in 3D space interactions to fluidly transition from one 3D subspace to another local subspace explore (LSE) global subspace explorer (GSE)
 global subspace explorer (GSE)")
25
Interactions Mouse buttons control subspace navigation left mouse press rotates the trackball within the 3D subspace right mouse press tilts the trackball into a new subspace middle press changes the z-axis and goes “deeper” into ND space Cluster chasing

26
Subspace Trail Map Gives an overview about subspaces visited layout with generalized barycentric coordinates user can click anywhere to visit the corresponding subspace

27
Switch to 3D Views

28
Demo Video play video

29
Future Work Study more datasets Refine 3D shape display expand current convex hull to concave topologies use volume rendering and iso-surface visualization techniques better visualization of appearances (skew, density fields,…) better way to visualize outliers capabilities to intersect solids multi-resolution, hierarchical representations
 better way to visualize outliers capabilities to intersect solids multi-resolution, hierarchical representations")
30
Questions? Funding provided by: NSF grants 1050477, 0959979, and 1117132 US Department of Energy (DOE) Office of Basic Energy Sciences, Division of Chemical Sciences, Geosciences, and Biosciences The IT Consilience Creative Project through the Ministry of Knowledge Economy, Republic of Korea
 Office of Basic Energy Sciences, Division of Chemical Sciences, Geosciences, and Biosciences The IT Consilience Creative Project through the Ministry of Knowledge Economy, Republic of Korea.")
Similar presentations


 Scalable WIM by Li, Fu and Hanson Yinggang Li *, Chi-Wing Fu +, Andrew Hanson * Department of Computer Science * Indiana University + Hong Kong University.>")


>")


