Download presentation
Presentation is loading. Please wait.

1
Using Technology in Science Teaching Dr. Colleen Sexton 6 th International Educational Technology Conference 19-21 April 2006 How Technology Can Help with Analysis and Synthesis of Data

2
What is Data? Another name for facts, information, numbers, records, statistics or figures. Information we encounter on a daily basis. Its interpretation and display is what gives it meaning.

3
What is Data Analysis? A logical way of making meaning out of that information, fact, or figure. It requires knowing which questions to ask about the data. It requires understanding the context upon which the data was collected.

4
What happens when the right questions aren’t asked? In January of 1986 the Space Shuttle Challenger was launched from the Kennedy Space Center in central Florida, USA. The night before the launch there was a three-hour teleconference between the NASA (National Aeronautics and Space Administration) managers and Morton-Thiokol Engineers, the company that manufactured the solid rocket motors.
 managers and Morton-Thiokol Engineers, the company that manufactured the solid rocket motors..")
5
What happens when the right questions aren’t asked? (cont.) The main topic of discussion was on the solid rocket boosters and the performance of the O-Ring seals at the predicted air temperate of 31 o F (-14.7 o C) at launch time. The O-rings seal the joints between different sections of the solid rocket motors. Basically, each O-ring is like a large rubber washer about 35 feet in diameter and ¼ inch thick.
 The main topic of discussion was on the solid rocket boosters and the performance of the O-Ring seals at the predicted air temperate of 31 o F (-14.7 o C) at launch time. The O-rings seal the joints between different sections of the solid rocket motors. Basically, each O-ring is like a large rubber washer about 35 feet in diameter and ¼ inch thick..")
6
What happens when the right questions aren’t asked? (cont.) After a launch the rocket motors land in the ocean and are recovered. They can be examined to determine if any damage occurred to the O-Rings during launch. Prior to the Challenger launch there were 23 other flights where data on the O-Rings was recorded.
 After a launch the rocket motors land in the ocean and are recovered. They can be examined to determine if any damage occurred to the O-Rings during launch. Prior to the Challenger launch there were 23 other flights where data on the O-Rings was recorded..")
7
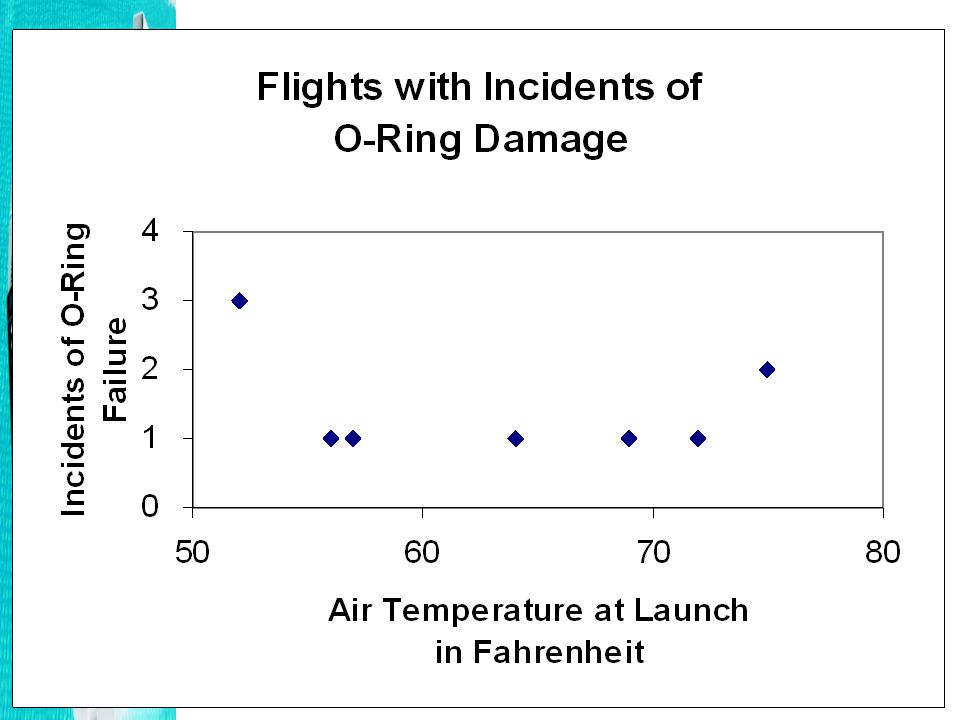
What happens when the right questions aren’t asked? (cont.) On the night before the launch the engineers and project managers met to look at the previously recorded data. The information the engineers from Morton Thiokol shared with the NASA project managers looked like this:
 On the night before the launch the engineers and project managers met to look at the previously recorded data. The information the engineers from Morton Thiokol shared with the NASA project managers looked like this:.")
8
What happens when the right questions aren’t asked? (cont.)
")
12
Management engaged in deep discussions with the engineers; according to the Rogers Commission Report on this space shuttle tragedy, at one point during the meeting one engineer was asked to put aside his “engineer hat” to look at the data as a manager to help make the decision on whether or not to launch in the morning. The decision was made to launch despite the 31 o F air temperature on the morning of the launch. What if they had looked at their data differently?

15
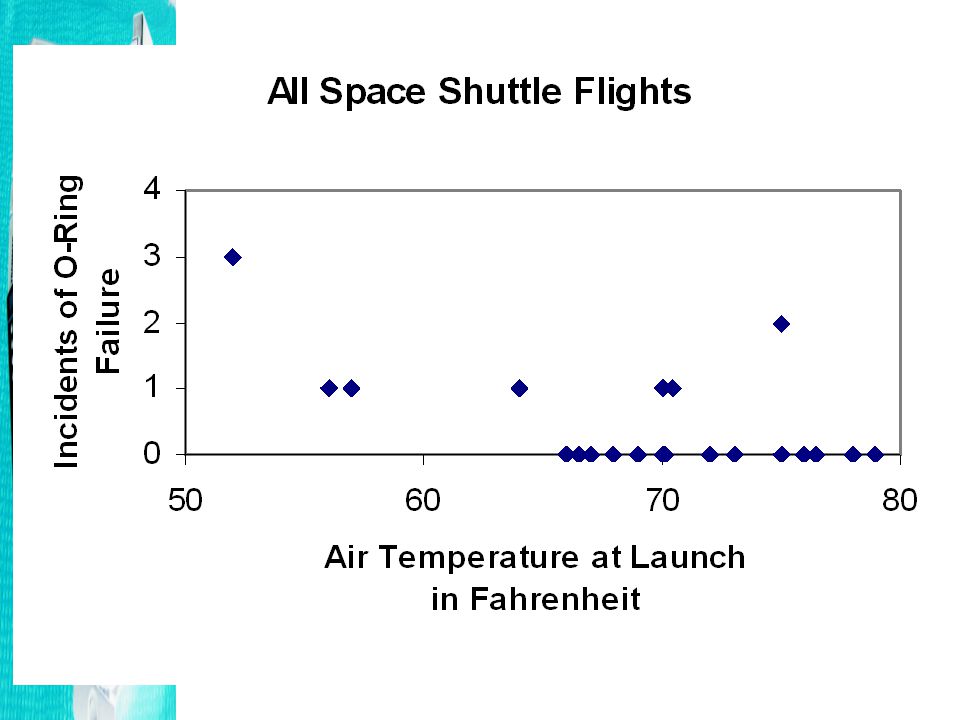
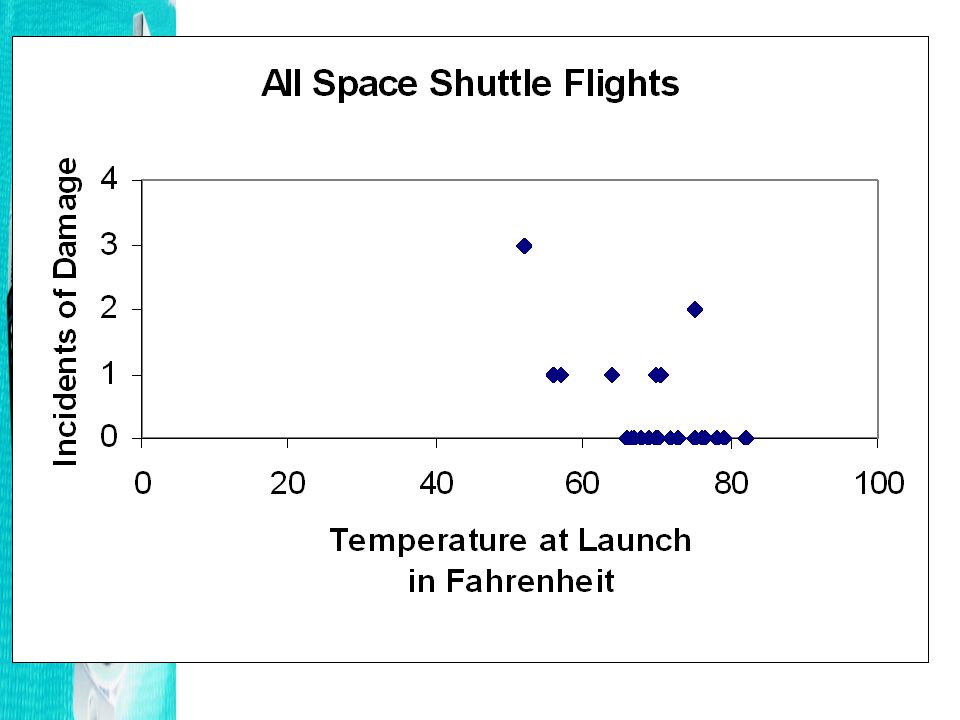
What question did management fail to ask the engineers? Where is the data from ALL of the space shuttle flights? Would you have made the decision to launch with a 31 o F air temperature if you had looked at the data displayed like this?

17
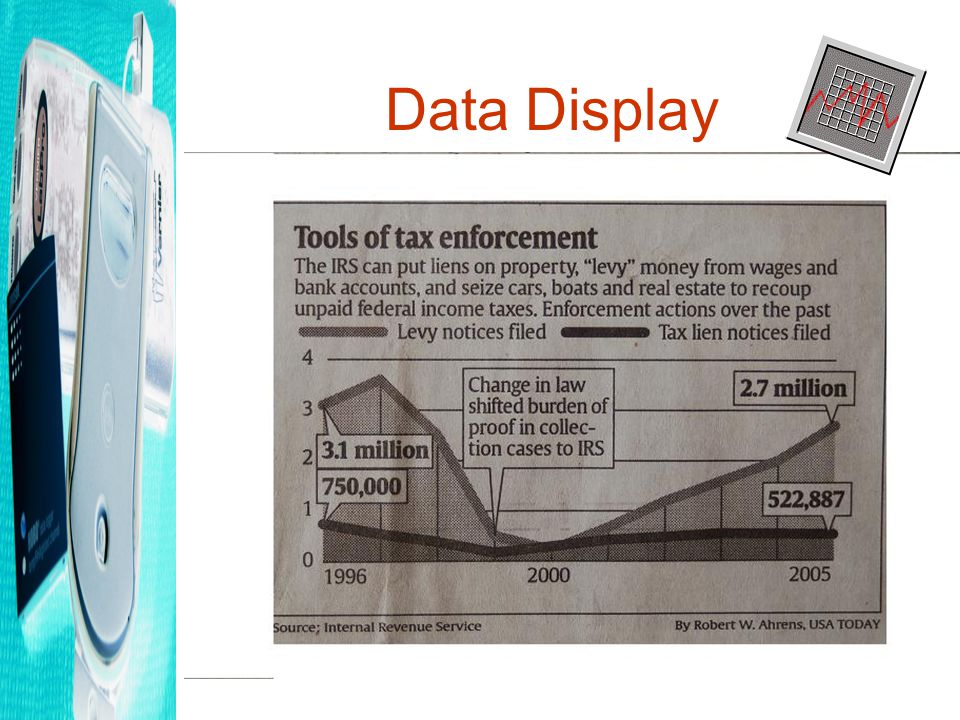
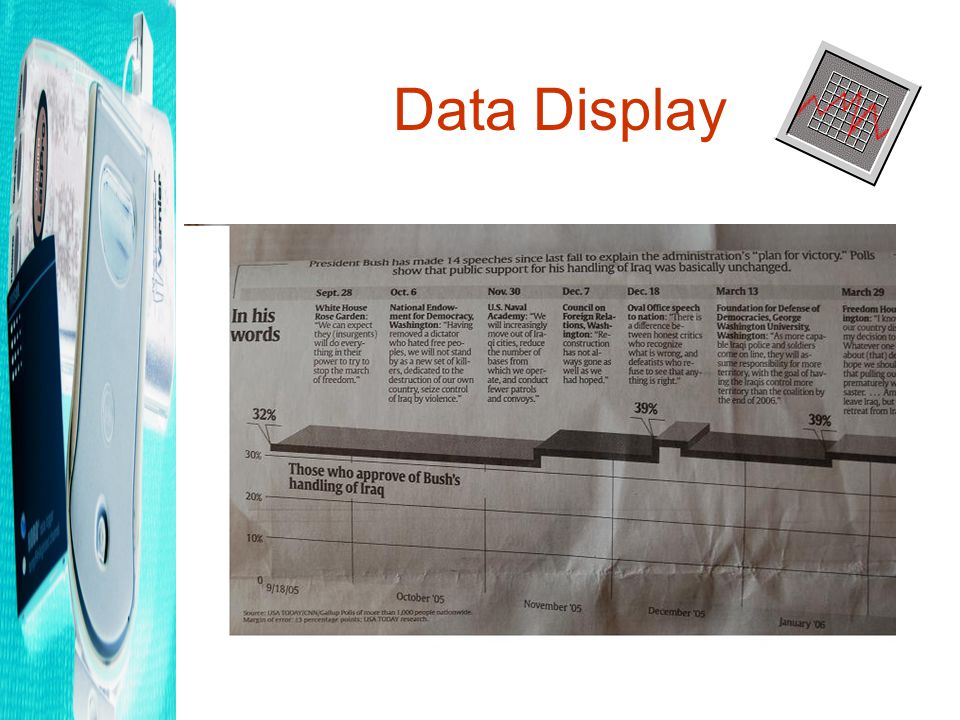
Display of Analyzed Data A good display of graphical data will help the reader see patterns, trends, or other configurations which could be hidden in another form of display. Here are some examples of good display found in the daily newspaper.

18
Data Display

22
Display of Analyzed Data Our citizens encounter data displayed in both good and bad forms quite often. Whether in print or television advertisers have become masters at manipulating data to make their side look good or right. Many are quick to make judgments based on a simple statement which used data, without questioning where the data came from, how it was collected, and how it was analyzed. Our students of today may become the NASA managers of tomorrow.

23
What does this mean for Science Teaching? Science should be taught so that students learn to value the essential attitudes of science: –Longing to know and understand –Questioning of all things –Searching for data and their meaning –Demanding verification –Respecting logic –Showing consideration for premises and consequences

24
What does this mean for Science Teaching? We must change from a science curriculum where the information is presented part to whole with emphasis on basic skills; and Where the curriculum is fixed, relying heavily on textbooks, workbooks, and solely verification lab books.

25
What does this mean for Science Teaching? To a curriculum presented whole to part; with an emphasis on big concepts and thinking skills. It must be responsive to student questions and interest; and Rely heavily on primary sources of data and manipulative materials.

26
What does this mean for Science Teaching? Students must be given opportunities to: –collect data, –ask what it means, –and ask how to display the data to make connections, to look for trends, and to draw conclusions

27
Why? National and International Assessments use more than pure knowledge questions; Many require skills in analysis and synthesis of data; making sense of data tables and data graphs. Scores on the TIMMS assessment show that lack of experiences in analyzing and synthesizing scientific data is a global issue.

28
TIMMS results – Earth Science Earth in the Universe Japan76.6% Diversity of Structures Japan63.6% Earth Processes Hong Kong70% Earth Features Hungary69.1%

29
TIMMS results- Life Science Life Processes and Function Latvia81.8% Life Cycles & Genetics Czech Republic 76.3% Interactions of Living Things Singapore69.5% Human Biology and Health Chinese Taipei 80.2%

30
TIMMS results – Physical Science Properties and Classification of Matter Korea62.5% Structure of Matter Slovak Republic 71.1% Energy and Physical Processes Singapore67% Physical Changes Chinese Taipei 76.7%

31
Analysis of Statewide Science Testing Out of 50 states only 26 have a graduation qualifying exam; and 23/26 require passage to graduate. 1 in 5 require science testing at grade 4; 1 in 4 require science testing at grade 7 or 8. 30% use the National Assessment of Educational Progress – given at grades 4, 8, and 12 to determine student’s science knowledge. Only given once every four years. Participation is strictly voluntary.

32
Tasks required of students on the Illinois state achievement test ISAT Gr. 4

33
Tasks required of students on state tests (cont.) ISAT GR. 4
 ISAT GR. 4")
34
Tasks required of students on state tests (cont.) ISAT GR. 4
 ISAT GR. 4")
35
Tasks required of students on state tests (cont.) ISAT GR. 4
 ISAT GR. 4")
36
Tasks required of students on state tests (cont.) ISAT GR. 7
 ISAT GR. 7")
37
Tasks required of students on state tests (cont.) ISAT GR. 7
 ISAT GR. 7")
38
Tasks required of students on state tests (cont.) ISAT GR. 7
 ISAT GR. 7")
39
Tasks required of students on state tests (cont.) ISAT GR. 7
 ISAT GR. 7")
40
So how can technology help? Tools to collect data – real world applications for data collection and analysis Vernier LabPro Interface –Computer –Handheld Device (Palm ® or Graphing Calculators (TI ® ) ImagiWorks ImagiProbe Interface –Handheld Device (Palm ® ) HOBO ® Data Logger –Free of computer and/or handheld
 ImagiWorks ImagiProbe Interface –Handheld Device (Palm ® ) HOBO ® Data Logger –Free of computer and/or handheld.")
41
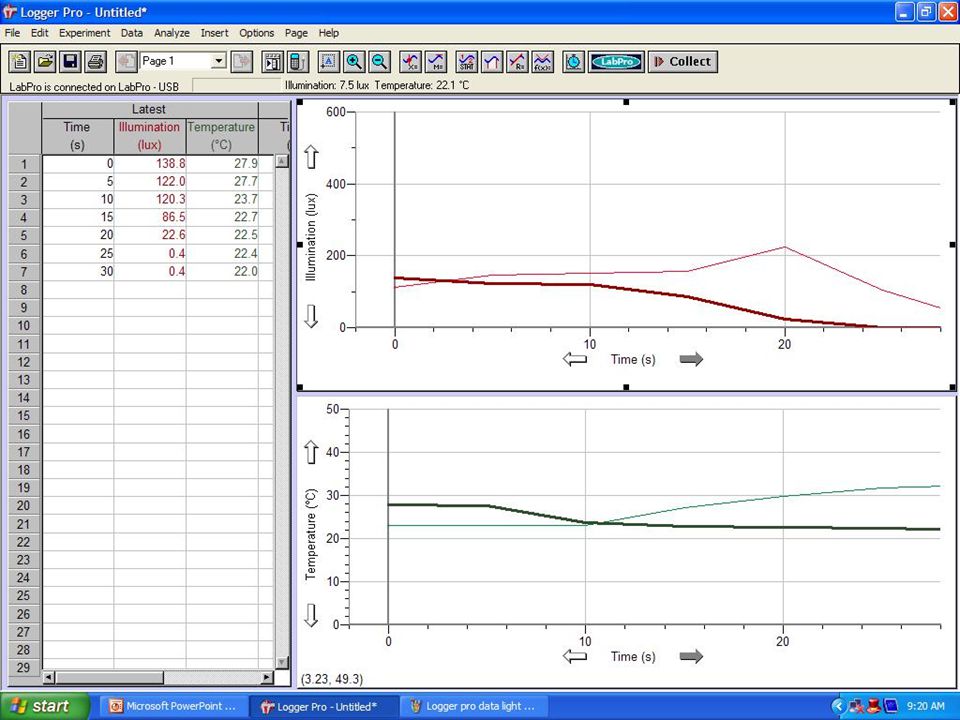
The Vernier LabPro Connects to the computer to collect and analyze data using a variety of probes and LoggerPro software. Over 50 sensors available such as: ThermometerLight Sensor pH SensorCurrent Relative HumidityUVA VoltageEKG Sensor Salinity SensorGas Pressure Sensor

42
The Vernier LabPro Can also connect to a Palm® through a specialized adapter using the LabPro or with a graphing calculator (TI- 84® using the LabPro or the Vernier EasyLink®. The data is analyzed and graphically displayed on the handheld using LoggerPro software. Data can also be downloaded directly onto the computer for analysis.

43
The Vernier LabPro Launch the LabPro to collect data. Collects data in a data table and simultaneously provides a Graphical Display via the LoggerPro software. Can connect up to four probes Can collect digital images using a web camera and those digital images can be synchronized with the data collection.

47
The Vernier LabPro Using the Palm® to connect to the interface, can launch up to four probes at once. Limited by size of Palm® screen; therefore can only see the Graphical Display or the Data Table at one time. Ball Toss

48
The Vernier LabPro Can analyze data on the Palm® using Data Pro software, or you can transfer data to the computer for similar analysis as when the LabPro is launched directly from the computer. Palm® connection allows for portability. Ball Toss

49
The Vernier LabPro TI® (graphing calculator) connection display similar to Palm® display. Can analyze data on calculator or download onto computer and use the LoggerPro software for analysis. Ball Toss

50
The Vernier LabPro Vernier provides lab manuals for: chemistry, physics, physical science, biology, human physiology, and water quality. Developed by practicing teachers or content area experts in conjunction with classroom teachers.

51
The Vernier LabPro Innovative uses Edberg from Jet Propulsion Laboratory in Pasadena, CA developed labs to study space science. One is a simulation using the Magnetic Field Sensor for students to investigate magnetic interiors of planets. View this at: http://www.vernier.com/physics/vernier_planetmagfield.pdf

52
The Vernier LabPro Innovative uses Vernier developers looked at the question of force associated with juggling balls based on a question by a high school physics teacher. How forces change over time and with increase in number of balls juggled can be analyzed. A movie of this with sample data is found at: http://www.vernier.com/innovate/juggle.zip

53
The Vernier LabPro Innovative uses Science teacher from Kansas took students to Texas to explore Laguna Madre, a large body of shallow water that separates Padre Island in the Gulf or Mexico from the mainland of Texas. Students used Salinity Sensor with the LabPro and a PC using LoggerPro software to collect and analyze data on the lake. Also used a GPS unit to collect latitude and longitude for each collection site. This data was entered into LoggerPro software also. View this at: http://www.vernier.com/innovate

54
The Vernier LabPro Advantages Complete lessons Multiple probes Data Collection of up to four probes simultaneously Synchronize data collection with digital video. Grades 6 through college. Launch with computer, Palm, or Graphing Calculator. Detailed analysis of data. Disadvantages Size of LabPro Professional Development needed - Teachers need to understand power of statistical analysis provided by LoggerPro software Time needed to teach students various ways to analyze data. Can not leave unattended for long time frame.

55
The ImagiWorks ImagiProbe Software loaded onto the Palm ® handheld. The ImagiWorks Interface connects to the Palm ® m130 with a direct connection using Vernier probes.

56
The ImagiWorks ImagiProbe Newer interface allows for infrared (wireless) connection to Palm® Zire in conjunction with Pasco probes.
 connection to Palm® Zire in conjunction with Pasco probes.")
57
The ImagiWorks ImagiProbe Allows up to 2 probes per interface with Palm m130. Uses Vernier® probes ImagiWorks software allows user to choose sampling amount and duration. On the Palm® it will provide line graph view or chart view of data collected. Hot sync to computer, will only load data set. Transfer to Excel for manipulations of data. View Data Setup Trials Notes

58
The ImagiWorks Interface

59
The ImagiWorks ImagiProbe Allows multiple probes with wireless interface. Uses Pasco® probes, more than 25. ImagiWorks software for students to collect data; graph data as it’s collected, annotate it, analyze it to discover relationships, and transfer the data to a desktop computer for more detailed analysis once data is transferred to statistical software. View Data Setup Trials Notes

60
The ImagiWorks ImagiProbe Provide CD with lab activities for: physical science and water quality. Used mainly by middle grade level teachers for better understanding of physical science concepts (Grades 5-8).
..")
61
The ImagiProbe Innovative uses Forest Ecology Driving Question: What is the relationship between light intensity, vegetation, and soil types in a forest? Used by Forest Ecology teacher for lessons on soil analysis, optimal soils for tree seedlings, photosynthesis, light intensity, and tree identification. All lessons developed and presented to high school students by pre-service secondary science teachers.

62
The ImagiProbe Innovative uses Evaporation of Alcohols Driving Question: Do all alcohols have the same intermolecular attraction? 2 Temperature probes were used for students to compare rate of evaporation of ethanol and methanol. The resultant graph lead to a discussion about rate of evaporation of different alcohols. The methanol evaporated more rapidly - means intermolecular attraction of ethanol not as large as methanol.

63
The ImagiWorks ImagiProbe Advantages Uses Palm® connected to small interface. Very portable, complete with carrying case for outdoor labs. Provides sample lessons for Physical Science and Water Quality. Data Collection with two probes simultaneously via Vernier probes, up to 25 with wireless Palm via Pasco probes. Easy to use and teach, especially with students in grades 4-8. Digital camera attaches easily to Palm m130 or comes with Zire to collect descriptive information on data collected. Disadvantages imagiCalc software must load separately to do statistical manipulations. Limited to Temperature, pH, Dissolved Oxygen, Light, and Voltage probes from Vernier. Data only viewed as a line graph unless transferred to Excel spreadsheet. Separate views of data table or line graph on the Palm® screen. Can not leave unattended for long.

64
The HOBO Data Logger A HOBO data logger is a small (matchbox size), battery-operated measuring device that can be put anywhere. HOBO's include a microprocessor, data storage, and a sensor. Can measure temperature (Fahrenheit and Celsius), relative humidity, light intensity, external temperature and voltage sensor.
, relative humidity, light intensity, external temperature and voltage sensor..")
65
The HOBO Data Logger The HOBO data logger is attached by a serial cable to a personal computer. HOBO software is used to launch the data logger. At this point you can choose when you want the logger to start and how often you want it to take what type of reading. The HOBO data logger can then be disconnected from the computer and put anywhere. Return the HOBO data logger to the PC and, using the software, readout the collected data in graph or table form.

67
The HOBO Data Logger Innovative uses Student activity book for grades K-6; plays on the theme of a “Hobo” after the people that used to ride trains across the country in the 1920’s and 1930’s. Felt these are like Hobo’s in that they can be moved around collecting data and sharing information. Designed to help young learners construct an understanding of the concepts of temperature, light intensity, and relative humidity through simple data collections based around a HOBO storyline.

68
HOBO iScience Projects http://www.iscienceproject.com http://www.iscienceproject.com

69
HOBO iScience Projects http://www.iscienceproject.com http://www.iscienceproject.com

70
The HOBO Data Logger Advantages Size – little bigger than a matchbox, extremely portable and can purchase outdoor and underwater loggers. Launch with computer, then disconnect; duration over 600 days. Complete lessons for K-6 students; web based lessons for upper grades; teachers can provide lessons to be included on iScience website. Data Collection of up to four parameters simultaneously; 3 of which are internal, one external probe Data displayed in graph and data table simultaneously. Can also export data for more detailed analysis to Excel. Cost Disadvantages Limited to temperature, light intensity, relative humidity, and voltage studies Export data to other software for more advanced statistical analysis.

71
Conclusions Students are bombarded with data on a daily basis. The ability to ask critical questions on data collection and analysis are necessary skills to become critical consumers of information. Students need more experience in the science processes of data collection, analysis, and synthesis. Technology can assist in teaching these processes. Vernier, iMagiWorks, and HOBO are data collection devices which can help students collect and analyze data, to learn to think critically about the data, and to make sound decisions based on the analysis of that data.

72
Disclaimer The ideas offered on the Advantages and Disadvantages of the data collection devices provided by different manufacturers are purely the opinion of this researcher. They are based on my current experiences in using the devices. Other users of these devices may agree or disagree with my experiences.

73
References The New Dimensions of Science Adventures of the American Mind website was designed to model the use of primary sources in the classroom. Look in the science dimension The History and Nature of Science to find the slides from this presentation. URL: http://aam.govst.edu/sextonhttp://aam.govst.edu/sexton

74
References The Rogers Commission Report is an example of using a primary source to collect information and draw conclusions. All information concerning the Challenger Shuttle came from this site. URL: http://history.nasa.govhttp://history.nasa.gov

75
References The USA Today Data Tables This US daily newspaper broke new grounds when it first came out because of its extensive use of data tables. Excellent examples of how to display data. USA Today – Interactive media website URL: http://www.usatoday.com/news/intera ctive-media.htm http://www.usatoday.com/news/intera ctive-media.htm

76
References Sample test items for science can be found at each state department of education’s website. The sample test items found in this presentation came from the Illinois State Board of Education website. URL: http://www.isbe.state.il.us/asses sment/htmls/sample_books.htm http://www.isbe.state.il.us/asses sment/htmls/sample_books.htm

77
References Teaching Science for ALL Children – An Inquiry Approach is an elementary science methods textbook co-authored by myself, Dr. Teresa Franklin and Dr. Ralph Martin at Ohio University (Allyn & Bacon, 2005; 4 th ed.) In the book detailed information is provided on science process skills, national and international science assessments, and constructivist science teaching principles. URL of companion website: http://www.ablongman.com/martin4e http://www.ablongman.com/martin4e
 In the book detailed information is provided on science process skills, national and international science assessments, and constructivist science teaching principles. URL of companion website:")
78
References Vernier LabPro - http://www.vernier.com http://www.vernier.com imagiWorks imagiProbe - http://www.imagiworks.com http://www.imagiworks.com HOBO Data Logger - http://www.iScienceProject.com http://www.iScienceProject.com

79
Contact Information Dr. Colleen Sexton Science Education Governors State University University Park (Chicago Suburb), Illinois – USA c-sexton@govst.edu
, Illinois – USA")
Similar presentations


. ThemesCore Lower Block * (P3-P4) Core Upper Block ** (P5-P6) Diversity Diversity of living and non-living.>")


