Download presentation
Presentation is loading. Please wait.

1
State of the State APIC Meeting January 25, 2013

2
Agenda 1:35 – 1:45 pm Introduction and MEDSIS – Shoana/Sara
1:45 – 1:55 pm Vaccine Preventable Disease – Karman Tam 1:55 – 2:05 pm Cocci –Clarisse Tsang 2:05 – 2:15 pm Flu – Shane Brady 2:15 – 2:25 pm HAI – Jason Lempp/Vinita Oberoi 2:25 – 2:40 pm Vector/RMSF – Selam Tecle and Erica Weis 2:40 – 2:50 pm Foodborne – Evan Henke 2:50 – 3:05 pm STD – Roxanne Ereth 3:05 – 3:20 pm HIV – Rick DeStephens 3:20 – 3:35 pm TB – Eric Hawkins 3:35 – 4:00 pm Questions

3
New Year, New MEDSIS Please remember to sign your new user agreement
For questions or MEDSIS access, please contact:

4
Meaningful Use Public Health Objectives
Electronic Laboratory Reporting – currently accepting Immunization Registry – currently accepting Syndromic Surveillance – will be contacting hospitals shortly

5
Vaccine Preventable Diseases APIC State of the State January 25, 2013
Karman Tam, MPH Office of Infectious Disease Services Arizona Department of Health Services

6
*confirmed and probable cases

7
Pertussis in Arizona 2012 (preliminary) 2011 962 cases 507 confirmed
455 probable 867 cases 160 confirmed 707 probable

8
*confirmed and probable cases

9
Pertussis Testing

11
Mohave County Pertussis Outbreak
92 cases (72 confirmed, 20 probable) to date ~80% unvaccinated Most cases in those <5 years old
 to date. ~80% unvaccinated. Most cases in those <5 years old.")
12
Calling All Health Care Workers! Get Vaccinated Against Pertussis!
Only 20% of HCW’s in the U.S. have received the adult vaccine for pertussis (Tdap) Only ONE dose of Tdap is needed! Protect yourself Protect your patients and their families Protect infants under <1 year old According to the CDC, Tdap vaccination in adults: Reduces incidence of pertussis in infants Reduces complications in high-risk individuals
 Only ONE dose of Tdap is needed! Protect yourself. Protect your patients and their families. Protect infants under <1 year old. According to the CDC, Tdap vaccination in adults: Reduces incidence of pertussis in infants. Reduces complications in high-risk individuals.")
13
Arizona Partners Against Pertussis (APAP)
Goal: Achieve 100% pertussis vaccination rate by April 1, 2013 Prize: Certificate of Participation, recognition on the website, and prizes/money

14
H. flu type B (Hib) in children <5 years
2012 2011 2 confirmed cases - 3 year old: fully immunized - 4 month old: not vaccinated 1 confirmed case

15
Meningococcal Invasive Disease
2012 2011 5 confirmed cases 3 serogroup C 1 serogroup Y 1 serogroup W135 16 confirmed cases

16
Measles 2012 2011 2 confirmed cases (siblings) 7 year old:
PCR positive, not vaccinated 5 year old: IgM positive, not vaccinated 2 confirmed cases rash, fever, cough, coryza, conjunctivitis

17
Mumps 2012 2011 3 confirmed cases (siblings) 9 year old:
IgM and PCR positive, not vaccinated 12 year old: epi-linked, not vaccinated 13 year old: 0 cases

18
Resources 2007 Guideline for Isolation Precautions: Preventing Transmission of Infectious Agents in Healthcare Settings Guideline for infection control in health care personnel, 1998

19
Arizona Vaccines For Children (VFC) Program 2012
Arizona Immunization Program Office (AIPO) Arizona Department of Health Services Patty Gast, M.S., Office Chief (602)
 Arizona Department of Health Services. Patty Gast, M.S., Office Chief (602)")
20
Vaccines Distributed in 2012
The Arizona VFC Program provided 1,596,867 vaccines ($81,119,566) to more than 850 private and public immunization providers statewide in AZ VFC vaccine is for children who are on AHCCCS, Native American or uninsured 317 vaccine is used in AZ for non-VFC eligible children, such as for insured children who present at County Health Departments
 to more than 850 private and public immunization providers statewide in AZ. VFC vaccine is for children who are on AHCCCS, Native American or uninsured. 317 vaccine is used in AZ for non-VFC eligible children, such as for insured children who present at County Health Departments.")
21
Vaccine Policy Changes in 2012
Important federal vaccine policies changes were instituted in October 1, 2012, as required by VFC: Federal vaccine may no longer be used for PRIVATELY insured children. Most county health departments are trying to develop a private stock of vaccine and insurance billing programs in order to continue serving privately insured children. County health departments are encountering significant challenges in developing these programs, and we are concerned about where these children can get immunized in the meantime.

22
Vaccine Policy Changes
Upcoming mid-year 2013 – our federal vaccine can not be used for underinsured children in private provider offices. However, a safety net for these children is being established: county health departments and 24 providers statewide are being deputized with authority from a Federally Qualified Health Center (FQHC) to use VFC vaccine on underinsured children. FQHCs and Rural Health Centers (RHCs) already have this authority. This means that starting in July 2013 (approximately) underinsured children will have to pay out of pocket at their private provider’s office or go to a county, deputized provider, FQHC or RHC to receive free vaccine. For now, in the first half of 2013, all providers should continue using our vaccine on underinsured children. As the Affordable Care Act rolls out in 2014, there will hopefully be fewer and fewer underinsured children.
 to use VFC vaccine on underinsured children. FQHCs and Rural Health Centers (RHCs) already have this authority. This means that starting in July 2013 (approximately) underinsured children will have to pay out of pocket at their private provider’s office or go to a county, deputized provider, FQHC or RHC to receive free vaccine. For now, in the first half of 2013, all providers should continue using our vaccine on underinsured children. As the Affordable Care Act rolls out in 2014, there will hopefully be fewer and fewer underinsured children.")
23
Vaccine Policy Changes
These policies have affected hospitals’ ability to participate in the Arizona VFC Program, as we previously supplied the Hepatitis B birth dose universally, but now we are not able to do so. Several hospitals have dropped out of the VFC Program, but are offering the birth dose to privately insured children at their own expense. There will always be sufficient vaccine for VFC eligible children.

24
Additional Updates New ADHS manual for preventing perinatal hepatitis B virus infections: with chapters specifically aimed at OBs, hospitals, pediatricians, and health departments. It can be found on the ADHS immunization website under AIPO Program Activities—perinatal hepatitis B prevention. March of Dimes sponsoring coalition of 17 health care organizations entitled Arizona Partners Against Pertussis (APAP): Contest to have employers get staff 100% immunized with Tdap. Deadline April 1, 2013. Details on TAPI’s website at AIPO started doing a small pilot project with a rural pharmacy to see if a pharmacy can serve as a VFC vaccine provider in Arizona. FDA has approved Varizig (varicella immune globulin) for prophylaxis in high risk individuals, and has extended use to 10 days (MMWR March 30, 2012).
: Contest to have employers get staff 100% immunized with Tdap. Deadline April 1, Details on TAPI’s website at AIPO started doing a small pilot project with a rural pharmacy to see if a pharmacy can serve as a VFC vaccine provider in Arizona. FDA has approved Varizig (varicella immune globulin) for prophylaxis in high risk individuals, and has extended use to 10 days (MMWR March 30, 2012).")
25
Additional Updates Waiting for MMWR to publish provisional recommendations from ACIP vote on: Tdap for every pregnant woman during every pregnancy Measles recommendation changes, including MMR down to 6 months old for international travel and 2 doses of MMR for > 12 months old for international travel ADHS study showed risk factors for having 1st hepatitis B vaccine >14 days versus 1st in 3 days. Babies born to mothers with private insurance were twice as likely to miss the HBV vaccine birth dose Babies born to mothers with complications during labor or delivery were more than twice as likely to miss the HBV vaccine birth dose than when the mother experienced no complications

26
Additional Updates All influenza vaccines this season are trivalent.
Looking to the future. New influenza vaccines will likely be available next season Live attenuated quadrivalent vaccines: both intranasal and injection. (H1N1, H3N2, and 2 Bs) First influenza vaccine grown with cell culture technology (dog kidney cells). No risk for egg allergic patients.
 First influenza vaccine grown with cell culture technology (dog kidney cells). No risk for egg allergic patients.")
27
Please contact Karman Tam for more information: karman.tam@azdhs.gov
Thank you! Please contact Karman Tam for more information: (602)
")
28
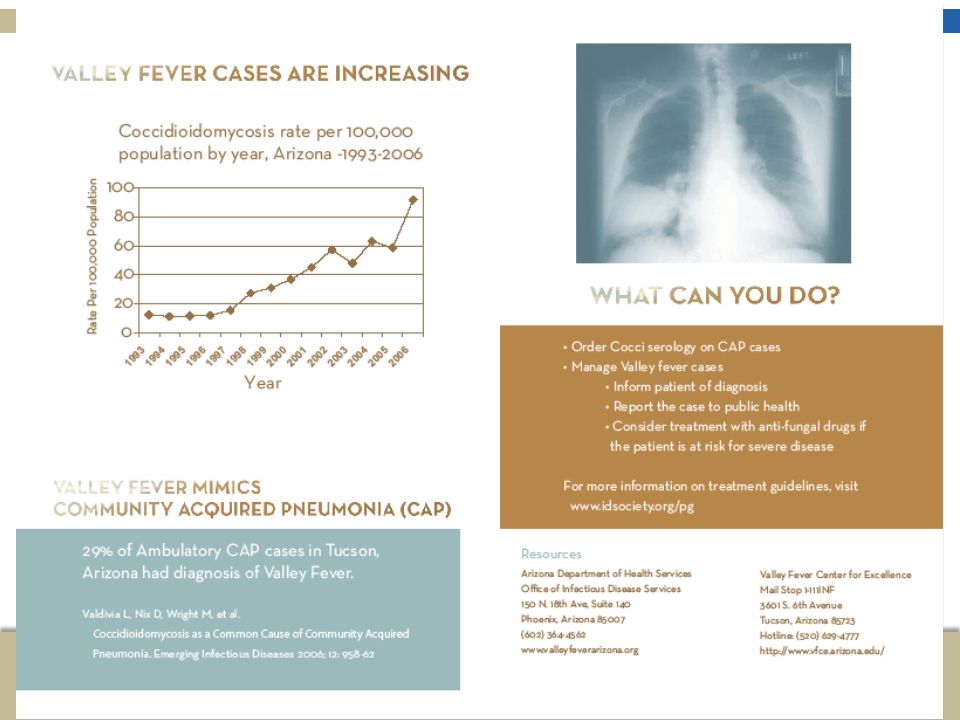
Coccidioidomycosis in Arizona
Clarisse Tsang, MPH Acting Program Manager Infectious Disease Epidemiology APIC: January 25, 2013

29
Impact of Cocci on Arizonans
60% of all reported US cases are in Arizona 2nd most commonly reported infectious disease Symptoms last for a median of 4 months In 2007, $83 million was spent on cocci for hospital visits

30
Surveillance: Cocci Case Definition
Council for State and Territorial Epidemiologists (CSTE) Updated in 2007 Clinical case definition Lab criteria* Arizona Department of Health Services (ADHS) Since 1997 No clinical symptoms required *Lab criteria for diagnosis includes either detection of IgM by immunodiffusion (ID), enzyme immunoassay (EIA), latex agglutination, or tube precipitin OR IgG by ID, EIA, or complement fixation (CF) OR cultural, histopathologic, or molecular evidence of Cocci species
 Updated in Clinical case definition. Lab criteria* Arizona Department of Health Services (ADHS) Since No clinical symptoms required. *Lab criteria for diagnosis includes either detection of IgM by immunodiffusion (ID), enzyme immunoassay (EIA), latex agglutination, or tube precipitin OR IgG by ID, EIA, or complement fixation (CF) OR cultural, histopathologic, or molecular evidence of Cocci species.")
31
Rates of Reported Cocci Cases, Arizona, 1990-2012
Change in EIA Reporting Lab Reportable

32
Reported Cocci Cases, Age and Gender
Year Age (median, mean) Gender (% female) p-value (Gender) 2007 vs X subgroup 2007 52, 51 45% n/a 2008 51, 50 48% 2009 47, 47 55% 2010 48, 47 58% 2011* (2/14-12/31) p < EIA alone 46, 46 62% other positive results 52, 50 43% p = 0.07 *2011 Numbers are provisional and have not been finalized n/a = have not analyzed yet
 Gender (% female) p-value (Gender) 2007 vs X subgroup , % n/a , % , % , % 2011* (2/14-12/31) p < EIA alone. 46, % other positive results. 52, % p = *2011 Numbers are provisional and have not been finalized. n/a = have not analyzed yet.")
33
Reported Cocci Cases by Age, 2007-2011
Reported cases per 100,000

35
Provider Education Brochures and posters about cocci testing for providers CME for the PCP: Annual Valley Fever Awareness Week in November

37
Public Education Brochures with cocci info for the public Video:
“Valley Fever: The Impact on Arizonans”

38
1.

39
Resources ADHS website: www.valleyfeverarizona.org
Valley Fever Center for Excellence:

40
Thank you! Questions? Clarisse Tsang

41
Shane Brady, MPH Influenza Epidemiologist

42
2012-2013 Season Early flu season around the country
First case confirmed on October 30th, 2012 with activity intensifying in the last few weeks Vaccine is a good match to all three circulating strains an A/California/7/2009 (H1N1)pdm09-like virus an A/Victoria/361/2011 (H3N2)-like virus a B/Wisconsin/1/2010-like virus (from the B/Yamagata lineage of viruses)
pdm09-like virus. an A/Victoria/361/2011 (H3N2)-like virus. a B/Wisconsin/1/2010-like virus (from the B/Yamagata lineage of viruses)")
43
Lab-confirmed influenza cases, 2009-2013

44
Age Groups by Flu Type

45
State Lab Data: PCR & cultures, 2012-2013

46
Percentage of Visits for Influenza-like illness at sentinel outpatient providers, 2012-2013

47
School surveillance Approx. 300 schools around the state participate in an automated surveillance program that pulls data from the school nurses’ database Analyzed weekly for influenza-like illness visits to school nurses’ office Seeing a small increase in activity now Some counties have additional school surveillance: Maricopa: Has web-based system to collect information from participating schools on student absences due to ILI, respiratory diseases, GI diseases and other reasons. Plans to expand system.

48
Pediatric Flu-Associated Mortality
One case this season: Yavapai County child 5 years old PCR confirmed influenza A (H3) and RSV Underlying conditions Not vaccinated
 and RSV. Underlying conditions. Not vaccinated.")
49
Antiviral resistance (national)
Oseltamivir: Resistant Viruses, Number (%) Zanamivir: Resistant Viruses, Number (%) Influenza A (H3N2) None (671* tested) Influenza B None (263 tested) 2009 Influenza A (H1N1) None (85* tested) None (55 tested) *Includes specimens tested in national surveillance and additional specimens tested at public health laboratories in four states (AZ, MD, NY, and PA) who share testing results with CDC. Neuraminidase inhibitors continue to show very little resistance (e.g., Tamiflu). Adamantanes are not useful as high levels of resistance persist among 2009 influenza A (H1N1) and A (H3N2) viruses.
 Zanamivir: Resistant Viruses, Number (%) Influenza A (H3N2) None (671* tested) Influenza B. None (263 tested) 2009 Influenza A (H1N1) None (85* tested) None (55 tested) *Includes specimens tested in national surveillance and additional specimens tested at public health laboratories in four states (AZ, MD, NY, and PA) who share testing results with CDC. Neuraminidase inhibitors continue to show very little resistance (e.g., Tamiflu). Adamantanes are not useful as high levels of resistance persist among 2009 influenza A (H1N1) and A (H3N2) viruses.")
50
Antiviral Treatment Clinical trials and observational data show that early antiviral treatment may do the following: shorten the duration of fever and illness symptoms reduce the risk of complications from influenza (e.g., otitis media in young children, pneumonia, respiratory failure) and death shorten the duration of hospitalization
 and death. shorten the duration of hospitalization.")
51
CDC Recommendations for Influenza Antiviral Medications for the 2012-2013 Season
Clinical benefit is greatest when antiviral treatment is administered early – ideally within 48 hours of symptom onset However, antiviral treatment might still be beneficial in patients with severe, complicated, or progressive illness and in hospitalized patients when started after 48 hours of illness onset

52
CDC Recommendations (cont’d)
Antiviral treatment is recommended as early as possible for any patient with confirmed or suspected influenza who is hospitalized; has severe, complicated, or progressive illness; or is at higher risk for influenza complications. This list includes:

53
children younger than 2 years;[ii]adults aged 65 years and older;
persons with immunosuppression, including that caused by medications or by HIV infection; women who are pregnant or postpartum (within 2 weeks after delivery); persons aged younger than 19 years who are receiving long-term aspirin therapy; American Indians/Alaska Natives; persons who are morbidly obese (i.e., body-mass index is equal to or greater than 40);
![children younger than 2 years;[ii]adults aged 65 years and older;](http://slideplayer.com/slide/3157532/11/images/53/children+younger+than+2+years%3B%5Bii%5Dadults+aged+65+years+and+older%3B.jpg "persons with immunosuppression, including that caused by medications or by HIV infection; women who are pregnant or postpartum (within 2 weeks after delivery); persons aged younger than 19 years who are receiving long-term aspirin therapy; American Indians/Alaska Natives; persons who are morbidly obese (i.e., body-mass index is equal to or greater than 40);")
54
residents of nursing homes and other chronic-care facilities.
persons with the following conditions: chronic pulmonary (including asthma) cardiovascular (except hypertension alone) renal, hepatic, hematological (including sickle cell disease), metabolic disorders (including diabetes mellitus) neurologic and neurodevelopment conditions (including disorders of the brain, spinal cord, peripheral nerve, and muscle such as cerebral palsy, epilepsy [seizure disorders], stroke, intellectual disability [mental retardation], moderate to severe developmental delay, muscular dystrophy, or spinal cord injury);
 cardiovascular (except hypertension alone) renal, hepatic, hematological (including sickle cell disease), metabolic disorders (including diabetes mellitus) neurologic and neurodevelopment conditions (including disorders of the brain, spinal cord, peripheral nerve, and muscle such as cerebral palsy, epilepsy [seizure disorders], stroke, intellectual disability [mental retardation], moderate to severe developmental delay, muscular dystrophy, or spinal cord injury);")
55
Additional Updates All influenza vaccines this season are trivalent.
Looking to the future. New influenza vaccines will likely be available next season Live attenuated quadrivalent vaccines: both intranasal and injection. (H1N1, H3N2, and 2 Bs) First influenza vaccine grown with cell culture technology (dog kidney cells). No risk for egg allergic patients.
 First influenza vaccine grown with cell culture technology (dog kidney cells). No risk for egg allergic patients.")
56
Resources ADHS Weekly Activity Reports:
CDC Website:

57
Shane Brady Shane.brady@azdhs.gov 602-364-3523
Thank you! Shane Brady

58
Healthcare Associated Infections Program: Selected 2012 Investigations
January 25th, 2013 APIC Grand Canyon “State of the State” Health Services Advisory Group Jason Matthew Lempp, MPH CDC/CSTE Applied Epidemiology Fellow Healthcare Associated Infections Epidemiologist Arizona Department of Health Services (ADHS) Office of Infectious Disease Services Jason Matthew Lempp, MPH CDC/CSTE Applied Epidemiology Fellow Outbreak Capacity Epidemiologist Office of Infectious Disease Services Arizona Department of Health Services
 Office of Infectious Disease Services. Jason Matthew Lempp, MPH. CDC/CSTE Applied Epidemiology Fellow. Outbreak Capacity Epidemiologist. Office of Infectious Disease Services. Arizona Department of Health Services.")
59
ADHS & Healthcare Associated Infection (HAI) Program
1 Facilitate State HAI Advisory Committee Provide infection prevention technical assistance Education on best practices Counties & facilities Assist outbreak and exposure investigations Monitor AZ public HAI data & reportable disease surveillance Build partnerships and capacity to prevent HAIs 2

60
Arizona HAI Advisory Committee
2008 AZ Legislature – Infection Prevention and Control Advisory Committee (IPCAC) Expanded to HAI Advisory Committee (2010) Infection preventionists, Nurses, Doctors, Pharmacists, Epidemiologists, Medical industry reps, YOU? Quarterly Meetings: March 18th, 2013 State HAI Coordinator – Vinita Oberoi – (602)
 Expanded to HAI Advisory Committee (2010) Infection preventionists, Nurses, Doctors, Pharmacists, Epidemiologists, Medical industry reps, YOU Quarterly Meetings: March 18th, State HAI Coordinator – Vinita Oberoi. – (602)")
61
Training & Education Prevention Surveillance HAIs Dialysis Antimicrobial Stewardship Long Term Care

62
HAI & Exposures Investigations
MRSA

63
2012 HAI Investigations ~80 “outbreak” investigations initiated in HCFs ~75% GI related (typically Norovirus) Primarily handled by county health depts ~10% Lice & Mite related (scabies) ~10% Vaccine Preventable or Respiratory Influenza, Pertussis – Disease Specific Epis These are some of the “Others”… HAI “exposure investigations” ≠ “outbreaks”
 Primarily handled by county health depts ~10% Lice & Mite related (scabies) ~10% Vaccine Preventable or Respiratory Influenza, Pertussis – Disease Specific Epis These are some of the Others … HAI exposure investigations ≠ outbreaks")
64
MRSA – Pain Management Clinic
Severe methicillin-resistant Staphylococcus aureus (MRSA) case led to concern of HAI by treating MD 4 MRSA cases investigated at hospital, similar onsets 3 received recent procedure at same outpatient clinic sites of infection align with pain treatment injection sites County and ADHS found infection control breaches Single-dose vial of contrast media (radiologic imaging reagent) vial associated with cases seen at clinic
 case led to concern of HAI by treating MD. 4 MRSA cases investigated at hospital, similar onsets. 3 received recent procedure at same outpatient clinic. sites of infection align with pain treatment injection sites. County and ADHS found infection control breaches. Single-dose vial of contrast media (radiologic imaging reagent) vial associated with cases seen at clinic.")
65
Infection Control Issues
Dilution of reagents: not manufacturer’s recommendations 2) “Single-dose” vials used for more than one patient Solution: Pharmaceutical Compounding – Sterile preparation by licensed pharmacy or reagent laboratory 3) Insufficient PPE (respirators) during spinal injections Saline Contrast Media Reagent
 Single-dose vials used for more than one patient. Solution: Pharmaceutical Compounding – Sterile preparation by licensed. pharmacy or reagent laboratory. 3) Insufficient PPE (respirators) during spinal injections. Saline. Contrast Media Reagent.")
66
Quick 2x2 Statistical Tests
* Patient 1 Patient 2 Patient 3 Patient 4 Patient 5 Patient 6 Patient 7 Patient 8 Patient 9 Patient 10 Patient 11 Patient 12 Patient 13 Patient 14 Patient 15 Patient 16 Patient 17 Patient 18 Patient 19 Patient 20 Patient 21 Patient 22 Patient 23 Patient 24 Patient 25 Patient 26 Patient 27 Patient 28 Quick 2x2 Statistical Tests * Morning 28 Patients seen at clinic on same DOS as 3 cases * 10 Patients received contrast media injections (*) * * “Morning” versus “Afternoon” Contrast separation * * Afternoon Culture Confirmed MRSA After-noon Contrast ( + ) ( - ) Yes 3 1 4 No 24 25 28 Culture Confirmed MRSA Any Contrast ( + ) ( - ) Yes 3 7 10 No 18 25 28 Patient 15 * Patient 21 Fisher exact: * Fisher exact: 0.073 * Patient 26 *
 * * Morning versus Afternoon Contrast separation. * * Afternoon. Culture Confirmed MRSA. After-noon. Contrast. ( + ) ( - ) Yes No Culture Confirmed MRSA. Any. Contrast. ( + ) ( - ) Yes No Patient 15. * Patient 21. Fisher exact: * Fisher exact: * Patient 26. *")
67
OUTCOMES Investigations National picture:
Single-dose vials & HAI education campaigns Medication shortage of appropriate doses/concentrations

68
Hepatitis B – Dialysis Ward
Hepatitis B virus (HBV) infected, dialysis patient out of state visitor to AZ, no medical records Admitted at hospital, received 9 sessions of dialysis Initial unknown HBV status = received testing Upon blood borne pathogen (BBP) lab results, HBV+ not communicated – no dedicated machine/HCW 13 dialysis patients used shared dialysis machine
 infected, dialysis patient. out of state visitor to AZ, no medical records. Admitted at hospital, received 9 sessions of dialysis. Initial unknown HBV status = received testing. Upon blood borne pathogen (BBP) lab results, HBV+ not communicated – no dedicated machine/HCW. 13 dialysis patients used shared dialysis machine.")
69
Infection Control Issues
Unknown BBP status should (ideally) receive lab results prior to receipt of hemodialysis Unknown hepatitis status requiring dialysis should have dedicated station, machine and HCW Increased terminal cleaning for unknown & HBV+ BBP results not communicated to nursing staff ! ?
 receive lab results prior to receipt of hemodialysis. Unknown hepatitis status requiring dialysis should have dedicated station, machine and HCW. Increased terminal cleaning for unknown & HBV+ BBP results not communicated to nursing staff. !")
70
Outcomes Collaboration ADHS Infection Control Technical Assistance Visit: Division of Licensing Services Surveyors with Office of Infectious Disease Services Epidemiologists Improved practices with facility No resultant seroconversions Epidemiology Counties Facilities Licensing

71
Hepatitis C – Multi-State Investigation
National investigation of hepatitis C virus (HCV) infected traveling HCW, alleged drug diverter 8 states affected, with 17 facilities (AZ = 2) Thousands of patients since 2005 notified Over 30 patients with linked genotypes (NH, KS)
 infected traveling HCW, alleged drug diverter. 8 states affected, with 17 facilities (AZ = 2) Thousands of patients since 2005 notified. Over 30 patients with linked genotypes (NH, KS)")
72
Infection Control Issues
Protocols/systems to monitor narcotics Automated dispensing cabinets Limited access to non-essential staff Other issues brought to light: Employee screening? Background checks? National registry for HCWs?

73
Outcomes No evidence to support that HCV transmission
Results of HCV testing of two Arizona facilities for patients with exposure to injectable narcotics and cardiac cathiterization lab or other high-risk units Facility Facility Patient Counts Tested Negative (%); Positive (%) Excluded Deceased; Prior + Contacted** Phone Confirm Letter LTF ALL Total 288 111 (38.5) 110 (38.2) 1 (0.3)* 18 (6.2) 12 (4.2) 5 (2.1) 54 (18.8) 10 (3.5) 44 (15.3) 105 (36.4) *Positive patient not same genotype as HCW – not linked to NH cluster ** 132 patients calls made by ADHS and LHD – many disconnected #’s No evidence to support that HCV transmission occurred due to traveling HCW exposure National investigation is still ongoing
; Positive (%) Excluded. Deceased; Prior + Contacted** Phone. Confirm Letter. LTF. ALL. Total (38.5) 110 (38.2) 1 (0.3)* 18 (6.2) 12 (4.2) 5 (2.1) 54 (18.8) 10 (3.5) 44 (15.3) 105 (36.4) *Positive patient not same genotype as HCW – not linked to NH cluster. ** 132 patients calls made by ADHS and LHD – many disconnected #’s. No evidence to support that HCV transmission. occurred due to traveling HCW exposure. National investigation is still ongoing.")
74
Blood Borne Pathogen Exposure & Laryngoscope Processing
LHD contacted ADHS about a outpatient clinic identified by “parent” HCF of gap in infection control Laryngoscopes are semicritical items, requiring “high-level” disinfection – this scope was reportedly cleaned with alcohol but did not routinely receive this level of cleaning. Procedural gap 2008 – 2012 +500 patients exposed

75
High Level Disinfection
High-level disinfection: complete elimination of all microorganisms in or on an instrument, except for small numbers of bacterial spores. The FDA definition: a sterilant used for a shorter contact time to achieve a 6-log10 kill of an appropriate Mycobacterium species. Cleaning followed by high-level disinfection should eliminate enough pathogens to prevent transmission of infection.

76
Why BBP Testing? Last DOS 7/12 – most bacterial infections would present by now, leaving primary BBPs – Hepatitis B, Hepatitis C, and HIV Over 200 patients have been tested to date. A small number of patients (< 1%) have been identified with HCV antibody positive results – indicating past or current HCV infection. Investigation ongoing to identify presence or absence of HCV prior to DOS
 have been identified with HCV antibody positive results – indicating past or current HCV infection. Investigation ongoing to identify presence or absence of HCV prior to DOS.")
77
HCV ~3.25% of birth cohort 1945-1965 are anti-HCV (+) = 2.74 million
~75% of which have chronic HCV infection = 2.0 million

78
Contaminated MPA x 2 National Recall: New England Compounding Center
Contaminated methylprednisolone (MPA) – None distributed or “used” in AZ Patients receiving injections in other states (n = 4) 2 “cases”; 2 “non-cases” with similar Sx Regional Recall: Nevada compounding center “Contaminated” methyprednisolone – AZ MDs contacted 0 infections; NV investigation = lab contaminant?
 – None distributed or used in AZ. Patients receiving injections in other states (n = 4) 2 cases ; 2 non-cases with similar Sx. Regional Recall: Nevada compounding center. Contaminated methyprednisolone – AZ MDs contacted. 0 infections; NV investigation = lab contaminant")
79
Thank You HAI Advisory Committee and Subcommittee Members Counties helping our prevention and education campaigns Counties and facilities who worked with us on these investigations (you know who you are!) CDC – Division of Healthcare Quality Promotion Division of Viral Hepatitis ADHS – Office of Infectious Disease Services
 CDC – Division of Healthcare Quality Promotion Division of Viral Hepatitis ADHS – Office of Infectious Disease Services")
80
Questions? Jason Matthew Lempp Jason.Lempp@AZDHS.gov (602) 364-0780
MRSA Jason Matthew Lempp (602)
")
81
2012 Arizona Vector/Zoonotic Diseases Update
Selam Tecle, MPH VBZD Epidemiologist Office of Infectious Disease Services Arizona Department of Health Services

82
2012 Brucellosis Cases 6 cases reported Demographics
5 Maricopa County, 1 Pinal County Demographics 4 female, 2 male Age range: 30 – 69 years; mean: 51 years 4 cases reported consumption of unpasteurized cheese produced out of the country One case had past exposure to livestock in Guatemala No local high risk exposures reported

83
2012 Hantavirus Cases Demographics 1 case (fatal) reported
Apache County resident Demographics Male 62 years old Reported exposure to mouse droppings at different locations all within the county Important to remind residents to take precautions when cleaning rodent infested areas

84
2012 Lyme Disease Cases 13 cases of Lyme Disease were reported in Arizona by following counties: 2 Cochise 1 Coconino 2 Maricopa 1 Mohave 1 Navajo 3 Pima 3 Yavapai All cases had travel history to one of the following endemic areas: Minnesota New York California Maine Rhode Island Massachusetts Pennsylvania Germany Canada *Lyme Disease is not endemic to Arizona. Evidence of the vector (Ixodes pacificus) has only been found in Mohave County at the top of the Hualapai Mountains.
 has only been found in Mohave County at the top of the Hualapai Mountains.")
85
2012 Q Fever Update 4 cases reported Demographics
2 Maricopa County 2 Pima County Demographics All male Age range: 32-70; median age: 34 No local high risk exposures reported

86
2012 Rabid Animals

87
2012 Rabies Update Exposure to Lab Confirmed Rabid Animals:
7 Humans 25 Domestic Animals 0 Human cases 0 Domestic animal cases

88
Rocky Mountain Spotted Fever Update
43 cases (3 deaths) reported in 2012 287 suspect cases still under investigation Statewide plan CDC best practices for prevention and spread In-service training at hospitals Ensure continuity of care for transfer cases from tribal health facilities
 reported in suspect cases still under investigation. Statewide plan. CDC best practices for prevention and spread. In-service training at hospitals. Ensure continuity of care for transfer cases from tribal health facilities.")
89
2012 West Nile Virus Update 132 human cases (7 deaths) reported in Arizona La Paz, Maricopa, Mohave, Pima, Pinal, Yuma 82 (62%) reported were neuroinvasive 5,387 cases reported nationally (243 deaths) 189 positive mosquito pools Apache, La Paz, Maricopa, Pima, Pinal, Yavapai, Yuma
 reported were neuroinvasive. 5,387 cases reported nationally (243 deaths) 189 positive mosquito pools. Apache, La Paz, Maricopa, Pima, Pinal, Yavapai, Yuma.")
90
Questions?? Contact Information: Selam Tecle, VBDZ-Epi o: (602)
")
91
Foodborne Disease Outbreaks: What We Do with Your Reports
Evan Henke, PhD, MPH Arizona Department of Health Services APIC 2013 January 25, 2013

92
Reportable Food and Waterborne Diseases
Amebiasis Hemolytic Uremic Syndrome Botulism Hepatitis A Campylobacteriosis Hepatitis E Cholera Listeriosis Cryptosporidiosis Salmonellosis Cysticercosis Taeniasis Encephalitis, parasitic Trichinosis Enterohemorrhagic E. coli Typhoid Fever Enterotoxigenic E. coli Vibrio infection Giardiasis Yersiniosis

93
Why we collect disease reports
To study trends, measure success, and identify opportunities To detect and stop outbreaks To prevent future food safety failures

94
What we do with your hard work
Healthcare Providers/Labs Or ADHS Epidemiology ADHS State Lab

95
Counties Interview Cases You See
ADHS Epidemiology County Health Dept.

96
State Lab Fingerprints the Pathogen
ADHS State Lab Pattern: JEGX PFGE Lab Salmonella Shiga-toxin producing E. coli Listeria ADHS Epidemiology

97
Clusters of Illness are Defined
Salmonella Enteriditis JEGX01.004 Summer 2010

98
Clusters of Illness are Defined
Salmonella Saintpaul JN6X Summer 2008

99
Clusters of Illness are Defined
Salmonella Poona JL6X Fall 2012

100
Clusters of Illness are Defined
Salmonella Poona JL6X

101
Epidemiology Investigates Clusters
ADHS Epidemiology Case 1: JEGX Case 2: JEGX Case 3: JEGX

102
Product Supply Chain Traceback

103
Outbreak Investigations

104
Our Challenges Goals: Capture all cases PFGE all specimens
Interview all individuals BIG Challenges: Non-culture methods Staffing Complex Food Supply Chain

105
Foodborne Disease Epidemiologist
THANK YOU! Evan Henke, PhD, MPH Foodborne Disease Epidemiologist Arizona case definitions and exclusion rules

106
Arizona Department of Health Services STD Control Program
2013 APIC State of the State January 25, 2013

107
STD Reporting Requirements
Reportable sexually transmitted diseases to local health department/ADHS (within 5 working days): Chlamydia (genital) Gonorrhea Syphilis Herpes genitalis Chancroid Updated Administrative Rules for Provider Reporting (R ) New Communicable Disease Reports
: Chlamydia (genital) Gonorrhea. Syphilis. Herpes genitalis. Chancroid. Updated Administrative Rules for Provider Reporting (R ) New Communicable Disease Reports.")
108
Program Responsibilities
Monitor, control, and prevent sexually transmitted diseases through education of those at risk. Detect asymptomatic and symptomatic infected individuals. Diagnosis and treat those who are infected. Evaluate, treat and counsel sex partners of persons who have a sexually transmitted disease.

109
Program Targets Adolescents and Young Adults Men Who have Sex With Men
Multi-Drug Resistant Gonorrhea Congenital Syphilis

110
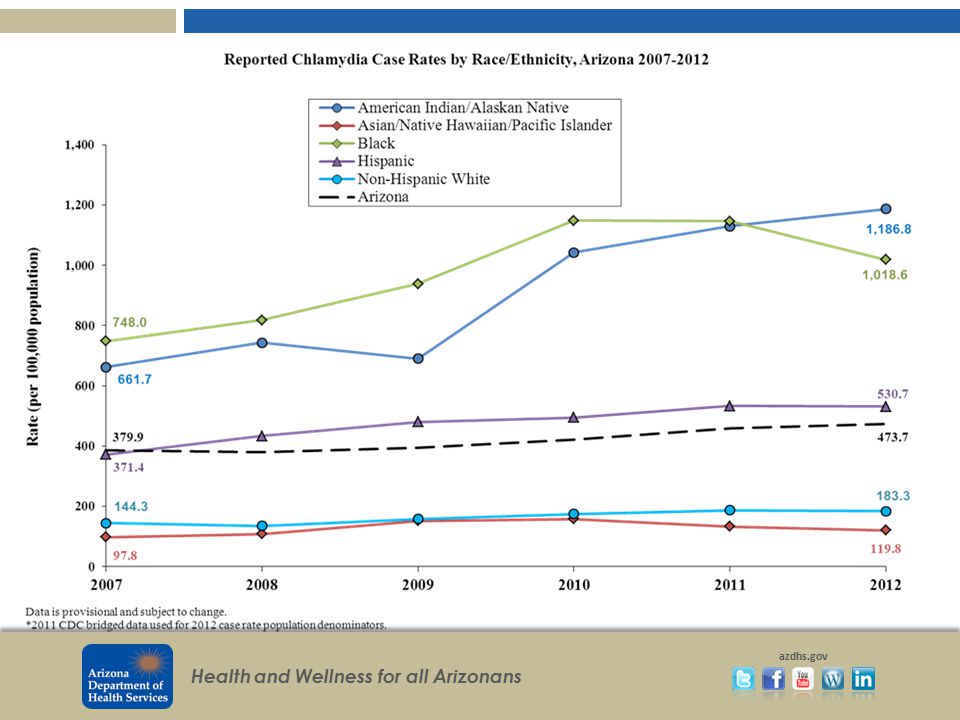
Chlamydia Anita Betancourt, Epidemiologist/IPP Coordinator/Chlamydia Surveillance

111
5% increase over 2011 14% increase over 2010 AZ rates slightly lower than 2011 national rate of 457 and ranked 18th. Maricopa ranked 8th for number of cases, nationally in 2011

114
Awareness of recommendation to screen women under 26.
Women more likely to pursue care. Infertility Prevention Project Although undiagnosed, the effective use of expedited therapy for partners will prevent additional transmission

115
CDC Recommendation CDC recommends annual screening of chlamydia for all sexually active females 25 and under and for women older than 25 with risk factors such as a new sex partner or multiple partners.

116
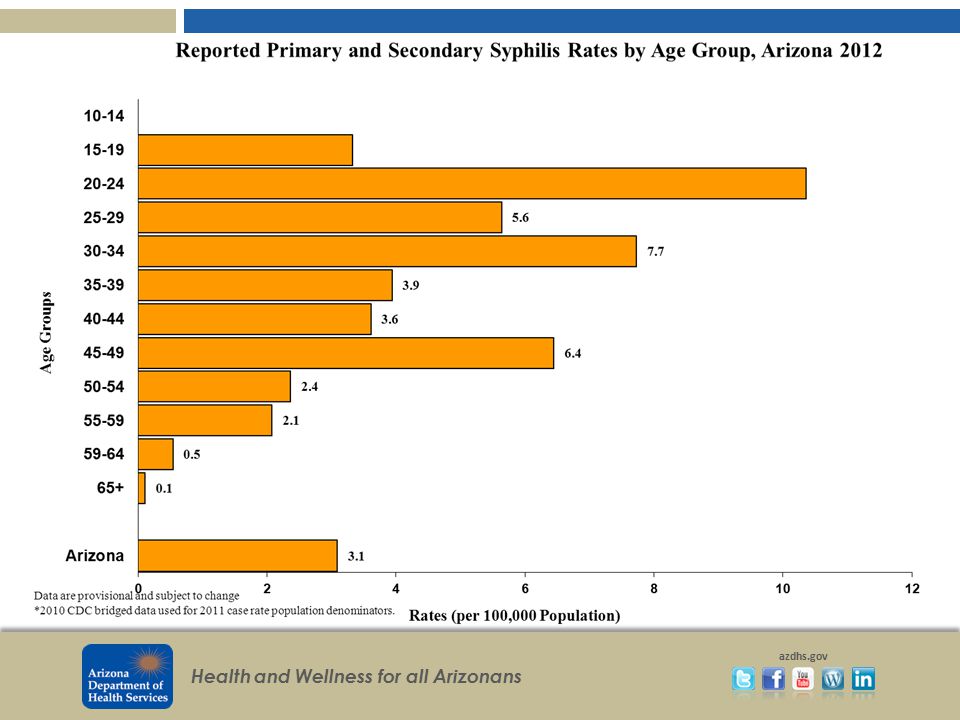
Joe Mireles, Epidemiologist/Syphilis Surveillance
117
Arizona 18th in 2011 by rate. National rate: 4.5 Maricopa ranked 13th by number of cases.

119
Of 720 cases, 81 were black

120
Maricopa County Total for 2011: 354

121
2011: 461 cases 2012: 339 cases Nearly 27% decrease

122
Ranked 6th by rate.

124
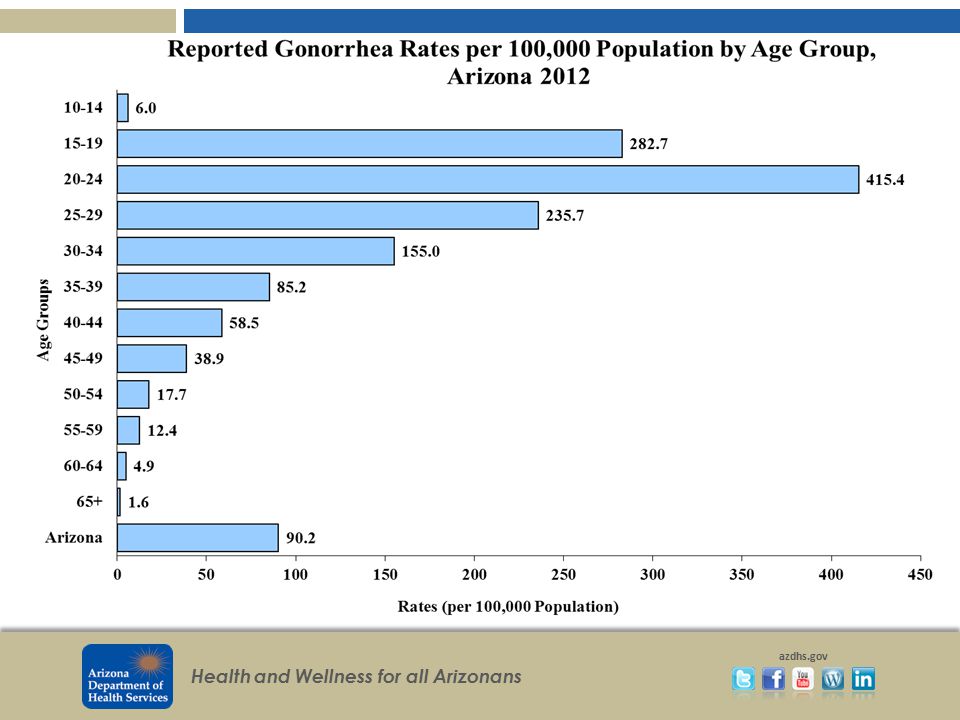
Kunuwo Fokong, Epidemiologist/Gonorrhea Surveillance
125
In 2011, increased by 4% nationally.
40% increase in 2011 28% increase in 2012 Overall 80% increase since 2010 Arizona ranked 32nd nationally by rate during 2011 (nat’l rate: ) Maricopa 15th by case in 2011
 Maricopa 15th by case in")
133
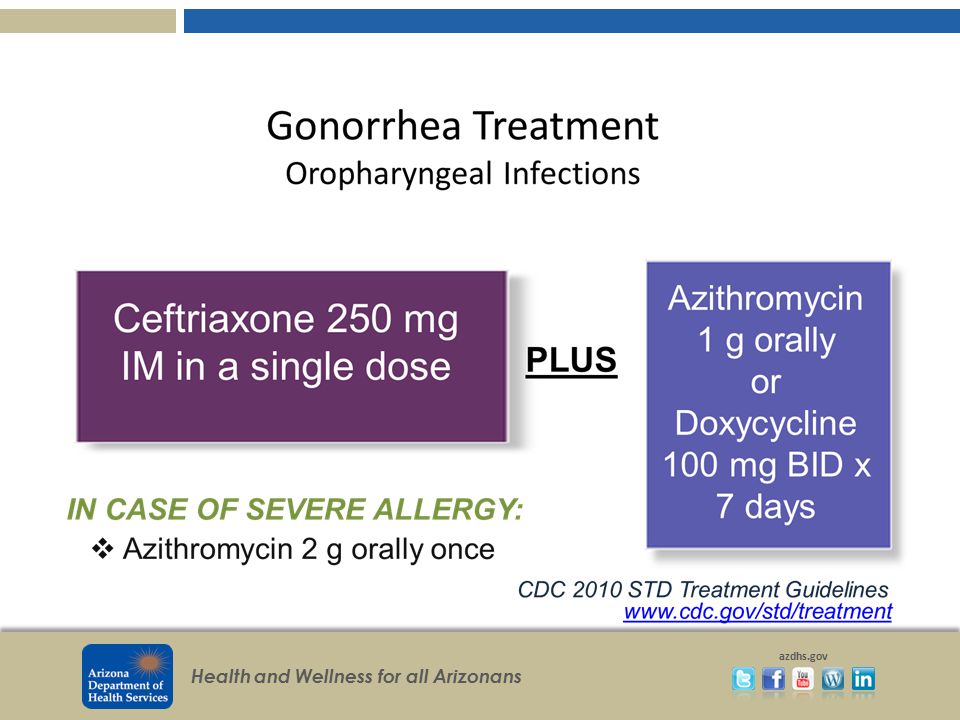
Treatment of Suspected Resistance
The Centers for Disease Control and Prevention (CDC) and the Arizona STD Control Program recommend the following in cases of suspected cephalosporin treatment If the patient has not already been treated with ceftriaxone 250 mg, then treat with ceftriaxone 250 mg IM x 1 AND azithromycin 1 gram orally in a single dose. Perform a test of cure with culture and antibiotic susceptibility testing (before re-treating). Inform your local health department. For clinical consultation call the STD Program's Medical Epidemiologist at (602) In patients who have already been treated with the recommended ceftriaxone regimen whose symptoms do not resolve after treatment, please call (602) for clinical consultation. Emphasize that patients should abstain from oral, vaginal, or anal sex until one week after the patient and all of his/her partners are treated.
 and the Arizona STD Control Program recommend the following in cases of suspected cephalosporin treatment. If the patient has not already been treated with ceftriaxone 250 mg, then treat with ceftriaxone 250 mg IM x 1 AND azithromycin 1 gram orally in a single dose. Perform a test of cure with culture and antibiotic susceptibility testing (before re-treating). Inform your local health department. For clinical consultation call the STD Program s Medical Epidemiologist at (602) In patients who have already been treated with the recommended ceftriaxone regimen whose symptoms do not resolve after treatment, please call (602) for clinical consultation. Emphasize that patients should abstain from oral, vaginal, or anal sex until one week after the patient and all of his/her partners are treated.")
134
Questions? Roxanne Ereth, Manager Melanie Taylor, MD
Melanie Taylor, MD Kerry Kenney, CDC Senior PHA/Syphilis Coordinator

135
Questions? Arshad Aziz, Epidemiologist/Data Manager
Anita Betancourt, Epidemiologist/IPP Coordinator/Chlamydia Surveillance Joe Mireles, Epidemiologist/Syphilis Surveillance Kunuwo Fokong, Epidemiologist/Gonorrhea Surveillance

136
Thanks! To the incredible staff in the ADHS STD Control Program. QUESTIONS?

137
Arizona HIV/AIDS Data January 2013
Rick DeStephens HIV Epidemiology

138
HIV/AIDS Events Per Year Arizona, 1981-2011
Whats important in this slide are the blue and green lines… HIV and deaths. This shows what an HIV epi curve looks like or epidemic stages. Incidence being new cases red and blue lines peaked REPORTING. Because at the beginning of the epidemic in the 80s and 90s people weren’t getting diagnosed and reported diagnosis’ until it was possibly too late and there were already sick.

139
Arizona 5-Year Emergent HIV/AIDS Case Rate Trend
Emergenct cases- are incident cases which are based upon the sum of new HIV cases, and new AIDS cases not diagnosed as HIV infections in any prior calendar year. Rates are Frequency with which an event occurs in a defined population. These annualized 5-year rates may be regarded as the average annual rate across the 5 years in the reporting timeframe. The State of Arizona is has experienced significant population growth over the last decade. Most of that growth is taking place in the Phoenix Metropolitan area. Recent trends show the 5-year HIV/AIDS emergence case rate has been declining. Steady decline throughout the 90s, leveling off from the period and beginning to decline lightly again starting with the time period. The rate of emergent HIV infection in AZ was per 100,000 per year during the time period. According to the most recent estimates of CDC, the 2010 estimated HIV/AIDS diagnosis rate for AZ was under the national rate.

140
Arizona Prevalent HIV, AIDS Cases
December 2004 – June 2012 Important slide to look at. prevalence rates continue to rise in Arizona. Prevalence of reported HIV infection is cases per 100,000 persons (up from in 2010). Currently, there are about 15,000 persons living with HIV/AIDS in Arizona, a rise of nearly 30% in 5 years. The increase in prevalence rates appears to be due to the efficacy of multi-drug treatments for HIV infection, which have sharply reduced HIV-related death. Additionally, Arizona’s increased population growth may be contributing to an increase in prevalence; 23% of prevalent cases were diagnosed in another state, while only 11% of cases present in Arizona five years ago have left the state. In June 2009, the number of persons living with AIDS in Arizona surpassed the number of persons with HIV infection who have not been diagnosed with AIDS. Because the burden of HIV-related disease is greater among persons with AIDS, treatment, utilization, and continuity of care will become increasingly critical issues.
. Currently, there are about 15,000 persons living with HIV/AIDS in Arizona, a rise of nearly 30% in 5 years. The increase in prevalence rates appears to be due to the efficacy of multi-drug treatments for HIV infection, which have sharply reduced HIV-related death. Additionally, Arizona’s increased population growth may be contributing to an increase in prevalence; 23% of prevalent cases were diagnosed in another state, while only 11% of cases present in Arizona five years ago have left the state. In June 2009, the number of persons living with AIDS in Arizona surpassed the number of persons with HIV infection who have not been diagnosed with AIDS. Because the burden of HIV-related disease is greater among persons with AIDS, treatment, utilization, and continuity of care will become increasingly critical issues.")
141
Arizona Emergent HIV/AIDS Rate by County 2006-2010
State Emergence Rate = 10.96 Correctional Dx: *68% of Pinal County **36% of Graham County

142
Arizona Emergent HIV/AIDS Cases, by County 2006-2010
Correctional Dx: *68% of Pinal County **36% of Graham County

143
Arizona Emergent HIV/AIDS by Gender: 1999-2011
Rate per 100,000 As we already know higher rates in males. 86% of total cases in AZ are males, for both prevalenace and incidence/emergent cases.

144
Arizona 5-Year New HIV/AIDS Rate by Race/Ethnicity, 1990-2011
Rates of HIV/AIDS prevalence and emergence differ sharply between African Americans and other race/ethnicity groups. African Americans are the only race/ethnicity group in Arizona that experiences such a severe disparity of HIV/AIDS impact. Currently, the emergent HIV/AIDS rate among African Americans in Arizona is nearly three times that of the state average. The disparity observed in Arizona among African Americans is also seen elsewhere in the country. The CDC estimates that, in 2009, blacks were 14% of the total population in states with established confidential HIV reporting, and 44% of new HIV diagnoses. *Non-Hispanic, A/PI/H=Asian/Pacific Islander/Native Hawaiian, AI/AN=American Indian/Alaska Native

145
HIV Incidence by Race 2000 to 2011

146
Risk -- New HIV/AIDS DX Men who have sex with men (MSM) account for the largest proportion of emergent HIV/AIDS cases in Arizona. The proprtion of emergent cases that are MSM-related hover right around 60%. This proportion had been rising over time, but has declined in recent years. The downward trend in rates among MSM has been mirrored by a similar upward trend among persons with no reported risk. It had reached a high of 26% in In recent years, increased efforts to ascertain risk has decreased NRR to 13%.
 account for the largest proportion of emergent HIV/AIDS cases in Arizona. The proprtion of emergent cases that are MSM-related hover right around 60%. This proportion had been rising over time, but has declined in recent years. The downward trend in rates among MSM has been mirrored by a similar upward trend among persons with no reported risk. It had reached a high of 26% in In recent years, increased efforts to ascertain risk has decreased NRR to 13%.")
147
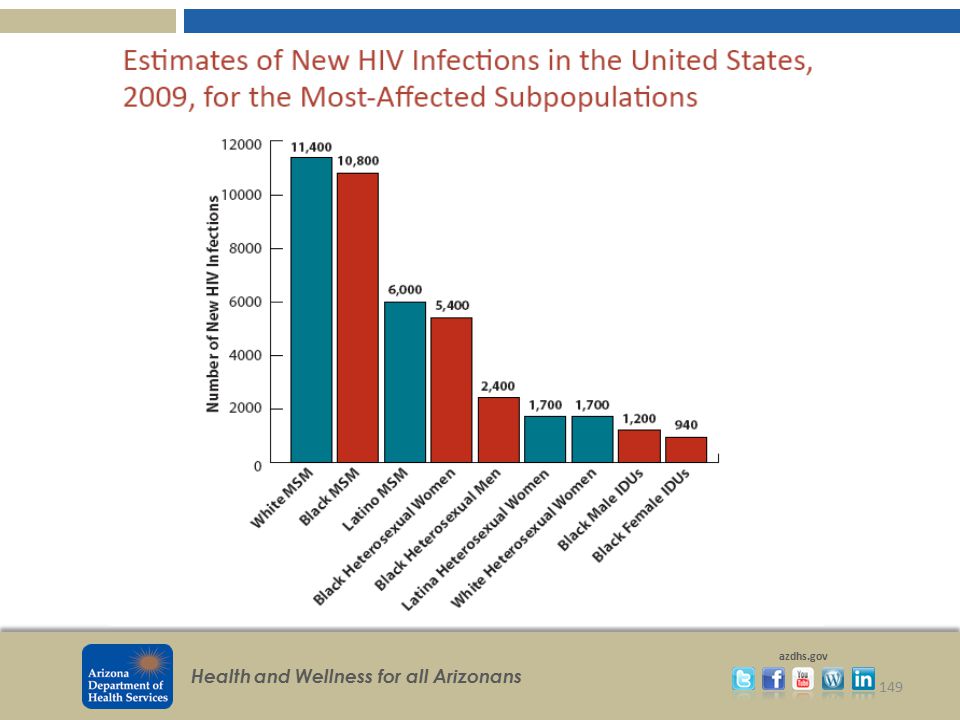
Transmission Category, Estimates of New HIV Infection, United States and Arizona, 2006
In Arizona, we show what is ACTUALLY being reported. we have a no reported risk/other category. The United States estimate does not include an NRR category. We don’t know exactly what they do but They assign a value based on an algorithm that looks at proportions in order to assign each NRR/other person to a particular category.

148
Female United States and Arizona Estimates of New HIV Infections, By Transmission Category
The United States estimate does not include an NRR category. US statistics found at IDU = Injection Drug User NRR =No Risk Reported

150
AZ HIV Epi On the Web

151
How you can help: Race Risk Earliest positive HIV test dates
Latest negative test date

152
This data brought to you by…
Your friendly state disease investigators. Julia (Capacity) Mersija (Core) Jillian(Incidence)
 Mersija (Core) Jillian(Incidence)")
153
Tuberculosis in Arizona
Tuberculosis Control Program Arizona Department of Health Services

154
TB Case Rates per 100,000 population, Arizona & U.S., 2000 - 2011

155
TB Cases by Race & Ethnicity, Arizona, 2007 -2011

156
TB Case Rates by Race & Ethnicity, Arizona, 2007-2011

157
TB Cases by Age Groups, Arizona, 2007 - 2011

158
Risk Factors for TB Cases, Arizona, 2011
% of Cases in AZ % of Cases in US Foreign-born 170 66.6 61.8 Correctional Facility Cases 64 24.6 4.2 HIV Positive 10 4.3 7.7 Contact of Infectious TB Case, <2 years 15 5.9 Diabetes Mellitus 31 12.2 Excess Alcohol 34 13.3 12.4 Non-injecting Drug Use 25 9.8 7.6 Injecting Drug Use 8 3.1 1.5 Homeless 5.8 Long-term Care Facility 2.3

159
U.S. –born & Foreign-born TB Cases, Arizona, 2007 - 2011

160
% of TB Cases with HIV Co-infection & % of HIV Results Known, Arizona, 2007 - 2011

161
Primary Resistance to Anti-TB Drugs, Arizona, 2007 – 2011

162
Interferon-Gamma Release Assays
Two IGRAs available and FDA approved QuantiFERON-TB Gold In-Tube test (QFT-GIT) T-SPOT.TB (T-Spot) Each of the tests measure different aspects of the immune response Results might not be interchangeable Different tests can yield different results
 T-SPOT.TB (T-Spot) Each of the tests measure different aspects of the immune response. Results might not be interchangeable. Different tests can yield different results.")
163
General Recommendations for Use of IGRAs
Used as aids in diagnosing infection with M. tuberculosis Should not be used for testing those at low risk for both infection and progression Same recommendation for TST IGRA lab testing availability should be determined prior to testing

164
Test Selection An IGRA may be used in place of (but not in addition to) a TST in all situation in which CDC recommends a TST Even in special circumstances, either test is considered acceptable medical and public health practice

165
Either TST or IGRA Contacts to an active case
Periodic screenings for occupation exposures Healthcare workers Two-step testing not needed with IGRA IGRAs do not have booster effect IGRAs may produce more conversions

166
New LTBI Treatment 3HP Once weekly dose for 12 weeks
Combination of Isoniazid & Rifapentine Once weekly dose for 12 weeks Must be given by DOT Healthy patients ≥ 12 years of age

167
TB Program Contacts Cara Christ, MD
TB Control Officer/Medical Director Carla Chee, MHS Office Chief Eric Hawkins, MS Program Manager Larissa Anderson Special Projects Epidemiologist Cherie Fulk, RN, MPH TB Nurse Coordinator Mary Gullion Program Project Specialist

Similar presentations


 patients Policy.>")


 Surveillance Report, 2010>")


