Download presentation
Presentation is loading. Please wait.

1
B. Derrick Taff April, 2009 Generalizing the Norm/Crowding Relationship: An Application of PCI

2
1978 – Transit shuttle and park and ride system established. 2000 -- Shuttle system between the Park & Ride lot and Bear Park & Ride lot and Bear Lake operates on 10-minute Lake operates on 10-minute headways during peak headways during peak periods. periods. 2002 -- Expansion of the Park & Ride lot to 338 spaces. Ride lot to 338 spaces. 2006 – Provision of Hiker shuttle service from Estes Park to service from Estes Park to the Park & Ride the Park & Ride Goal: Conserve natural, historical and cultural resources/reduce congestion and pollution/ultimately enhance visitor experiences

3
Introducing high frequency shuttles to the Bear Lake Road corridor has increased access to the trails within the corridor and has caused impacts: Integrity of the Park Resource Degradation Managerial Concerns

4
“Develop approaches to explicitly integrate transportation and user capacity planning in parks and public lands”

5
Research Goal: Optimize Transit Operations to Protect Park Resources & Visitor Experiences Vehicle Traffic Cadna-A Sound Grid Noise Impacts Perceived Impacts GIS Model Site Perceived Crowding Paramics Site Visitation Resource Impacts Perceived Impacts Pedestrian Model Experiential & Ecosystem Effects

6
6 Optimize Transit Operations to Protect Park Resources & Visitor Experiences -Vehicle traffic model -Visitor use models -Resource impact assessments -Roadway noise modeling -Visitor surveys Pettebone et al.

7
Visitor perceptions of Crowding and Transportation Systems Bear Lake Corridor Alberta Falls Glacier Gorge Dream Lake Emerald Lake n = 806 73% Response Rate

8
Structural Approaches to Norms Provide a framework for evaluating behaviors or conditions stemming from those behaviors Great for determining standards for acceptable recreation impacts -Personal Norms Individual expectations, learned from shared expectations -Social Norms Standards shared by members of a group -Subjective Norms What you think others would want you to do → leading to behavior - Encounter Norms Expectations in terms of the number of encounters with other people an individual would tolerate before their experience would be altered.

9
PCI Norm/Crowding Research Research Direction Generalizing the Encounter-Norm- Crowding Relationship Vaske & Donnelly, 2002 -“Theory predicts that when encounters exceed a visitor’s norm for seeing others, crowding will occur.” -Analyzed data from 13 different studies to support the hypotheses -Crowding was measured using the 9-pt scale -Continuing this research with a splash of Potential for Conflict Index

10
“When people evaluate an area as crowded, they have at least implicitly compared the condition they experienced (impacts) with their perception of what is acceptable (standards). If they conclude that the area is crowded, it would appear that the existing conditions exceeded their definition of a standard” (Vaske & Donnelly, 2002). Perceived Crowding = Descriptive info (density or encounter level) + Evaluative info (negative evaluation of density or encounter level)
. Perceived Crowding = Descriptive info (density or encounter level) + Evaluative info (negative evaluation of density or encounter level).")
11
How crowded did you feel while you were at the Park today? (Circle one number.) 123456789 Not at all Crowded Slightly Crowded Moderately Crowded Extremely Crowded Group 1: Not at all Crowded Group 2: Slightly Crowded Group 3: Moderately to Extremely Crowded
 Not at all Crowded Slightly Crowded Moderately Crowded Extremely Crowded Group 1: Not at all Crowded Group 2: Slightly Crowded Group 3: Moderately to Extremely Crowded.")
12
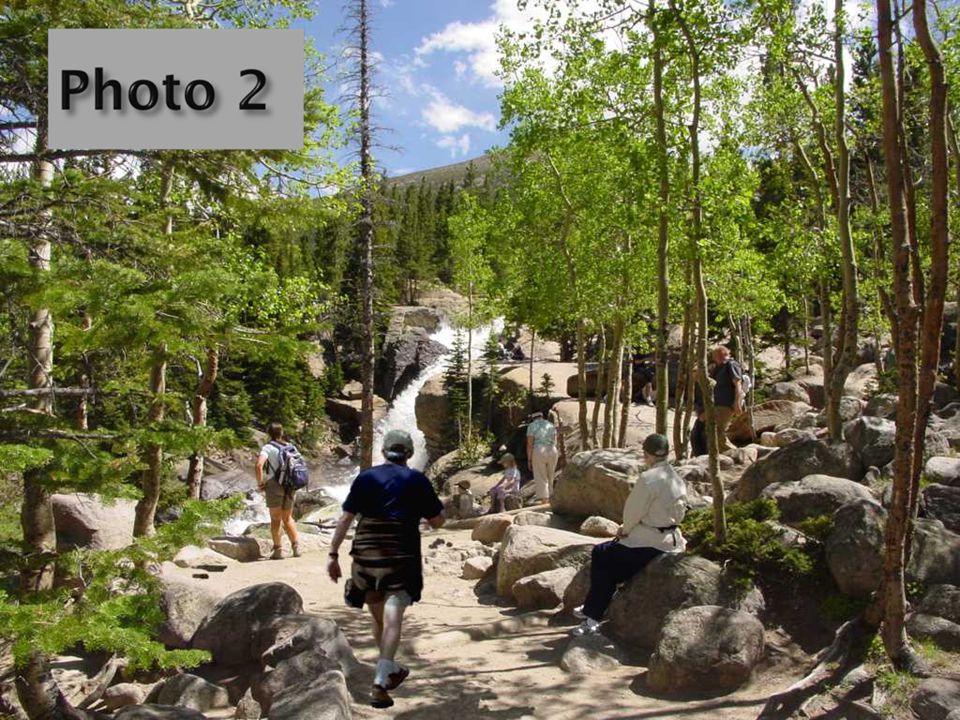
We would like to know how many other people you think you could encounter at the Park without feeling too crowded. To help judge this, please rate each of the photographs by indicating how acceptable you find it based on the number of people in the photo. (Circle one number for each photo) Very Unacceptable Very Acceptable Photo 1 -4-3-201234 Photo 2 -4-3-201234 Photo 3 -4-3-201234 Photo 4 -4-3-201234 Photo 5 -4-3-201234
 Very Unacceptable Very Acceptable Photo Photo Photo Photo Photo")
18
H 1 : When actual density exceeds encounter norms, visitor acceptability of crowding will decrease. H 2 : The most consensus regarding acceptability of crowding will occur at the least crowded and most crowded scenarios. H 3 : As level of perceived crowding increases, acceptability of crowding will vary among groups.

19
Photo Pair Mean 1 Mean 2 t-value p -value r (~0 People vs. ~7 People) 3.732.1021.08<.001.07 (~0 People vs. ~10 People) 3.73-.1643.83<.001.02 (~0 People vs. ~15 People) 3.73-2.0068.33<.001.01 (~0 People vs. ~25 People) 3.73-3.0792.31<.001.03 (~7 People vs. ~10 People) 2.10-.1639.73<.001.72 (~7 People vs. ~15 People) 2.10-2.0057.27<.001.52 (~7 People vs. ~25 People) 2.10-3.0768.48<.001.35 (~10 People vs. ~15 People) -.16-2.0038.43<.001.82 (~10 People vs. ~25 People) -.16-3.0744.28<.001.62 (~15 People vs. ~25 People) -2.00-3.0725.70<.001.84 1 Mean for first photo in the pair 2 Mean for second photo in the pair Tables are Awesome!!!
 < (~0 People vs. ~10 People) < (~0 People vs. ~15 People) < (~0 People vs. ~25 People) < (~7 People vs. ~10 People) < (~7 People vs. ~15 People) < (~7 People vs. ~25 People) < (~10 People vs. ~15 People) < (~10 People vs. ~25 People) < (~15 People vs. ~25 People) < Mean for first photo in the pair 2 Mean for second photo in the pair Tables are Awesome!!!.")
20
Visitor Acceptability of Photos Very Acceptable Neutral Very Unacceptable Acceptability Acceptability of Crowding at the Bear Lake Corridor of RMNP Visitor Norm: ~10 People ~ 0 People ~ 7 People ~10 People ~ 15 People ~ 25 People

21
Attitude Toward Crowding Level 1 Photo Not at All Slight Moderate – Extreme F p -value Eta #1 3.44 a 3.76 b 3.82 b 6.80.001*.13 #2 2.92 a 2.11 b 1.43 c 30.51<.001**.27 #3.87 a -.17 b -.93 c 33.70<.001**.28 #4 -1.19 a -2.11 b -2.41 b 18.14<.001**.21 #5 -2.51 a -3.17 b -3.33 b 12.70<.001**.18 1 Means with different subscripts are significant at the p<.05 level, accounting for multiple tests using the Scheffe’s S Method *p<.05; **p<.001 ~ 0 People ~ 7 People ~ 10 People ~ 15 People ~25 People

22
Group Perceptions of Crowding Across 5 Photos Very Acceptable Unsure Very Unacceptable Acceptability Not At All Crowded Slightly Crowded Moderately to Extremely Crowded Photo 1 Photo 2 Photo 3Photo 4Photo 5

23
Photos Crowding Groups PCI a PCI b PCI Difference* # 2 ~ 7 People Not at all Crowded vs. Slightly Crowded.03.204.71* Not at all Crowded vs. Moderately – Extremely Crowded.03.306.04* Slightly Crowded vs. Moderately – Extremely Crowded.20.302.00* # 4 ~15 People Not at all Crowded vs. Slightly Crowded.34.222.83* Not at all Crowded vs. Moderately – Extremely Crowded.34.242.36* Slightly Crowded vs. Moderately – Extremely Crowded.22.24.047 # 5 ~25 People Not at all Crowded vs. Slightly Crowded.21.141.57 Not at all Crowded vs. Moderately – Extremely Crowded.21.102.20* Slightly Crowded vs. Moderately – Extremely Crowded.14.101.11 *PCI difference tests larger than 1.96 are significant at p <.05

24
H 1 : When actual density exceeds encounter norms, visitor acceptability of crowding will decrease. Supported H 2 : The most consensus regarding acceptability of crowding will occur at the least crowded and most crowded scenarios. Supported H 3 : As level of perceived crowding increases, acceptability of crowding will vary among groups. Supported

25
Focus upon the three different groups and the norms/standards established through this analysis Management should focus upon those individuals that exhibit norms/standards at the extreme ends (Moderate – Extremely Crowded Group) Recreation Opportunity Spectrum Adapt management plans to better inform and educate visitors Zone for different user groups based upon interpretive information
 Recreation Opportunity Spectrum Adapt management plans to better inform and educate visitors Zone for different user groups based upon interpretive information")
26
-Test Different Methodologies Randomize Photos -Stay Consistent with Proven Scales (9-pt Scale) -Apply PCI to reports to enhance Management Implications -Establish Baselines
 -Apply PCI to reports to enhance Management Implications -Establish Baselines")
27
Questions?

Similar presentations


>")


; crowding Strategies: limit use;>")


 Lecture:3.>")


