Download presentation
Presentation is loading. Please wait.

1
SOUTH BRAZIL BIGHT Pontal do sul, Brazil, 2013 André Pereira Cattani

2
Study area – frame and graticule

3
Study area – from GEBCO Lite

4
Bathymetric contours and coastline

5
Sediment Thickness

6
Resampling Gridded Data with a "Dummy" Grid

7
Administrative Boundaries, Coastline and Bathymetric contours

8
Cutting a Shape to the Project Map Extent in Saga

9
Obtaining Area-Specific Marine Data from the World Ocean Database

11
Creating ODV Collections from WOD Data

13
Creating Marine Data Station Plots in ODV

14
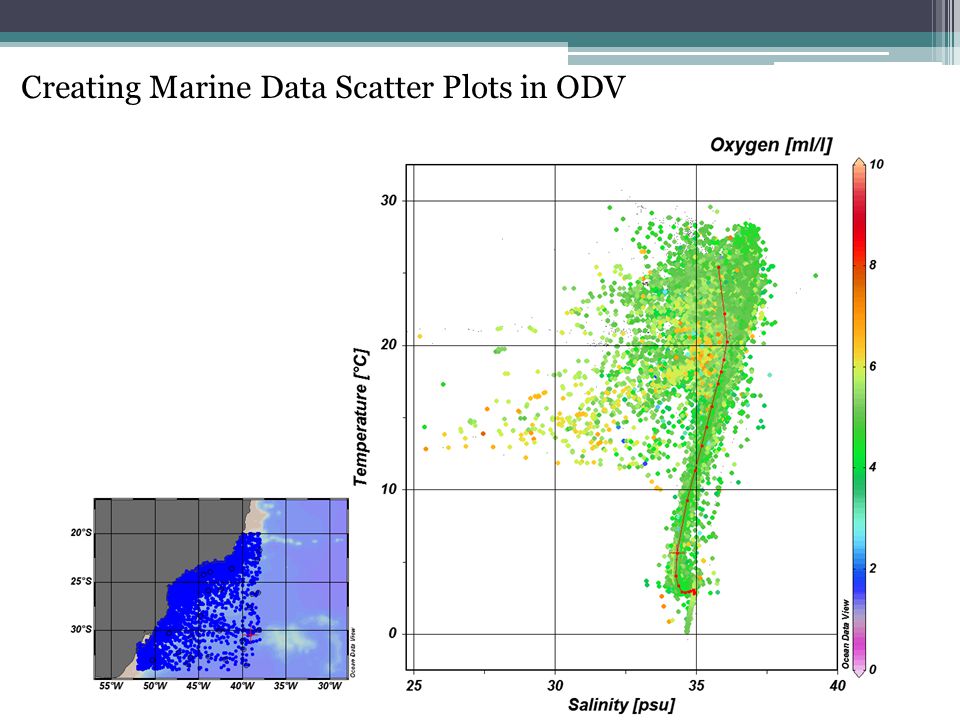
Creating Marine Data Scatter Plots in ODV

16
Creating Marine Data Section Plots in ODV

17
Creating Marine Data Section Plots in ODV – gridding points

18
Falar das possibilidades do subset Creating Marine Data Section Plots in ODV – timeline X axis

19
Converting a Data Table to a Points Shape in Saga from HDF view

20
Gridding Points Shapes in Saga – From HDF view 0.01; 1000x 1000y; -49.995x 1; 10x 10y; -49.5x -31.5y

21
Import clorophyll data – From HDF view Clorophyll (mg/m 3)
")
22
Plotting Vector Arrows from U and V Component Grids with Saga January Currents July Currents

23
Creating Vector Contours from Grids: GEBCO 08 Shelf Estimations

24
Interface area from IDV

25
Projecting study area from IDV to Google Earth

26
Primary Productivity data from IDV Source: NASA Aqua MODIS, 4.4 KM, Global, EXPERIMENTAL

27
SST data from 26/11 to 02/12 - GHRSST Source: GHRSST - JPL

28
Current vectors forecast from 26/11 to 02/12 - HYCOM Source: HYCOM THREDDS, Global 1/12 degrees

29
Current vectors + SST

30
END... cattani.andre@gmail.com

Similar presentations


 1.Set PowerPoint to work in Outline. View/Normal click.>")
