Download presentation
Presentation is loading. Please wait.

2
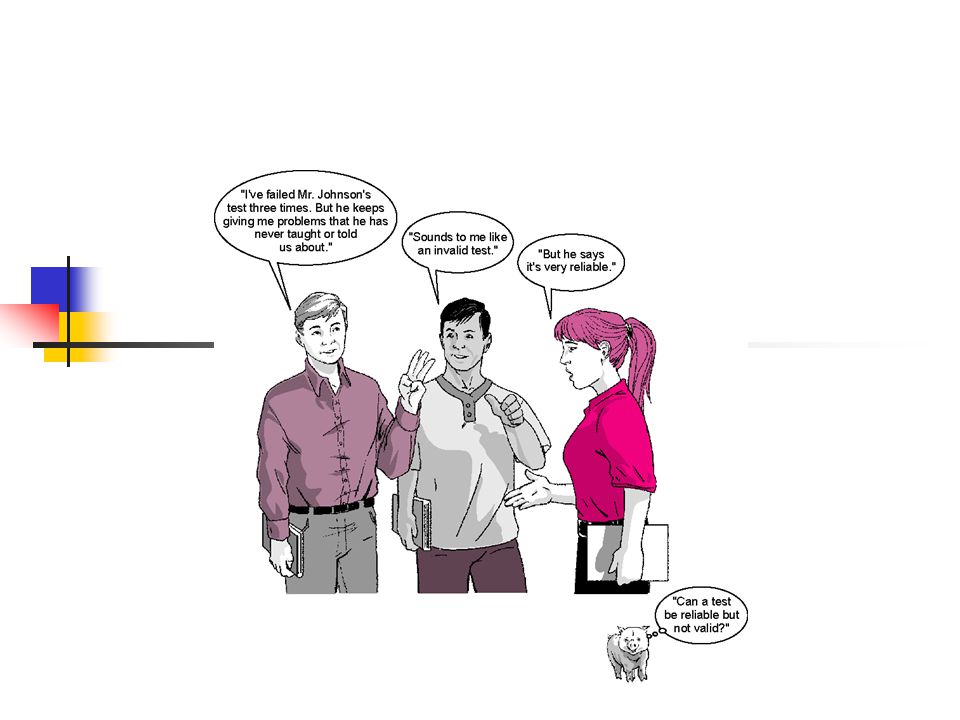
Validity and Reliability

4
Illustration of Types of Evidence of Validity (Figure 8.1)
")
5
Reliability and Validity (Figure 8.2)
")
6
Reliability of Measurement (Figure 8.3)
")
7
Methods of Checking Validity and Reliability (Table 8.2) Validity (“Truthfulness”) MethodProcedure Content-related evidenceExpert judgment Criterion-related evidenceRelate to another measure of the same variable Construct-related evidenceAssess evidence on predictions made from theory Reliability (“Consistency”) MethodContentTime IntervalProcedure Test-retestIdenticalVariesGive identical instrument twice Equivalent formsDifferentNoneGive two forms of instrument Equivalent forms/retestDifferentVariesGive two forms of instrument, with time interval between Internal consistencyDifferentNoneDivide instrument into halves and score each or use KR Observer agreementIdenticalNoneCompare scores obtained by two or more observers
 Validity ( Truthfulness ) MethodProcedure Content-related evidenceExpert judgment Criterion-related evidenceRelate to another measure of the same variable Construct-related evidenceAssess evidence on predictions made from theory Reliability ( Consistency ) MethodContentTime IntervalProcedure Test-retestIdenticalVariesGive identical instrument twice Equivalent formsDifferentNoneGive two forms of instrument Equivalent forms/retestDifferentVariesGive two forms of instrument, with time interval between Internal consistencyDifferentNoneDivide instrument into halves and score each or use KR Observer agreementIdenticalNoneCompare scores obtained by two or more observers")
8
Reliability Worksheet (Figure 8.5)
")
9
Educational Research Chapter 13 Experimental Research Gay and Airasian

10
Experimental Research 13

11
Experimental Research

12
Key Characteristics of Experimental Designs Procedures are designed that address potential threats to validity Internal External Construct Statistical Conclusion Statistical comparisons of different groups are conducted

13
Selecting Participants and Assigning Them to Treatments Decide on the experimental unit of analysis to be treated individual group or groups organization Randomly assign individuals to groups control for extraneous characteristics that might influence the outcome

14
Topics Discussed in this Chapter Defining characteristics The experimental process Manipulation and control Threats to validity Internal validity External validity Group designs Single subject designs

15
Defining Characteristics Research designed to investigate cause and effect relationships through the direct manipulation of an independent variable and control of extraneous variables Independent variable – the variable being manipulated Dependent variable – the variable in which the effect of the manipulation of the independent variable are observed Researcher manipulation and control – choice of treatments, choice of a research design, use of specific procedures, etc.

16
Experimental Process Selection and definition of problem Selection of participants & instruments Selection and assignment of participants Selection of research plan Comparison of two approaches Comparison of new versus existing approaches Comparison of different amounts of single approach Execution of research plan Sufficient exposure to treatment Operationally different treatments Analysis of data Formulation of conclusions

17
Manipulation and Control Manipulation The researcher’s decisions related to what will make up the independent variable Active variables versus assigned variables Control The researcher’s efforts to remove the influence of any extraneous variables that might have an effect on the dependent variable The goal is to be assured the only differences between groups is that related to the independent variable

18
Internal Validity 9

19
Experimental Validity Internal validity – the degree to which the results are attributable to the independent variable and not some other rival explanation External/ecological validity – the extent to which the results of a study are generalizable Relative importance of internal and external validity

20
Internal Validity

21
Threats to Internal Validity History Maturation Testing Instrumentation Statistical regression Differential selection of participants Mortality Selection-maturation interaction, etc.

22
Mortality Threat to Internal Validity (Figure 9.1)
")
23
Location Might Make a Difference (Figure 9.2)
")
24
Instrument Decay (Figure 9.3)
")
25
A Data Collector Characteristics Threat (Figure 9.4)
")
26
A Testing Threat to Internal Validity (Figure 9.5)
")
27
A History Threat to Internal Validity (Figure 9.6)
")
28
Could Maturation be at Work Here? (Figure 9.7)
")
29
The Attitude of Subjects Can Make a Difference (Figure 9.8)
")
30
Regression Rears Its Head (Figure 9.9)
")
31
Illustration of Threats to Internal Validity (Figure 9.10)
")
32
Techniques for Controlling Threats to Internal Validity (Table 9.1) Technique Obtain MoreObtain MoreChoose StandardizeInformationInformation Appropriate Threat Conditionson Subjectson Details Design Subject characteristicsXX MortalityXX LocationXX InstrumentationXX TestingX HistoryXX MaturationXX Subject attitudeXXX RegressionXX ImplementationXXX
 Technique Obtain MoreObtain MoreChoose StandardizeInformationInformation Appropriate Threat Conditionson Subjectson Details Design Subject characteristicsXX MortalityXX LocationXX InstrumentationXX TestingX HistoryXX MaturationXX Subject attitudeXXX RegressionXX ImplementationXXX")
33
Threats to External Validity Pre-test treatment interaction Multiple treatment interference Selection treatment interaction Specificity of variables Treatment diffusion Experimenter effects Reactive arrangements Artificial environment Hawthorne effect John Henry effect Placebo effect Novelty effect

34
Controlling for Extraneous Variables Randomization Selection Assignment Matching Identifying pairs of subjects “matched” on specific characteristics of interest Randomly assigning subjects from each pair to different groups Difficulty with subjects for whom no match exists

35
A Randomized Posttest-Only Control Group Design, Using Matched Subjects (Figure 13.7)
")
36
Matching Process Based on Gender Experimental Group Control Group John Jim James Josh Jackson Jane Johanna Julie Jean Jeb

37
Controlling for Extraneous Variables Comparing homogeneous groups Restricting subjects to those with similar characteristics Problems related to restriction of generalization Build the variable into the design (e.g., factorial design) Using subjects as their own controls Multiple treatments across time Problem with carry-over effect Analysis of covariance (ANCOVA)
 Using subjects as their own controls Multiple treatments across time Problem with carry-over effect Analysis of covariance (ANCOVA)")
38
Group Designs Two major classes of designs Single-variable designs – one independent variable Factorial designs – two or more independent variables Three types of designs Pre-experimental designs Experimental designs Quasi-experimental designs

39
Pre-Experimental Designs Types One-shot case study One-group pretest-posttest design Static group comparison Threats to internal validity – see Figure 13.1

40
Example of a One-Shot Case Study Design (Figure 13.1)
")
41
Example of a Randomized Posttest-Only Control Group Design (Figure 13.4)
")
42
Example of a Randomized Solomon Four-Group Design (Figure 13.6)
")
43
Example of a One-Group Pretest-Posttest Design (Figure 13.2)
")
44
Example of a Static-Group Comparison Design (Figure 13.3)
")
45
Example of a Randomized Posttest-Only Control Group Design (Figure 13.4)
")
46
True Experimental Designs Types Pretest-posttest control group design Posttest only control group design Solomon four-group comparison Threats to internal validity – see Figure 13.2

47
Example of a Randomized Pretest-Posttest Control Group Design (Figure 13.5)
")
48
Quasi-Experimental Designs Types Non-equivalent control group design Time series design Counterbalanced design Threats to internal validity – see Figure 13.2

49
Results (Means) from a Study Using a Counterbalanced Design ( Figure 13.8)
 from a Study Using a Counterbalanced Design ( Figure 13.8)")
50
Possible Outcome Patterns in a Time-Series Design (Figure 13.9)
")
51
Using a Factorial Design to Study Effects of Method and Class Size on Achievement (Figure 13.10)
")
52
Illustration of Interaction and No Interaction in a 2 by 2 Factorial Design (Figure 13.11)
")
53
Example of a 4 by 2 Factorial Design (Figure 13.13)
")
54
Effectiveness of Experimental Designs in Controlling Threats to Internal Validity (Table 13.1) SubjectInstru-Data Collec- Charac-Morta-Loca-menttor Charac-Data Col-Matur-Atti-Regres-Implemen- DesignteristicslitytionDecayteristicslector BiasTestingHistoryationtudinalsiontation One-shot case study –––(NA)––(NA)––––– One group pre- posttest–?–––––––––– Static group comparison–––+––+?+––– Randomized post- test-only control group+++–+––+++++–++– Randomized pre- post-test control group+++–+––++++–++– Solomon four- group++++–+––+++++–++– Randomized posttest only control group with matched subjects+++–+––+++++–++– Matching-only pre-posttest control group++–+––+++–+– Counterbalanced++++–+–––++++++++– Time-series++–+_––––+–++– Factorial with randomization++++–++––++++–++– Factorial without randomization??–++––+++–?– KEY: (++) = strong control, threat unlikely to occur; (+) = some control, threat may possibly occur; (–) = weak control, threat likely to occur; (?) = can’t determine; (NA) = threat does not apply
 SubjectInstru-Data Collec- Charac-Morta-Loca-menttor Charac-Data Col-Matur-Atti-Regres-Implemen- DesignteristicslitytionDecayteristicslector BiasTestingHistoryationtudinalsiontation One-shot case study –––(NA)––(NA)––––– One group pre- posttest– –––––––––– Static group comparison–––+––+ +––– Randomized post- test-only control group+++–+––+++++–++– Randomized pre- post-test control group+++–+––++++–++– Solomon four- group++++–+––+++++–++– Randomized posttest only control group with matched subjects+++–+––+++++–++– Matching-only pre-posttest control group++–+––+++–+– Counterbalanced++++–+––– – Time-series++–+_––––+–++– Factorial with randomization++++–++––++++–++– Factorial without randomization –++––+++– – KEY: (++) = strong control, threat unlikely to occur; (+) = some control, threat may possibly occur; (–) = weak control, threat likely to occur; ( ) = can’t determine; (NA) = threat does not apply")
55
Single-Subject Research Designs that can be applied when the sample size is one Study behavior change in an individual as the result of some treatment Subject serves as his or her own control Rationale Sophistication of specific designs allows for the control of internal validity threats Research is focused on therapeutic impact in clinical settings, not contribution to a research base Group comparison designs are sometimes opposed or unethical Group comparison designs are not possible

56
Single-Subject Research Concerns External validity Low generalizability due to the nature of the design The effect of the baseline condition on the subsequent effects of the treatment Threats can be lessened through replication Internal validity Possible to control for most threats Repeated and reliable measures Baseline stability Number of data points Single-variable rule Specification or the nature and conditions of the treatment

57
Single-Subject Research Designs A B A Withdrawal A B A B Multiple Baseline Alternating Treatments Data analysis and interpretation Based on visual inspection and analysis of a graphic presentation of the results Criterion of effectiveness is clinical significance, not statistical significance Debate about the use of statistical procedures

58
Single-Subject Research Replication Establishes the generalizability of findings Three types Direct – same researcher with the same or different participants in a specific setting Systematic – follows direct replication but with different researchers, behaviors, or settings Clinical – development of treatment packages composed of tow or more interventions which have been found to be effective individually

Similar presentations


 Noriziati Abd Halim (2013277906) Noor fadzilah.>")


