Download presentation
Presentation is loading. Please wait.

1
13. Structure Determination: Nuclear Magnetic Resonance Spectroscopy

2
2 Why This Chapter? NMR is the most valuable Used to determine relative location of atoms Maps carbon-hydrogen framework of molecules Depends on very strong magnetic fields More advanced NMR techniques are used in biological chemistry to study protein structure and folding Mass Spec:Molecular size & formula IR:Functional Groups NMR:Map of Carbons with Hydrogens

3
3 13.1 Nuclear Magnetic Resonance Spectroscopy Internal magnetic fields align parallel to or against an aligned external magnet external magnet Parallel: ~ lower E Antiparallel: ~ higher E Parallel orientation is lower in energy making this spin state more populated Nuclei w/odd # of protons or odd # of neutrons (~ 1 H, 13 C, 14 N, 2 H) spin so act like tiny magnets randomly oriented.
 spin so act like tiny magnets randomly oriented.")
4
4 Nuclear Magnetic Resonance Radio energy of exactly correct frequency (resonance) causes the parallel nuclei to flip to anti-parallel state Energy needed to flip a spinning parallel nucleus is related to its molecular environment (proportional to field strength, B)
 causes the parallel nuclei to flip to anti-parallel state Energy needed to flip a spinning parallel nucleus is related to its molecular environment (proportional to field strength, B)")
5
5 Nuclear Magnetic Resonance Radio energy of exactly correct frequency (resonance) causes the parallel nuclei to flip to anti-parallel state Energy needed to flip a spinning parallel nucleus is related to its molecular environment (proportional to field strength, B) If nucleus is protected (shielded) from the magnet it takes less E to flip. If nucleus is exposed to the magnet then takes more E to flip.

6
Example: I takes 8.0x10 -5 kJ/mol to spin-flip a proton at 200 MHz. Calculate the Energy required to spin-flip a proton ( 1 H) in a spectrometer operating at 300 MHz. 6 8.0x10 -5 kJ/mol 200 MHz = X kJ/mol 300 MHz X = 1.2x10 -4 kJ/mol
 in a spectrometer operating at 300 MHz x10 -5 kJ/mol 200 MHz = X kJ/mol 300 MHz X = 1.2x10 -4 kJ/mol.")
7
7 13.2 The Nature of NMR Magnet (Applied Field) The sample is dissolved in a solvent that does not have a signal itself Radiofrequency energy is transmitted and absorption is detected
 The sample is dissolved in a solvent that does not have a signal itself Radiofrequency energy is transmitted and absorption is detected")
8
8 The Nature of NMR Absorptions 1 H NMR of methyl acetate has 2 equivalent kinds of H’s so shows 2 peaks Electrons in neighboring bonds shield or expose nuclei from magnetic field H’s on C next to electron withdrawing C=O H’s on C next to electron withdrawing O Intensity of 1 H NMR peak is proportional to # of equivalent H’s

9
9 13 C NMR of methyl acetate has 3 kinds of C’s so shows 3 peaks Electrons in neighboring bonds shield nuclei from magnetic field C next door to electron withdrawing C=O C next to electron withdrawing O C of C=O Intensity of 13 C NMR peak is not related to # of equivalent C’s

10
10 At room temperature cyclohexane conformations are interconverting so rapidly that axial and equatorial 1 H’s appear identical. When cold cyclohexane conformations intercovert so slowly that axial and equatorial 1 H’s appear different.

11
1H1H 13 C Example: How many signals would you expect each to have in its 1 H and 13 C spectra? 11

12
Solution: How many signals would you expect each to have in its 1 H and 13 C spectra? 12 1H1H 13 C 12 35

13
13 Shift = relative energy of resonance 13.3 Chemical Shifts Downfield = deshielded (more exposed to magnet) Upfield = shielded (more protected from magnet) tetramethylsilane [TMS] Reference point
![13 Shift = relative energy of resonance 13.3 Chemical Shifts Downfield = deshielded (more exposed to magnet) Upfield = shielded (more protected from magnet) tetramethylsilane [TMS] Reference point](http://images.slideplayer.com/10/2807535/slides/slide_13.jpg "13 Shift = relative energy of resonance 13.3 Chemical Shifts Downfield = deshielded (more exposed to magnet) Upfield = shielded (more protected from magnet) tetramethylsilane [TMS] Reference point")
14
14 13.3 Chemical Shifts Other signals measured in ppm relative to TMS tetramethylsilane [TMS] Reference point
![Chemical Shifts Other signals measured in ppm relative to TMS tetramethylsilane [TMS] Reference point](http://images.slideplayer.com/10/2807535/slides/slide_14.jpg "Chemical Shifts Other signals measured in ppm relative to TMS tetramethylsilane [TMS] Reference point")
15
15 Measuring Chemical Shift Numeric value of chemical shift: difference between strength of magnetic field at which the observed nucleus resonates and field strength for resonance of a reference Difference is very small but can be accurately measured Taken as a ratio to the total field and multiplied by 10 6 so the shift is in parts per million (ppm) Absorptions normally occur downfield of TMS, to the left on the chart Calibrated on relative scale in delta ( ) scale Independent of instrument’s field strength
 Absorptions normally occur downfield of TMS, to the left on the chart Calibrated on relative scale in delta ( ) scale Independent of instrument’s field strength")
16
16 13.4 Signal Averaging & FT-NMR Carbon-13: (only carbon isotope with a nuclear spin) Natural abundance =1.1% of C’s so sample is very dilute in this isotope Single run Average of 200 runs Sample measured using repeated accumulation of data and averaging of signals, incorporating pulse and the operation of Fourier transform (FT-NMR) All signals are obtained simultaneously using a broad pulse of energy and resonance recorded Frequent repeated pulses give many sets of data that are averaged to eliminate noise Fourier-transform of averaged pulsed data gives spectrum
 Natural abundance =1.1% of C’s so sample is very dilute in this isotope Single run Average of 200 runs Sample measured using repeated accumulation of data and averaging of signals, incorporating pulse and the operation of Fourier transform (FT-NMR) All signals are obtained simultaneously using a broad pulse of energy and resonance recorded Frequent repeated pulses give many sets of data that are averaged to eliminate noise Fourier-transform of averaged pulsed data gives spectrum")
17
17 13.5 13 C NMR Spectroscopy Each signal shows different types of environments of carbon 13 C resonances are 0 to 220 ppm downfield from TMS C’s shift downfield (deshield) if next to electron-withdrawing Like O, N, X (halogens) sp 3 C signal ~ 0 to 90 sp 2 C ~ 110 to 220 C(=O) at low field, 160 to 220
 if next to electron-withdrawing Like O, N, X (halogens) sp 3 C signal ~ 0 to 90 sp 2 C ~ 110 to 220 C(=O) at low field, 160 to 220")
18
18 13 C NMR Example: 2-butanone

19
19 13 C NMR Example: p-bromoacetopheone

20
Learning Check: 20 Assign resonances in the given 13 C spectrum of methyl propanoate 1234

21
Solution: 21 Assign resonances in the given 13 C spectrum of methyl propanoate 1234

22
22 13.6 DEPT 13 C NMR DEPT (distortionless enhancement by polarization transfer) Normal spectrum shows all C’s then: Obtain spectrum of all C’s except quaternary (broad band decoupled) Change pulses to obtain separate information for CH 2, CH Subtraction reveals each type
 Normal spectrum shows all C’s then: Obtain spectrum of all C’s except quaternary (broad band decoupled) Change pulses to obtain separate information for CH 2, CH Subtraction reveals each type")
23
23 Normal spectrum shows all C’s: (Difficult to Assign so many C’s) DEPT-90: shows only CH’s Quaternary C’s don’t show (Can now narrow our assignments) DEPT 13 C NMR 5 2 6
 DEPT-90: shows only CH’s Quaternary C’s don’t show (Can now narrow our assignments) DEPT 13 C NMR 5 2 6")
24
24 Normal spectrum shows all C’s: (Difficult to Assign so many C’s) DEPT-135: Positive =shows CH’s and CH 3 ’s DEPT 13 C NMR Negative =shows CH 2 ’s (Can narrow assignments even further) 5 2 6 1 7,8
 DEPT-135: Positive =shows CH’s and CH 3 ’s DEPT 13 C NMR Negative =shows CH 2 ’s (Can narrow assignments even further) ,8")
25
25 Normal spectrum shows all C’s: (Difficult to Assign so many C’s) DEPT-135: Positive =shows CH’s and CH 3 ’s DEPT 13 C NMR Negative =shows CH 2 ’s (Can narrow assignments even further) 5 2 1 7,8 6 2 4
 DEPT-135: Positive =shows CH’s and CH 3 ’s DEPT 13 C NMR Negative =shows CH 2 ’s (Can narrow assignments even further) ,")
26
26 13.7 Uses of 13 C NMR: Example Evidence for product of elimination of 1-chloro-methyl cyclohexane Expect 7 different C’s; 5 sp 3 resonances 20-50 2 sp 2 resonances 100-150 Expect 5 different C’s; 3 sp 3 resonances 20-50 2 sp 2 resonances 100-150

27
27 13.8 1 H NMR & Proton Equivalence Proton NMR is much more sensitive than 13 C and the active nucleus ( 1 H) is nearly 100 % of the natural abundance Shows how many kinds of nonequivalent hydrogens are in a compound Theoretical equivalence can be predicted by seeing if replacing each H with “X” gives the same or different outcome Equivalent H’s have the same signal while nonequivalent are different There are degrees of nonequivalence
 is nearly 100 % of the natural abundance Shows how many kinds of nonequivalent hydrogens are in a compound Theoretical equivalence can be predicted by seeing if replacing each H with X gives the same or different outcome Equivalent H’s have the same signal while nonequivalent are different There are degrees of nonequivalence")
28
28 Nonequivalent H’s If replacement of each H with “X” gives a different constitutional isomer then the H’s are in constitutionally heterotopic environments and will have different chemical shifts – they are nonequivalent under all circumstances

29
29 Equivalent H’s Two H’s that are in identical environments (homotopic) have the same NMR signal Test by replacing each with X if they give the identical result, they are equivalent (homotopic)
 have the same NMR signal Test by replacing each with X if they give the identical result, they are equivalent (homotopic)")
30
30 Enantiotopic Distinctions If H’s are in environments that are mirror images of each other, they are enantiotopic Replacement of each H with X produces a set of enantiomers The H’s have the same NMR signal (in the absence of chiral materials)
")
31
31 Diastereotopic Distinctions In a chiral molecule, paired hydrogens can have different environments and different shifts Replacement of a pro-R hydrogen with X gives a different diastereomer than replacement of the pro-S hydrogen Diastereotopic hydrogens are distinct chemically and spectrocopically *

32
Learning Check: 32 Identify sets of H’s as Unrelated (U), homotopic (H), enantiotopic (E), or diasterotopic (D)
, homotopic (H), enantiotopic (E), or diasterotopic (D)")
33
Solution: Identify sets of H’s as Unrelated (U), homotopic (H), enantiotopic (E), or diasterotopic (D) 33 DD D E DH
, homotopic (H), enantiotopic (E), or diasterotopic (D) 33 DD D E DH")
34
34 13.9 Chemical Shifts in 1 H NMR Proton signals range from 0 to 10 Electronegative atoms cause downfield shift H’s on sp 3 C Higher field H’s on sp 2 C Lower field

35
Shifts in 1 H NMR 35

36
36 13.10 Integration of 1 H NMR Absorptions: Proton Counting The relative intensity of a signal (integrated area) is proportional to the number of protons causing the signal For example in ethanol (CH 3 CH 2 OH), the signals have the integrated ratio 3:2:1 For narrow peaks, the heights are the same as the areas and can be measured with a ruler 3 1
 is proportional to the number of protons causing the signal For example in ethanol (CH 3 CH 2 OH), the signals have the integrated ratio 3:2:1 For narrow peaks, the heights are the same as the areas and can be measured with a ruler 3 1")
37
37 13.11 Spin-Spin Splitting in 1 H NMR Peaks are often split into multiple peaks due to interactions between nonequivalent protons on adjacent carbons, called spin-spin splitting The splitting is into one more peak than the number of H’s on the adjacent carbon (“n+1 rule”) The relative intensities are in proportion of a binomial distribution and are due to interactions between nuclear spins that can have two possible alignments with respect to the magnetic field The set of peaks is a multiplet (2 = doublet, 3 = triplet, 4 = quartet)
 The relative intensities are in proportion of a binomial distribution and are due to interactions between nuclear spins that can have two possible alignments with respect to the magnetic field The set of peaks is a multiplet (2 = doublet, 3 = triplet, 4 = quartet)")
38
38 Simple Spin-Spin Splitting In bromoethane see 2 kinds of H’s One at 3.42 and one at 1.68 Each signal split by neighbors

39
39 Simple Spin-Spin Splitting An adjacent CH 3 group can have four different spin alignments as 1:3:3:1 An adjacent CH 2 gives a ratio of 1:2:1 J (coupling constant) = The separation of peaks in a multiplet is a constant, in Hz
 = The separation of peaks in a multiplet is a constant, in Hz")
40
40 Rules for Spin-Spin Splitting Equivalent protons do not split each other The signal of a proton with n equivalent neighboring H’s is split into n + 1 peaks Protons farther than 2 C’s apart do not split each other

41
n+1 41

42
Spin-Spin Splitting Example: 42 Shift ~4.3 (deshielded) 1 H see’s 6 neighbors (6+1=7 septuplet) Shift ~1.7 (shielded) 6 H’s see 1 neighbor (1+1=2 doublet) Integration shows ~6:1 ratio 6 1
 1 H see’s 6 neighbors (6+1=7 septuplet) Shift ~1.7 (shielded) 6 H’s see 1 neighbor (1+1=2 doublet) Integration shows ~6:1 ratio 6 1")
43
Spin-Spin Splitting Example: 43 Shift ~7.8 & 6.8 (deshielded) 2 H’s see 1 neighbor 2x (1+1=2 doublet) (typical para pattern) Integration shows ratio 2 2 3 2 3 a a a b b b Singlet at 3.8 (deshielded) 3 H’s see 0 neighbors (typical CH 3 -O) Triplet ~1.2 (shielded) 3 H’s see 2 neighbors (typical CH 3 -CH 2 ) Quartet ~2.8 (~deshielded) 2 H’s see 3 neighbors (typical CH 3 -CH 2 - c=o )
 2 H’s see 1 neighbor 2x (1+1=2 doublet) (typical para pattern) Integration shows ratio a a a b b b Singlet at 3.8 (deshielded) 3 H’s see 0 neighbors (typical CH 3 -O) Triplet ~1.2 (shielded) 3 H’s see 2 neighbors (typical CH 3 -CH 2 ) Quartet ~2.8 (~deshielded) 2 H’s see 3 neighbors (typical CH 3 -CH 2 - c=o )")
44
Learning Check: From the 1H NMR of C 4 H 10 O propose a structure. 44

45
Solution: From the 1H NMR of C 4 H 10 O propose a structure. 45

46
46 13.12 More Complex Spin-Spin Splitting Patterns: trans-cinnamaldehyde Spectra more complex if overlapping signals, multiple nonequivalence 1 1 1 2 a a a b b b c c 3 Doublet ~9.8 (deshielded) 1 H see 1 neighbor (typical aldehyde) Doublet of Doublets (dd) ~6.7 (~deshielded) 1 H see’s 2 different neighbors (typical CH-CH-CH) 3 1 2
 1 H see 1 neighbor (typical aldehyde) Doublet of Doublets (dd) ~6.7 (~deshielded) 1 H see’s 2 different neighbors (typical CH-CH-CH) 3 1 2")
47
47

48
48 13.12 More Complex Spin-Spin Splitting Patterns: trans-cinnamaldehyde Spectra more complex if overlapping signals, multiple nonequivalence 1 1 1 2 a a a b b b c c 3 Doublet ~9.8 (deshielded) 1 H see 1 neighbor (typical aldehyde) Doublet at 7.5 (deshielded) 1 H see’s 1 neighbor (large J value typical trans alkene H) b = dd 2 H’s see 2 different neighbors (typical CH-CH-CH) Doublet of Doublets (dd) ~6.7 (~deshielded) 1 H see’s 2 different neighbors (typical CH-CH-CH) 3 1 2 a = d 2 H’s see 1 neighbor (typical CH-CH)
 1 H see 1 neighbor (typical aldehyde) Doublet at 7.5 (deshielded) 1 H see’s 1 neighbor (large J value typical trans alkene H) b = dd 2 H’s see 2 different neighbors (typical CH-CH-CH) Doublet of Doublets (dd) ~6.7 (~deshielded) 1 H see’s 2 different neighbors (typical CH-CH-CH) a = d 2 H’s see 1 neighbor (typical CH-CH)")
49
49 13.13 Uses of 1 H NMR Spectroscopy Determine the regiochemistry of hydroboration/oxidation of methylenecyclohexane. Which structure gives this 1H NMR?

50
50

51
Which of the following nuclei does not show magnetic behavior? 1. 1 H 2. 2 H 3. 12 C 4. 13 C 5. 17 O

52
Which of the following is true of 13 C NMR spectra? 1. The number of carbon atoms in a molecule can be ascertained. 2. The number of hydrogen atoms in a molecule can be ascertained. 3. Certain functional groups can be deduced from the locations of the peaks. 4. Both the number of carbon atoms and the number of hydrogen atoms in a molecule can be ascertained. 5. All of these.

53
Chemically equivalent nuclei always show a single absorption. 1. True 2. False

54
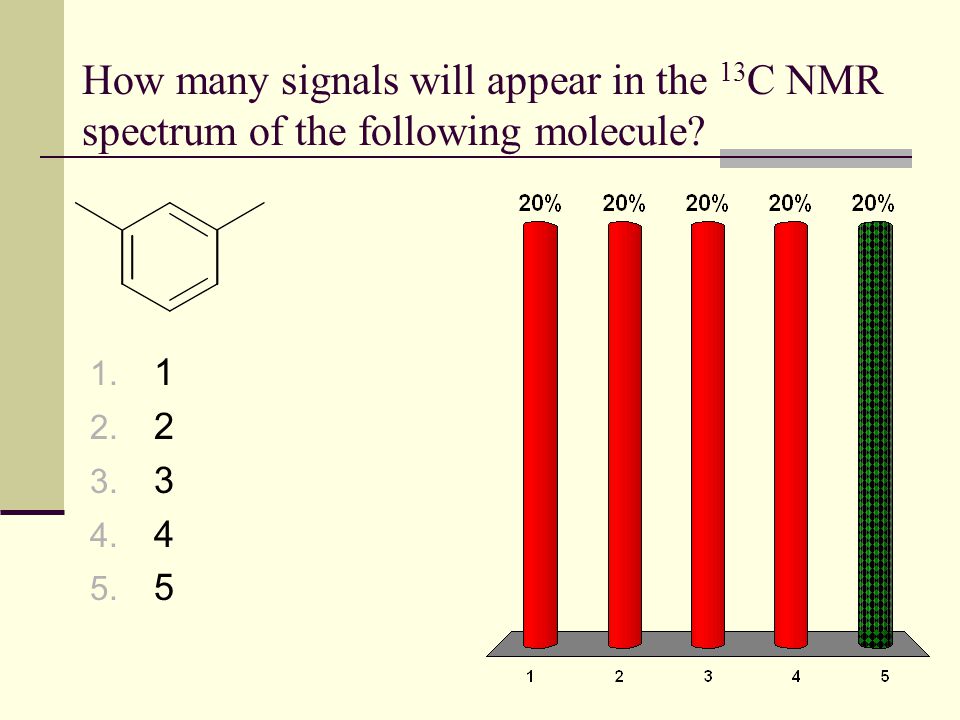
How many signals will appear in the 13 C NMR spectrum of the following molecule? 1. 1 2. 2 3. 3 4. 4 5. 5
55
How many signals will appear in the 13 C NMR spectrum of the following molecule? 1. 3 2. 4 3. 5 4. 6 5. 7

56
Which of the following molecules best fits the following 13 C NMR data? 13 C NMR data: 20, 22, 32, 44, 67 ppm 1. 2. 3.4.

57
What is the relationship between H a and H b in the following compound? 1. chemically unrelated 2. homotopic 3. enantiotopic 4. diastereotopic 5. none of these

58
What is the relationship between H a and H b in the following compound? 1. chemically unrelated 2. homotopic 3. enantiotopic 4. diastereotopic 5. none of these

59
Order the following protons from lowest to highest chemical shift value. 1. H a < H c < H b < H d 2. H a < H c < H d < H b 3. H c < H a < H d < H b 4. H c < H a < H b < H d 5. H c < H d < H a < H b

60
1 H NMR will allow one to distinguish between the following two molecules: 1. True 2. False

61
The painkiller Demerol has the structure shown below. How many peaks would you expect to see in the 13 C NMR spectrum of this substance? 1. 10 2. 11 3. 12 4. 14 5. 15

62
The spectrum shown could represent the molecule in the illustration. 1. True 2. False

63
Which of the following molecules best fits the following NMR spectrum? 1.2. 3.4. 5.

64
Which of the following molecules best fits the following NMR spectrum? 1.2. 3. 4.5.

65
Which of the following molecules best fits the following NMR spectrum? 1.2. 3. 4.5.

66
Which of the following molecules best fits the following NMR spectrum? 1.2. 3. 4. 5.

67
Which of the following molecules best fits the following NMR spectrum? 1.2. 3. 4. 5.

Similar presentations
>")
 NMR Spectroscopy>")


>")

>")


 Spectroscopy>")


>")


