Download presentation
Presentation is loading. Please wait.

1
ICES/NAFO Decadal Symposium 2011, Santander 10-12. May Barents Sea ecosystem: State, climate fluctuations, and human impact E. Johannesen, R. Ingvaldsen, P. Dalpadado, M. Skern-Mauritzen, J. E. Stiansen, E. Eriksen, H. Gjøsæter, B. Bogstad and T. Knutsen Institute of Marine Research, PO Box 1870, 5817 Bergen, Norway

2
Aim: -To assess the state of the Barents Sea ecosystem 2000-2009 in comparison with earlier decades Main biological components ─ Top predators ─ Pelagic fish ─ Zooplankton/benthos ─ Primary production Ecological process External driving forces −fishing −climate And all this in only 20 minutes!

3
North Sea Barents Sea Norwegian Sea Russia Norway Large 1.6 mill km 2 High latitude ~70°-80°N Shelf sea Mean depth 230m The Barents Sea, physical features:

4
The Barents Sea, main species: HADDOCK COPEPODSPOLAR CODSHRIMP OTHER BENTHOS PHYTOPLANKTON

5
External driving forces: Mainly by Russia and Norway Demersal fishery -Mainly cod/haddock -Shrimp, other demersal fish Capelin Harp seals/minke whales Climate: Fishing: Inflow, ice cover, atmospheric conditions => determine the extent and characteristics of main water masses Atlantic water Arctic water Mixed/Frontal water

6
Climate Fishing Demersal fish Pelagic fish Shrimp Zooplankton Below average Missing value ~Long term avera ge Above average Normalized time series BARENTS SEA 1970-2009

7
Our data: OTHER BENTHOS SHRIMPPOLAR CODCOPEPODS HADDOCK PHYTOPLANKTON Fishing Climate

8
The ecosystem state described with PCA on 20 time series High Capelin Biomass Low High Shrimp stock Low LowTemperature High LowHaddock Biomass High HighFishing mortality cod Low Most important factors PC1 Most important factors PC2

9
Development in main species: Demersal fish: 1970’s: High levels 1980’s: Historic low levels 1990’s: Variable 2000’s: Increasing=>cod comparable to 1950’s Pelagic fish: 1970’s: Abundant capelin/Polar cod No herring 1980’s: 1. capelin collapse and recovery Return of herring 1990’s: 2. capelin collapse and recovery 2000’s: 3. capelin collapse /recovery Other pelagics abundant Zooplankton /Shrimp: Strong variability, especially in 1980’s and 1990’s 2000’s: Shrimp/Krill increasing trend

10
Development in external driving forces: 1970’s: High / increasing 1980’s: High on demersal fish High on capelin fishing until collapse 1990’s: Demersals: reduction followed by increase 2000-2009: Decreased on cod => New harvest control rule Fishing:

11
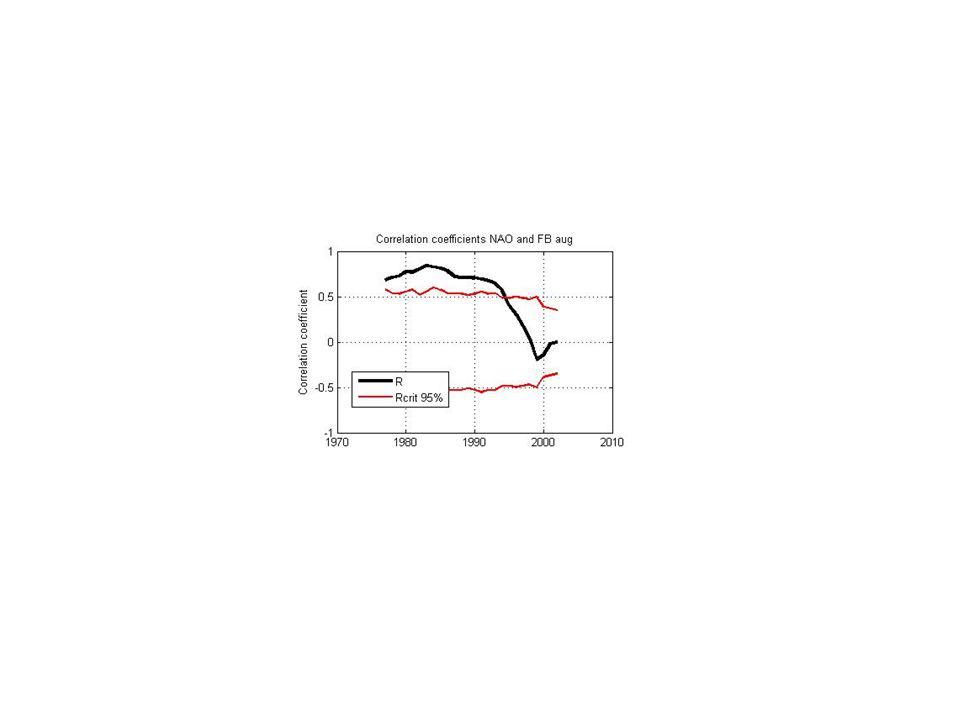
Development in external driving forces: Climate: 1970’s-1990’s Increasing trend Strong variability Variation correlated with NAO Variation correlated across water masses 2000-2009: Warmest on record (since 1900) Increase in mixed water Reduction in Arctic water Correlation with NAO breaks (~1997)
 Increase in mixed water Reduction in Arctic water Correlation with NAO breaks (~1997)")
12
Development in interactions: Demersal fish: Pelagic fish Shrimp Krill Correlations betwen trophic levels by decade

13
Development in interactions: 1970-1979: Demersal fish: Pelagic fish Shrimp Krill POLAR COD 0.6 -0.40.1 0.6 => Mostly positive= bottom up

14
Development in interactions: 1980-1989: Demersal fish: Pelagic fish ShrimpKrill -0.3 -0.2-0.6 0.3 Zooplankton biomass -0.6 Mainly negative: top-down

15
Development in interactions: 1990-1999: Demersal fish: Pelagic fish ShrimpKrill -0.3 -0.2-0.0 -0.9 Zooplankton biomass -0.6 Negative: top-down

16
Development in interactions: 2000-2009: Demersal fish: Pelagic fish ShrimpKrill -0.1 0.50.8 0.1 Zooplankton biomass -0.2 Positive/weak negative: bottom-up

17
Effect of key prey on predators: Development in interaction strength: Weight age 5 ~ log (capelin biomass y-1) ns**** ns => Temperature ns Seperate regressions by decade and species:
 ns**** ns => Temperature ns Seperate regressions by decade and species:")
18
Summary last decade: 2000-2009: Warmest on record Decreasing/low fishing pressure on cod High demersal stocks=> cod stock comparable to the 1950’s Capelin collapse and recovery, other pelagic fish abundant Krill and shrimp increased Trophic forcing changed from top down to mostly bottom-up No clear effect of capelin collapse on predators (e.g. haddock/cod weight) High temperature = high production/biodiveristy of alternative prey? High Temperature=> large feeding area 2006 19961986 Bottom temperatures during the three capelin collapses Pelagics abundance
 High temperature = high production/biodiveristy of alternative prey. High Temperature=> large feeding area Bottom temperatures during the three capelin collapses Pelagics abundance.")
19
Summary: Barents Sea 1970-present: 1970’s High stocks, bottom up regulation 1980’s : Pertubations causing strong variability and top-down control in the1980-90’s Return of herring, collapse of capelin Heavy fishing pressure Cold 2000-2009: Bottom up Weaker interactions/Less effect of capelin on predators ? ? => Return to the 1970’s? Or something not previously observed?

20
Thank you for your attention!

24
Temperature FB Krill /Zooplankton biomass 1970’s na /0.2 1980’s -0.2/-0.5 1970’s -0.7/-0.5 1970’s 0.1/0.4

Similar presentations


>")


 to Future Climate Change>")


