Download presentation
1
Business Siting With Raster GIS Robert Cheetham, Avencia Incorporated

2
Background

3
Objectives Contribute to Job Growth in Philadelphia Adaptable to many types of clients – Retail, Hospitality, Restaurants, Offices, Warehouses Customizable Ability to generate multiple versions of model results Ability to use results to filter available properties Desktop functionality in a browser Simple User Interface

4
Why locate there?

5
Proximity to Transit Lines Why locate there?

6
Proximity to Transit Lines High Density of College Grads Why locate there?

7
Proximity to Transit Lines High Density of College Grads High Density of Home Sales Why locate there?

8
Proximity to Transit Lines High Per Capita Income High Density of College Grads High Density of Home Sales Why locate there?

9
Proximity to Transit Lines High Per Capita Income High Density of College Grads High Density of Home Sales In An Economic Incentive Zone Why locate there?

10
Proximity to Transit Lines High Per Capita Income High Density of College Grads High Density of Home Sales In An Economic Incentive Zone Why locate there?

11
Proximity to Transit Lines High Per Capita Income High Density of College Grads High Density of Home Sales In An Economic Incentive Zone How did you find the site? Business siting is about making a choice based on the composite of several location based decision variables

12
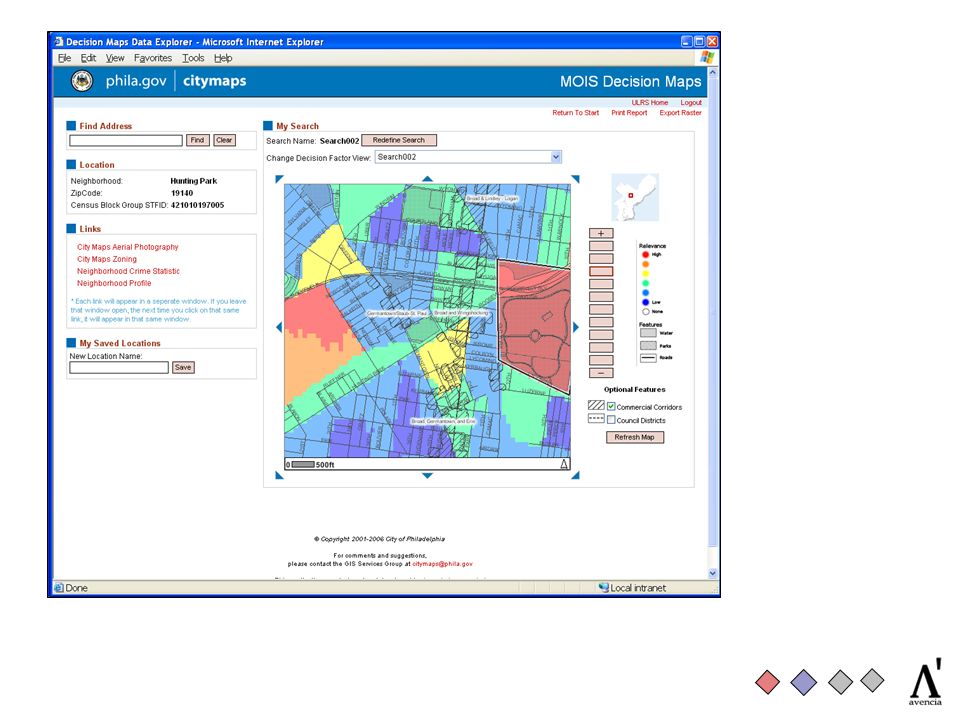
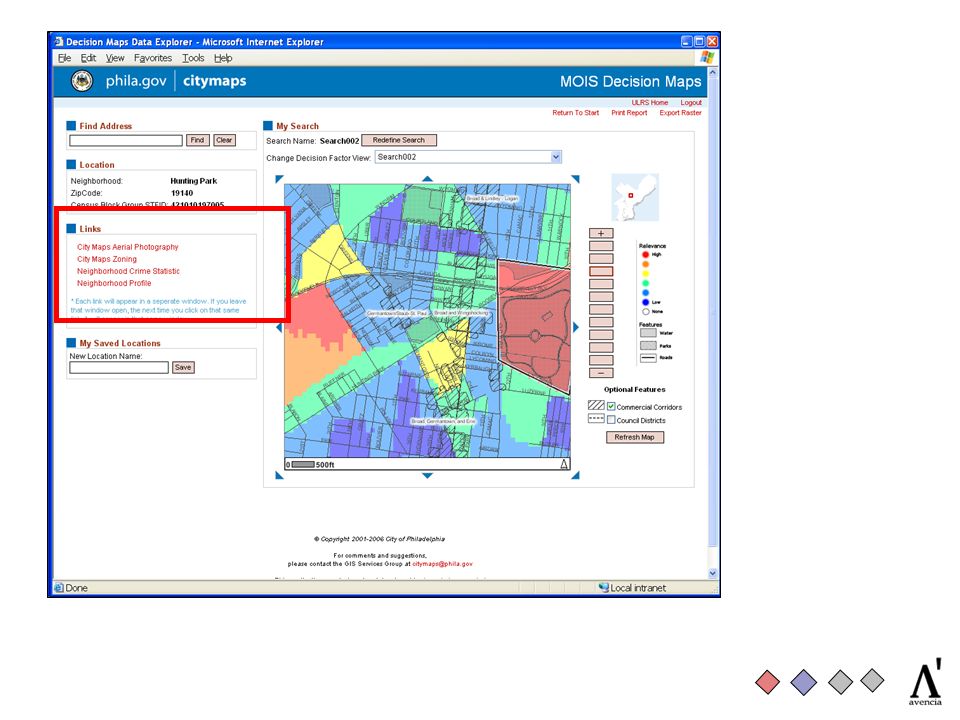
DecisionMaps City of Philadelphia

19
REX Real Estate Metric

26
How does Raster GIS Work?

27
How does it work? City of Philadelphia

28
How does it work? Broken into a grid of cells City of Philadelphia

29
How does it work? City of Philadelphia Broken into a grid of cells Each cell has a value for any given layer of information

30
How does it work? City of Philadelphia Broken into a grid of cells Each cell has a value for any given layer of information

31
How does it work? City of Philadelphia Broken into a grid of cells Each cell has a value for any given layer of information

32
How does it work? City of Philadelphia Broken into a grid of cells Each cell has a value for any given layer of information 1 This cell based approach enables us to combine layers using a process called map algebra

33
Proximity to Transit Lines High Per Capita Income High Density of College Grads High Density of Home Sales In An Economic Incentive Zone Using our example from earlier Business siting is about making a choice based on the composite of several location based decision variables

34
Proximity to Transit Lines High Per Capita Income High Density of College Grads High Density of Home Sales In An Economic Incentive Zone Create a series of raster layers

35
Proximity to Transit Lines High Per Capita Income High Density of College Grads High Density of Home Sales In An Economic Incentive Zone Create a series of raster layers

36
Proximity to Transit Lines High Per Capita Income High Density of College Grads High Density of Home Sales In An Economic Incentive Zone Create a series of raster layers

37
Proximity to Transit Lines High Per Capita Income High Density of College Grads High Density of Home Sales In An Economic Incentive Zone Create a series of raster layers

38
Proximity to Transit Lines High Per Capita Income High Density of College Grads High Density of Home Sales In An Economic Incentive Zone Create a series of raster layers

39
Proximity to Transit Lines High Per Capita Income High Density of College Grads High Density of Home Sales In An Economic Incentive Zone Assign weights to raster layers x 2 x 4 x 5 x 2 x -2

40
Proximity to Transit Lines High Per Capita Income High Density of College Grads High Density of Home Sales In An Economic Incentive Zone Assign weights to raster layers x 2 x 4 x 5 x 2 x -2 + Output Decision Raster

41
Derive Output Raster Proximity to Transit Lines x 2 High Per Capita Income x 2 Density of College Grads x 4 Density of Home Sales x 5 Economic Incentive Zone -2

43
What Weve Learned Early client feedback paid off downloads integration with other efforts Example of what can be accomplished once a server-based GIS infrastructure is in place Web services saved a lot of time on basics Decision-making processes are often fuzzy and we need map processes that accommodate this ArcGIS Server has been a powerful platform on which to develop some sophisticated functionality

44
Next Steps Demographic/Segmentation Reporting – (Business Analyst Online) Public web deployment Integration with commercial real estate listings service Encapsulation of basic process into a web service for integration into departmental applications – school siting
 Public web deployment Integration with commercial real estate listings service Encapsulation of basic process into a web service for integration into departmental applications – school siting")
45
Business Siting With Raster GIS Robert Cheetham, Avencia Incorporated www.avencia.com, cheetham@avencia.com


 CAP Implementation Workshop Geneva, 6-7 April 2011 Clive Reece>")


