Download presentation
Presentation is loading. Please wait.

1
Spiders on Mazurian lake islands: Wigry –Mikołajki, Nidzkie, Bełdany) Analysis of variance Photo: Wigierski Park Narodowe Photo: Ruciane.net Araneus diadematus Salticidae Photo: Eurospiders.com
 Analysis of variance Photo: Wigierski Park Narodowe Photo: Ruciane.net Araneus diadematus Salticidae Photo: Eurospiders.com")
2
Spider species richness on Mazurian lake islands Does species richness differ with respect to the degree of disturbance? If we use the same test several times with the same data we have to apply a Bonferroni correction. Single test n independent tests

3
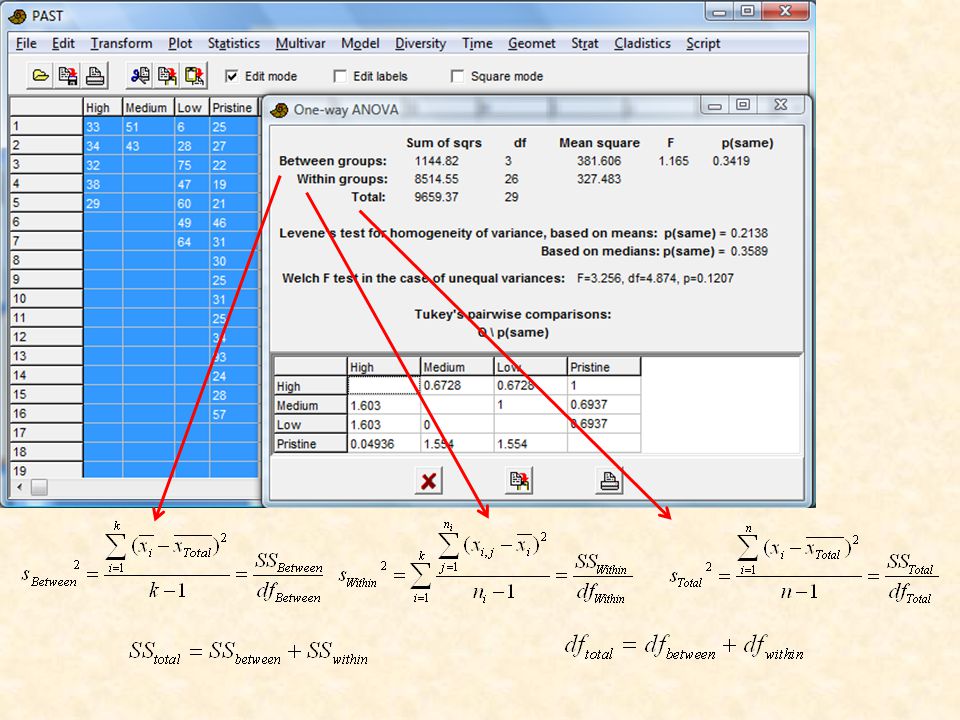
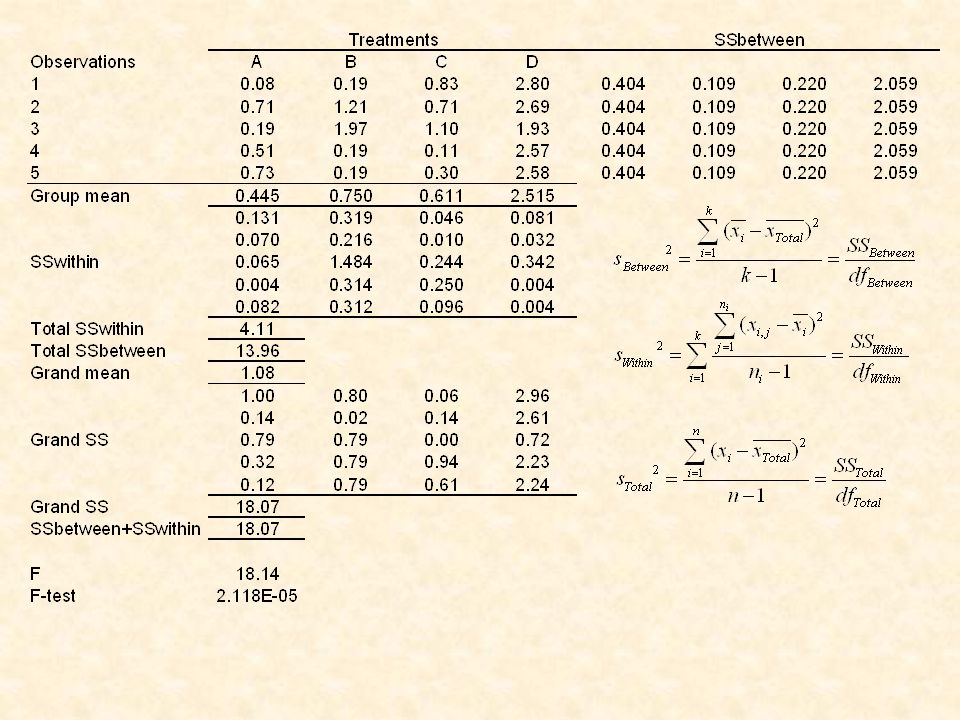
Spider species richness on Mazurian lake islands sH2sH2 sM2sM2 sL2sL2 sP2sP2 sT2sT2 If there would be no difference between the sites the average within variance s Within 2 should equal the variance between the sites s Between 2. One way analysis of variance Sir Ronald Aylmer Fisher (1890-1962) s Between 2 We test for significance using the F-test of Fisher with k-1 (Between) and n-k (Within) degrees of freedom. n-1 = n-k + k-1 df Total df Within df Between
 s Between 2 We test for significance using the F-test of Fisher with k-1 (Between) and n-k (Within) degrees of freedom. n-1 = n-k + k-1 df Total df Within df Between.")
5
Welch test The Levene test compares the group variances using the F distribution. Variances shouldn’t differ too much (shouldn’t be heteroskedastic)!!! The Tuckey test compares simultaneously the means of all combinations of groups. It’s a t-test corrected for multiple comparisons (similar to a Bonferroni correction)
!!. The Tuckey test compares simultaneously the means of all combinations of groups. It’s a t-test corrected for multiple comparisons (similar to a Bonferroni correction).")
7
We include the effect of island complex (Wigry – Nidzkie, Bełdany, Mikołaiki) There must be at least two data for each combination of groups. We use a simple two way ANOVA Main effectsSecondary effects

8
The significance levels have to be divided by the number of tests (Bonferroni correction) Spider species richness does not significantly depend on island complex and degree of disturbance.
 Spider species richness does not significantly depend on island complex and degree of disturbance.")
9
Correcting for covariates: Anaysis of covariance Instead of using the raw data we use the residuals. These are the area corrected species numbers. The conmparison of within group residuals and between group residuals gives our F-statistic.

10
Disturbance does not significantly influence area corrected species richness SS total = SS between + SS error Within group residuals Total residuals We need four regression equations: one from all data points and three within groups.

11
Repetitive designs In medical research we test patients before and after medical treatment to infer the influence of the therapy. We have to divide the total variance (SS total ) in a part that contains the variance between patients (SS between ) and within the patient (SS within ). The latter can be divided in a part that comes from the treatment (SStreat) and the error (SS error ) Medical treatment Before After SS within SS between
 in a part that contains the variance between patients (SS between ) and within the patient (SS within ). The latter can be divided in a part that comes from the treatment (SStreat) and the error (SS error ) Medical treatment Before After SS within SS between.")
12
Before – after analysis in environmental protection In the case of unequal variances between groups it is save to use the conservative ANOVA with (n-1) df error and only one df Effect in the final F-test. df treat = k-1 df Error = (n-1)(k-1)
(k-1).")
13
Bivariate comparisons in environmental protection The outlier would disturb direct comparisons of species richness Due to possible differences in island areas between the two island complexes we have to use the residuals. A direct t-test on raw data would be erroneous.

14
Permutation testing Observed P(t) Upper 2.5% confidence limit. 10000 randomizations of observed values gives a null distribution of t-values and associated probability levels with which we compare the observed t. This gives the probability level for our t-test.

15
Bivariate comparisons using ANOVA t and F tests can both be used for pair wise comparisons.

16
Repeated measures Species richness of ground living Hymenoptera in a beech forest Photo Tim Murray Photo Simon van Noort

17
Advices for using ANOVA: You need a specific hypothesis about your variables. In particular, designs with more than one predicator level (multifactorial designs) have to be stated clearly. ANOVA is a hypothesis testing method. Pattern seeking will in many cases lead to erroneous results. Predicator variables should really measure different things, they should not correlate too highly with each other The general assumptions of the GLM should be fulfilled. In particular predicators should be additive. The distribution of errors should be normal. It is often better to use log-transformed values In monofactorial designs where only one predicator variable is tested it is often preferable to use the non-parametric alternatives to ANOVA, the Kruskal Wallis test. The latter test does not rely on the GLM assumptions but is nearly as powerful as the classical ANOVA. Another non-parametric alternative for multifactorial designs is to use ranked dependent variables. You loose information but become less dependent on the GLM assumptions. ANOVA as the simplest multivariate technique is quite robust against violations of its assumptions.
 have to be stated clearly. ANOVA is a hypothesis testing method. Pattern seeking will in many cases lead to erroneous results. Predicator variables should really measure different things, they should not correlate too highly with each other The general assumptions of the GLM should be fulfilled. In particular predicators should be additive. The distribution of errors should be normal. It is often better to use log-transformed values In monofactorial designs where only one predicator variable is tested it is often preferable to use the non-parametric alternatives to ANOVA, the Kruskal Wallis test. The latter test does not rely on the GLM assumptions but is nearly as powerful as the classical ANOVA. Another non-parametric alternative for multifactorial designs is to use ranked dependent variables. You loose information but become less dependent on the GLM assumptions. ANOVA as the simplest multivariate technique is quite robust against violations of its assumptions..")
18
Starting hyotheses The degree of disturbance (human impact) influences species richenss. Species richness and abundance depends on island area and environmental factors. Island ensembles differ in species richness and abundance. Area, abundance, and species richness are non-linearly related. Latitude and longitude do not influence species richness. Sorting Area, abundance, and species richness are non- linearly related. Latitude and longitude do not influence species richness. Species richness and abundance depends on island area and environmental factors. Island ensembles differ in species richness and abundance. The degree of disturbance (human impact) influences species richenss. The hypotheses are not independent. Each hypothesis influences the way how to treat the next.
 influences species richenss. The hypotheses are not independent. Each hypothesis influences the way how to treat the next..")
19
Area, abundance, and species richness are non-linearly related. Species – area and individuals area relationships

20
Latitude and longitude do not influence species richness. Is species richness correlated with longitude and latitude? Does the distance between islands influence species richness? Are geographically near islands also similar in species richness irrespective of island area? R(S-Long) = 0.22 n.s. R(S-Lat) = 0.28 n.s.) That there is no significant correlation does not mean that latitude and longitude do not have an influence on the regression model with environmental variables. Spatial autocorrelation S1 S3 S5S6 S2 S4 In spatial autocorrelation the distance between study sites influence the response (dependent) variable. Spatialy adjacent sites are then expected to be more similar with respect to the response variable.
 = 0.22 n.s. R(S-Lat) = 0.28 n.s.) That there is no significant correlation does not mean that latitude and longitude do not have an influence on the regression model with environmental variables. Spatial autocorrelation S1 S3 S5S6 S2 S4 In spatial autocorrelation the distance between study sites influence the response (dependent) variable. Spatialy adjacent sites are then expected to be more similar with respect to the response variable..")
21
Moran’s I as a measure of spatial autocorrelation Moran’s I is similar to a correlation coefficient all applied to pairwise cells of a spatial matrix. It differs by weighting the covariance to account for spatial non-independence of cells with respect to distance. If cell values were randomly distributed (not spatially autocorrelated) the expected I is Statistical significance is calculated from a Monte Carlo simulation S1 S3 S5S6 S2 S4 All combinations of sites
 the expected I is Statistical significance is calculated from a Monte Carlo simulation S1 S3 S5S6 S2 S4 All combinations of sites.")
22
Individuals/trap is slightly spatially autocorrelated Latitude and longitude slightly influence species richenss. Even this weak effect might influence the outcome of a regression analysis.

23
High multicollinearity Solution: prior factor analysis to reduce the number of dependent variables Too many variables!!

24
Stepwise variable elimination Standardized coefficients ( -values) are equivalents of correlation coefficients. They should have values above 1. Such values point to too high correlation between the predictor variables (collinearity). Collnearity disturbs any regression model and has to be eliminated prior to analysis. Highly correlated variables essentially contain the same information. Correlations of less than 0.7 can be tolerated. Hence check first the matrix of correlation coefficients. Eliminate variables that do not add information.
. Collnearity disturbs any regression model and has to be eliminated prior to analysis. Highly correlated variables essentially contain the same information. Correlations of less than 0.7 can be tolerated. Hence check first the matrix of correlation coefficients. Eliminate variables that do not add information..")
25
The final model after stepwise variable elimination Simple test wise probability levels. We yet have to correct for multiple testing. Bonferroni correction To get an experiment wise error rate of 0.05 our test wise error rates have be less than 0.05/n The best model is not always the one with the lowest AIC or the highest R 2. Species richness is positively correlated with island area and negatively with soil humidity.

26
Island ensembles differ in species richness and abundance. Analysis of covariance (ANCOVA) Species richness depends on environmental factors that may differ between island ensembles. A simple ANOVA does not detect any difference
 Species richness depends on environmental factors that may differ between island ensembles. A simple ANOVA does not detect any difference.")
27
Analysis of covariance (ANCOVA) ANCOVA is the combination of multiple regression and analysis of variance. First we perform a regression anlyis and use the residuals of the full model as entries in the ANOVA. ANCOVA is the ANOVA on regression residuals. We use the regression residuals for further analysis The metrically scaled variables serve as covariates. Sites with very high positive residuals are particularly species rich even after controlling for environmental factors. These are ecological hot spots. Regression analysis serves to identify such hot spots

28
ANCOVA Species richness does not differ between island ensembles.

29
The degree of disturbance (human impact) influences species richenss. Species richness of spiders on lake islands appears to be independent of the degree of disturbance

30
How does abundance depend on environmental fatcors? The full model and stepwise variable elimination Most coefficients are highly significant! Standardized coefficients are above 1. This points to too high collinearity We furthr eliminate uninformative variables. Abundance does not significally depend on environmental variables

31
How does abundance depend on the degree of disturbance? Abundance of spiders on lake islands appears to be independent of the degree of disturbance

32
Literature

Similar presentations


. Introduction Multiple regression is an extension of bivariate regression to take into account more than.>")


 Lecture 2 Analysis of variance Photo: Wigierski Park Narodowe Photo: Ruciane.net.>")

