Download presentation
Presentation is loading. Please wait.

1
County Health Rankings: Why do we all want to be above average? Julie Willems Van Dijk RN PhD University of Wisconsin Population Health Institute Gianfranco Pezzino Senior Fellow, Kansas Health Institute

2
Today… The County Health Rankings Population Health Model County Health Rankings—WHY? What is MATCH? Using the Rankings Are Rankings a QI Tool? Real Life Experience Discussion

3
Who?

5
Rankings are everywhere

6
Our Logic Model

8
Programs and Policies

9
Health Factors Programs and Policies

10
Health Factors Programs and Policies Health Outcomes

11
Programs and Policies

12
Health Factors

13
Programs and Policies Health Factors Health Outcomes

14
Physical environment Social and economic factors Health behaviors Clinical care Health Factors Programs and Policies Health Outcomes

15
Health Factors Programs and Policies Health Outcomes Physical environment (10%) Social & economic factors (40%) Health behaviors (30%) Clinical care (20%)
 Social & economic factors (40%) Health behaviors (30%) Clinical care (20%)")
16
Health Factors Programs and Policies Health Outcomes Physical environment (10%) Social & economic factors (40%) Health behaviors (30%) Clinical care (20%) Mortality (length of life): 50% Morbidity (quality of life): 50%
 Social & economic factors (40%) Health behaviors (30%) Clinical care (20%) Mortality (length of life): 50% Morbidity (quality of life): 50%")
17
Community safety Education Family & social support Employment Built environment Environmental quality Income Unsafe sex Alcohol use Diet & exercise Tobacco use Access to care Quality of care Physical environment (10%) Social & economic factors (40%) Health behaviors (30%) Clinical care (20%) Health Factors Programs and Policies Health Outcomes Mortality (length of life): 50% Morbidity (quality of life): 50% County Health Rankings model © 2010 UWPHI
 Social & economic factors (40%) Health behaviors (30%) Clinical care (20%) Health Factors Programs and Policies Health Outcomes Mortality (length of life): 50% Morbidity (quality of life): 50% County Health Rankings model © 2010 UWPHI")
20
Why County Health Rankings? Where we live matters to our health & there are great disparities between communities; And, health depends on many different factors. It’s more than medical care; Therefore, health is everybody’s business; So, we all need to work together to find solutions. Yet, there is relatively little attention in the public or among policy makers to the above points

21
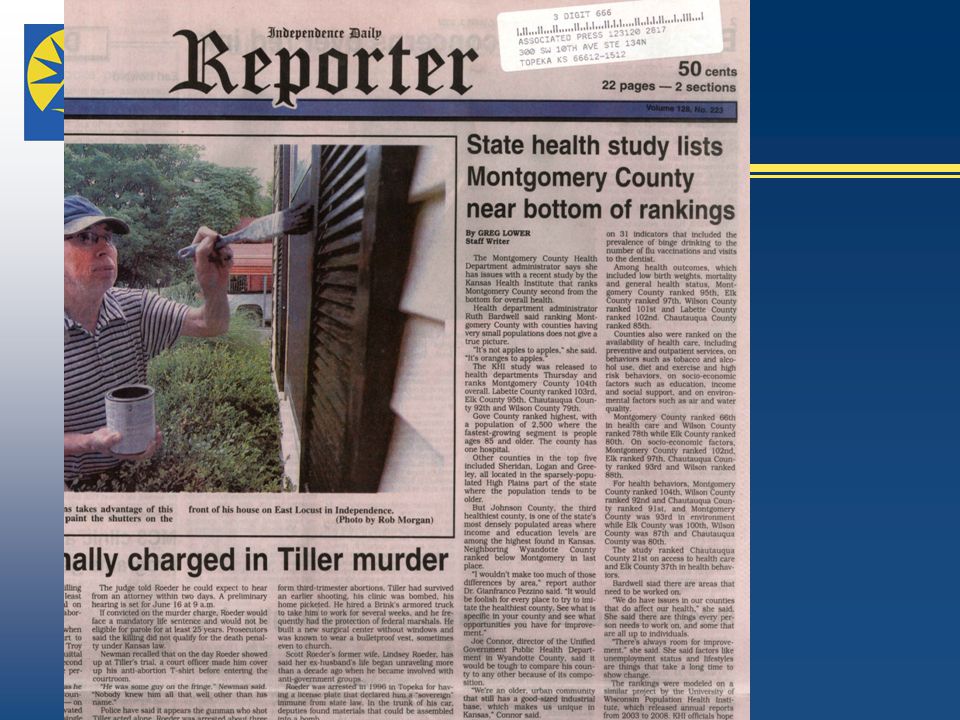
Getting Attention…..

22
Why rank? Easy to understand one’s rank Draws attention to all the factors that affect community health Draws more people into discussions about how to improve health:

23
MATCH Mobilize Action Toward Community Health

24
Mobilize through County Health Rankings Physical environment Social and economic factors Health behaviors Clinical care Health Factors Programs and Policies Health Outcomes

25
Action depends on stage of readiness in the county

26
Toward Community Health by setting goals and monitoring progress over time Setting goals and objectives for overall health Keeping track of progress

27
MobilizingActionToward Community Health through County Health Rankings Setting goals and objectives for overall health Keeping track of progress

28
Juneau County Experience

29
Mobilizing… After the release of this article in the Juneau County Star Times, a meeting was held in the Juneau County courtroom. People from across the community came to learn about the Rankings and then began to discuss ways to improve Juneau County’s health.

30
A broad coalition of partners requested and won a grant from a statewide foundation, worked on a community health needs assessment, and looked for evidence on what works …Action…

31
…Toward Community Health Juneau County now has a plan to address: parenting, health literacy, and health care access

32
Ways to Use the Rankings Raising awareness about the multiple determinants of health via media interviews and follow-up conversations Initiating community health assessment and planning efforts where none previously existed Celebrating successes and reinvigorating existing community health improvement efforts

33
Ways to Use the Rankings (cont.) Informing policy makers and community leaders about the multiple determinants of health and community health improvement planning Citing the County Health Rankings as justification in securing grant funding to conduct community health improvement efforts and/or to address the determinants of health As a tool or as input for QI???
 Informing policy makers and community leaders about the multiple determinants of health and community health improvement planning Citing the County Health Rankings as justification in securing grant funding to conduct community health improvement efforts and/or to address the determinants of health As a tool or as input for QI")
34
Limitations of County Health Rankings as a QI Tool Although QI is system-based, in practice it generally focuses on programs, agencies or organizations—Rankings focus on whole communities Multiple years of data for individual measures limits ability to compare trends Just like report cards, the components we rank may change from year to year Relative nature of Rankings means true improvement may not result in improvement in rank

35
How Rankings Can be Used in QI To draw attention for the need for improvement To focus organizational QI efforts To raise awareness in a community that QI is needed To shift our focus from small QI (program level) to big QI (organizational level) to BIG QI (community level)
 to big QI (organizational level) to BIG QI (community level)")
36
Acknowledgements Robert Wood Johnson Foundation Our communications partners (Burness et al) Patrick Remington, David Kindig and Bridget Booske Other UWPHI colleagues, past and present (Peppard, Rohan, Vila, Athens, et al) University of Wisconsin School of Medicine and Public Health Wisconsin Division of Public Health
 Patrick Remington, David Kindig and Bridget Booske Other UWPHI colleagues, past and present (Peppard, Rohan, Vila, Athens, et al) University of Wisconsin School of Medicine and Public Health Wisconsin Division of Public Health")
37
County Health Rankings: An Example in Action Gianfranco Pezzino, M.D., M.P.H. Senior Fellow Kansas Health Institute

38
Why ranking Allows comparisons Easy to understand: Summarizes and translates PH info non- technical audience Stimulates discussion, debate about health disparities, differences Learn from each other how to achieve best possible level of population health

39
This is not Rocket Science… A.K.A. there is more than one way to skin a cat As demonstrated by the differences between MATCH and the Kansas report

40
KS and MATCH Report Comparison KS used three Major Rankings: Health Outcomes Health Determinants Overall Health Index Some indicators are different Some weights are different As a result, ranking will probably be (slightly?) different
 different")
41
Kansas Health Model and Indicators

42
Community safety Education Family & social support Employment Built environment Environmental quality Income Unsafe sex Alcohol use Diet & exercise Tobacco use Access to care Quality of care Physical environment (10%) Social & economic factors (40%) Health behaviors (30%) Clinical care (20%) Health Factors Programs and Policies Health Outcomes Mortality (length of life): 50% Morbidity (quality of life): 50% County Health Rankings model © 2010 UWPHI MATCH Logic Model and Indicators (4 measures of morbidity)
 Social & economic factors (40%) Health behaviors (30%) Clinical care (20%) Health Factors Programs and Policies Health Outcomes Mortality (length of life): 50% Morbidity (quality of life): 50% County Health Rankings model © 2010 UWPHI MATCH Logic Model and Indicators (4 measures of morbidity)")
43
Weights (original slides from 6-2009) Based on best evidence, but somewhat arbitrary
 Based on best evidence, but somewhat arbitrary")
44
Kansas Health Model and Indicators

45
Community safety Education Family & social support Employment Built environment Environmental quality Income Unsafe sex Alcohol use Diet & exercise Tobacco use Access to care Quality of care Physical environment (10%) Social & economic factors (40%) Health behaviors (30%) Clinical care (20%) Health Factors Programs and Policies Health Outcomes Mortality (length of life): 50% Morbidity (quality of life): 50% County Health Rankings model © 2010 UWPHI MATCH Logic Model and Indicators
 Social & economic factors (40%) Health behaviors (30%) Clinical care (20%) Health Factors Programs and Policies Health Outcomes Mortality (length of life): 50% Morbidity (quality of life): 50% County Health Rankings model © 2010 UWPHI MATCH Logic Model and Indicators")
46
Limitations of County Health Rankings First, you need to “believe” in the logic model if not, it is easy to find design “flaws” and dismiss report Second, you need to understand what these numbers DO and do NOT mean if not, you will abuse and misuse the data Some limitations are unavoidable given the study design

47
Some of the Limitations Small counts for some counties Appropriate indicators Environmental indicators particularly limited Within-county variability (disparities) is NOT measured Single measures less meaningful than overall trends and indexes
 is NOT measured Single measures less meaningful than overall trends and indexes")
48
Small Counts Acceptable sample size depends on source of data KDHE: no vital events with < 6 counts are reported (confidentiality concerns) CDC: no BRFSS reporting if N < 50 Multiple years collapsed (up to 6) When count is insufficient: Values are not shown in any of the tables Values are included in the calculation of the ranking
 CDC: no BRFSS reporting if N < 50 Multiple years collapsed (up to 6) When count is insufficient: Values are not shown in any of the tables Values are included in the calculation of the ranking")
49
Number of “Reportable” Indicators in KS 31 Indicators26 counties 20 to 30 Indicators69 counties < 20 Indicators10 counties Smallest number of Indicators = 152 counties

50
How to account for what is NOT measured Our model (KS) explains about half of the variability among counties Some areas difficult to measure Environment and health effects (lag time) “Social capital”, intangible assets “Not everything that counts is counted…”
 explains about half of the variability among counties Some areas difficult to measure Environment and health effects (lag time) Social capital , intangible assets Not everything that counts is counted…")
51
Other Things that Rankings can NOT do Show progress towards objective Information is only relative to other units in the ranking Show distance between the best and worst performers “When everybody is close to the average”, ranking position is less informative

52
Rankings and Quality Improvement Indirect linkage? Top performers can help disseminate best practices (used in Q.I.) Q.I. implies that indicators are measured and ideal status (i.e., goals, standards, etc.) is identified Implicit comparisons Rankings are all based on comparisons
 Q.I. implies that indicators are measured and ideal status (i.e., goals, standards, etc.) is identified Implicit comparisons Rankings are all based on comparisons.")
53
A report was published on June 1, 2009

55
Media coverage* 15 printed newspapers 7 online news services 5 broadcast outlets * (as of June 12, 2009)
")
59
How Can we Use it? 1. Raise awareness of link between health outcomes and determinants Policy makers, media, public, advocacy groups, …… “Health Impact statements” 2. Community action and mobilization Community Health assessments Community Health Improvement Plans

62
“This has been the reality for the past 100 years. We are doing a better job at capturing it with quantifiable data.” Administrator, Community Health Center of South East Kansas

63
“We ourselves have to hear these statistics. The more we hear it, the more we are reminded about that, the more change will happen.” Administrator, Community Health Center of South East Kansas

64
Wyandotte County

65
The Reaction of the “Last one” Meeting with mayor, city officers, county state delegations, KHI Developed two-prong strategy: Inform county and state policy makers Initiate a community engagement process focused on teens in neighborhood and school settings Engagement of community health partners slow Funding is an issue for a non-categorical project

66
Conclusions Be ready! The “no surprise” rule applies Study results for your jurisdiction before release Be prepared to answer the most uncomfortable questions Stress what a ranking can and cannot do

67
Conclusions, Ctd. Be proactive Be a driver, not a passenger Involve stakeholders before the release

68
Kansas Health Institute Healthier Kansans through informed decisions

69
DISCUSSION Learn more at www.countyhealthrankings.org Questions? Contact us at match-info@match.wisc.edu

Similar presentations


![The Washoe County ACHIEVE Community (2010 – 2011) Local policies and the physical environment [they create] influence daily choices that affect our health.](/1/228178/big_thumb.jpg "The Washoe County ACHIEVE Community (2010 – 2011) Local policies and the physical environment [they create] influence daily choices that affect our health.>")


