Download presentation
Presentation is loading. Please wait.

1
It Keeps getting better!
Using School-wide Data for Continuous Quality Improvement Kelsey R. Morris, EdD—University of Oregon Nadia K. Sampson, MA—University of Oregon Session C13

2
Session Overview Goal Value of data-based decision making
Nexus of data-based decision making and SWPBIS Cycle of continuous quality improvement Student Outcomes Implementation Fidelity Goal Craft precise problem statements Craft solution-based action plans Engage in continuous quality improvement

3
Maximizing Your Session Participation
Where are you in your implementation of the concepts presented? Exploration & Adoption Installation Initial Implementation Full Implementation What do you hope to learn? What new learning do you take away from the session? What will you do with your new learning?

4
Data Collection & Analysis
Data are “the numerical results of measuring some quantifiable aspect of behavior” (Mayer, Sulzer-Azaroff, & Wallace, 2012, p. 130). Data collection involves: Observation of a behavior Notation of the behavior characteristics and context Data analysis involves: Converting numerical results into graphs Using graphed results for instructional decision making
. Data collection involves: Observation of a behavior. Notation of the behavior characteristics and context. Data analysis involves: Converting numerical results into graphs. Using graphed results for instructional decision making.")
5
Value and Utility of Data
Valued Outcomes Repeatedly giving people the right information, at the right time, in the right format is the single most effective way to improve decision making and achieve valued outcomes (Gilbert, 1978). Data Practices Systems In SWPBIS, the overall goal is to make educational facilities more effective learning environments.
. Data. Practices. Systems. In SWPBIS, the overall goal is to make educational facilities more effective learning environments.")
6
Performance Gap & Cause Analysis
Current Reality Valued Outcomes Environment/System 1—Information Clear expectations Timely, specific feedback 2—Resources Materials, tools Time Processes 3—Incentives Financial & non-financial encouragement Individual Persons 6—Knowledge Requisite knowledge and skill base 5—Capacity Ability to learn and do 4—Motives Desire to work and excel Gilbert’s Behavior Engineering Model (BEM) provides a way to systematically identify barriers to organizational and individual performance. Gilbert’s Behavior Engineering Model (BEM) is an efficient method for troubleshooting performance and discovering the most important opportunities for improvement. Cause analysis does not tell us what to do to correct problems, but does give a framework to discover the cause of problems.
 provides a way to systematically identify barriers to organizational and individual performance. Gilbert’s Behavior Engineering Model (BEM) is an efficient method for troubleshooting performance and discovering the most important opportunities for improvement. Cause analysis does not tell us what to do to correct problems, but does give a framework to discover the cause of problems.")
7
Data-based Decision Making
Effective teams use data to document progress and outcomes, guide decisions, and inform stakeholders (Boudett, City, & Murnane, 2006; Burke, 2010; Deno, 2005; Hill 2010; Newton, Algozzine, Algozzine, Horner, & Todd, 2011; Newton, Horner, Algozzine, Todd, & Algozzine, 2009; Pidgeon & Gregory, 2004; Renfro & Grieshaber, 2009) A critical predictor of sustained implementation of SWPBIS (Coffey & Horner, 2012; McIntosh et al., 2013) Fidelity and student outcome data are essential (Fixsen, Blase, Metz, & Van Dyke, 2013) Continues to be a struggle for schools (Dunn, Airola, Lo, & Garrison, 2013; Schildkamp, Ehren, & Lai, 2012; Telzrow, McNamara, & Hollinger, 2000) Advances in computer technology could provide efficient means for data management (Wayman, 2005)
 A critical predictor of sustained implementation of SWPBIS (Coffey & Horner, 2012; McIntosh et al., 2013) Fidelity and student outcome data are essential (Fixsen, Blase, Metz, & Van Dyke, 2013) Continues to be a struggle for schools (Dunn, Airola, Lo, & Garrison, 2013; Schildkamp, Ehren, & Lai, 2012; Telzrow, McNamara, & Hollinger, 2000) Advances in computer technology could provide efficient means for data management (Wayman, 2005)")
8
Components of SWPBIS Defined Behavior Expectations
Teaching of Behavior Expectations Acknowledgment Systems Consequence Systems Evaluation

9
Evaluation of Effectiveness
Essential Question Is the student successful with this level of support? Intensity is a two-way street. Improved student outcomes are the result of continually monitoring and modifying (as needed) instruction, interventions, and supports. Goal: Increase prosocial behavior and enhance quality of life The information we gain from data collection and analysis enables us to develop and evaluate effectiveness of interventions and modify them if necessary. Ultimately, our goal in collecting data is to increase prosocial behavior and enhance the focus person’s quality of life.
 instruction, interventions, and supports. Goal: Increase prosocial behavior and enhance quality of life. The information we gain from data collection and analysis enables us to develop and evaluate effectiveness of interventions and modify them if necessary. Ultimately, our goal in collecting data is to increase prosocial behavior and enhance the focus person’s quality of life.")
10
Continuous Quality Improvement
Plan Implement Evaluate

11
Adult Behaviors Cause Student Change
Outcomes Fidelity

12
School-wide Behavior Data
Critical Questions How often are problem behaviors occurring? When are problem behaviors frequently occurring? Where are problem behaviors frequently occurring? What problem behaviors are frequently occurring? Who is frequently engaging in problem behaviors?

13
School-wide Behavior Data
September = rate of 3.50 average referrals/day/month October = rate of 4.53 average referrals/day/month Spikes at 9:45 AM and 1:00 PM – 2:30 PM Top 3 non-classroom locations = bathroom, playground, & hallway

14
School-wide Behavior Data
Tuesday and Wednesday are the school days with the highest frequency. Top 3 Problem Behaviors = inappropriate language, defiance, disruption 5th & 8th grades have the highest frequency 25 students have more than 1 referral

15
Problem Solving with Precision
The statement of a problem is important for team-based problem solving. Everyone must be working on the same problem with the same assumptions. Problems are often framed in the “primary” form. Raises awareness Not useful for problem solving Precise problem statements result from a detailed data review and are solvable.

16
Problem Solving with Precision
Primary Statements Precision Statement There are too many referrals Gang behavior is increasing The cafeteria is out of control Student disrespect is a big problem There are more ODRs for aggression on the playground than last month. These are most likely to occur during first recess, with a large number of students, and the aggression is related to getting access to the new playground equipment.

17
Problem Solving with Precision
There are more ODRs for aggression on the playground than last month. These are most likely to occur during first recess, with a large number of students, and the aggression is related to getting access to the new playground equipment. What? Where? When? Who? Why? Aggression Playground 1st Recess Large number of students To get new playground equipment

18
Data Analysis for Precision
Location Problem Behavior Time of Day Persons Involved Motivation Precise Problem Statement

19
Continuous Quality Improvement
Plan Implement Evaluate

20
Solution Development & Action Planning
Essential Elements Explanation 1. Prevention How can we avoid the problem context? Who? What? When? Where? 2. Teaching How can we define, teach, and monitor what we want? Teach appropriate behavior, use problem behavior as the non-example 3. Recognition How can we build in systematic acknowledgment/rewards for positive behavior? 4. Extinction How can we prevent the problem behavior from continuing to pay off? (tied to motivation/function of behavior) 5. Consequences What are efficient, consistent consequences for problem behavior? 6. Evaluation How will we collect and use data to evaluate our fidelity and outcomes?
 5. Consequences. What are efficient, consistent consequences for problem behavior 6. Evaluation. How will we collect and use data to evaluate our fidelity and outcomes")
21
Solution Development & Action Planning
Remember to include the precise problem statement as well as a statement of the goal.

22
Continuous Quality Improvement
Plan Implement Evaluate

24
SWIS was installed for data collection and analysis
Evaluation— SWIS was installed for data collection and analysis

25
Riverbend Action Planning
TFI “subgroup” completed the TFI and developed goals and action items for subcommittees Subcommittees for: 1.3 & 1.4 Behavioral Expectations & Teaching Expectations 1.6 Discipline Policies 1.9 Feedback & Acknowledgement 1.11 Student/Family/Community Involvement TFI “subgroup” members led subcommittee work Communication Recruiting workers Setting meetings

26
Riverbend Action Planning
Behavioral Expectations Established school-wide behavior matrix Drafted lesson plans Designed and ordered signage Discipline Policies Established a response to problem behavior flowchart Established a student-friendly flowchart Developed training on referral form completion and problem behavior definitions Feedback & Acknowledgement Established a system for how an individual’s acknowledgement benefits the group (e.g., Party in a Bucket) Created signage to advertise the acknowledgement system Established language to be used by all staff when delivering acknowledgement Student/Family/Community Involvement Established calendars that can be distributed to all families; each month of the calendar highlights a different PBIS component Developed a survey to garner community feedback Subcommittees prepared minute rollout trainings for all staff
 Created signage to advertise the acknowledgement system. Established language to be used by all staff when delivering acknowledgement. Student/Family/Community Involvement. Established calendars that can be distributed to all families; each month of the calendar highlights a different PBIS component. Developed a survey to garner community feedback. Subcommittees prepared minute rollout trainings for all staff.")
30
SWIS was installed for data collection and analysis
Evaluation— SWIS was installed for data collection and analysis

31
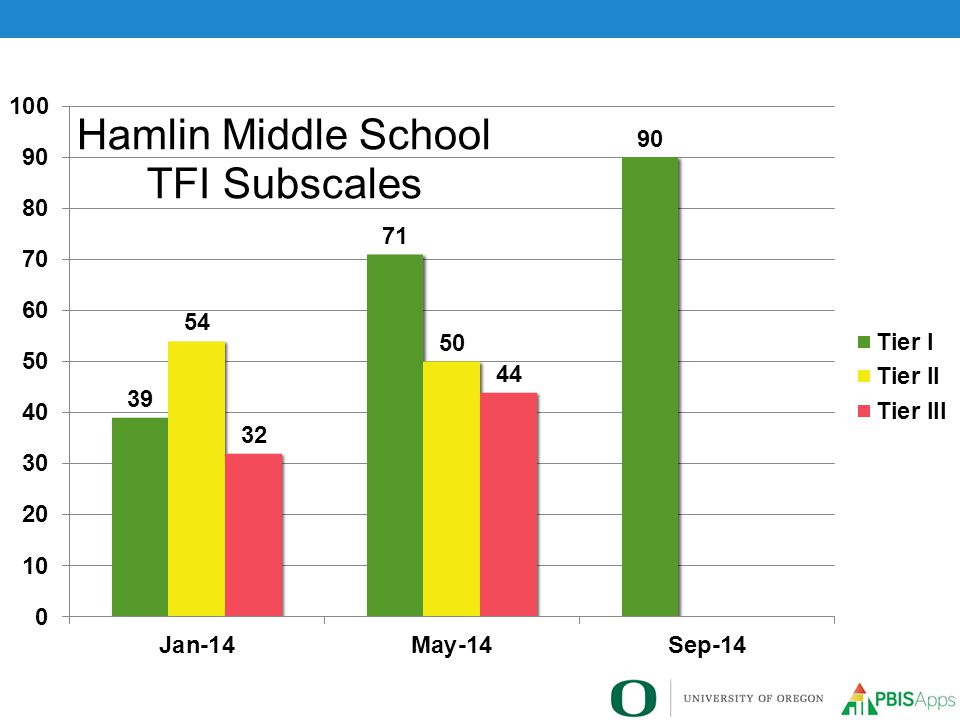
Hamlin Action Planning
PBIS Team used TFI results to identify items of importance 1.3 & 1.4 Behavioral Expectations & Teaching Expectations 1.6 Discipline Policies (e.g., flowchart) 1.9 Feedback & Acknowledgement (e.g., menu of reinforcers) PBIS Team worked on items during team meetings Solicited feedback from whole faculty Revised as needed Created lesson plans to teach all staff the aspects of school- wide PBIS during in-service week
 1.9 Feedback & Acknowledgement (e.g., menu of reinforcers) PBIS Team worked on items during team meetings. Solicited feedback from whole faculty. Revised as needed. Created lesson plans to teach all staff the aspects of school- wide PBIS during in-service week.")
34
Enablers of Sustainability
McIntosh, K., Predy, L., Upreti, G., Hume, A. E. & Mathews, S. (2014).
.")
35
Barriers to Sustainability
Number of Responses McIntosh, K., Predy, L., Upreti, G., Hume, A. E. & Mathews, S. (2014).
.")
36
What is most related to high sustainability?
The frequency that data are presented to all school staff! McIntosh, K., Predy, L., Upreti, G., Hume, A. E. & Mathews, S. (2014).
.")
37
It Keeps getting better!
Using School-wide Data for Continuous Quality Improvement Kelsey R. Morris, EdD—University of Oregon Nadia K. Sampson, MA—University of Oregon Session C13

Similar presentations


 E-12>")


 acknowledges the support of the Wisconsin Department of Public Instruction in the development.>")
 acknowledges the support.>")
 Day 2 pbis.sccoe.org.>")