Download presentation
Presentation is loading. Please wait.

2
International trade, however is not to blame. The decline in labor share also happens in “labour abundant countries” (i.e. India and China). Hence labour shares do not primarily decline due to outsourcing labour intensive activities from advance to emerging countries. Skill composition of the labour force is not an issue either Separating skilled and unskilled labour input in the production function, and controlling for changes in stock of skill labour relative to the stock of capital does not change the main result. According to author’s estimates, technology has caused relative price of investments goods to decline by 25% respect to consumption goods. Hence technology ultimately represent the main (although not only) cause of labor share decline. Why does it matter ? A falling labour share implies that productivity gains no longer translate into broad rises in pay. Instead, an ever larger share of the benefits of growth accrues to owners of capital. Policy implications change dramatically depending on the source and nature of the decline
. Hence labour shares do not primarily decline due to outsourcing labour intensive activities from advance to emerging countries. Skill composition of the labour force is not an issue either Separating skilled and unskilled labour input in the production function, and controlling for changes in stock of skill labour relative to the stock of capital does not change the main result. According to author’s estimates, technology has caused relative price of investments goods to decline by 25% respect to consumption goods. Hence technology ultimately represent the main (although not only) cause of labor share decline. Why does it matter . A falling labour share implies that productivity gains no longer translate into broad rises in pay. Instead, an ever larger share of the benefits of growth accrues to owners of capital. Policy implications change dramatically depending on the source and nature of the decline.")
3
One of Kaldor's (1957) stylized fact is that: “The shares of national income received by labor and capital are roughly constant over long periods of time” However, since the 1980s, we observe a global labor share decline. Globally, corporations paid about 65 percent of their income to labor (as opposed to capital) in 1975, compared with about 60 percent in 2007. WHY? The authors suggest that at least half of this decline is explained by the decline in the price of investment goods relative to consumption goods (which are in turn determined by technology)
 in 1975, compared with about 60 percent in WHY. The authors suggest that at least half of this decline is explained by the decline in the price of investment goods relative to consumption goods (which are in turn determined by technology).")
6
The authors focus on corporate labor share: Compensation paid to labor divided by gross value added Price of investment good: In national accounts, investment are the purchase of machinery (including software) and buildings (offices, infrastructure, dwellings) and the constitution of stocks (inventories)
 and buildings (offices, infrastructure, dwellings) and the constitution of stocks (inventories)")
7
The authors build a a new dataset for 59 countries for various years between 1975-2012 using country-level statistics on labor share in the corporate sector: Five different sources are combined: -country-specific Internet web pages -digital files and physical books from the UN -digital files and physical books from the OECD -EU KLEMS dataset Note: Although there are some differences in methodologies across countries, the data conforms to SNA standards.

9
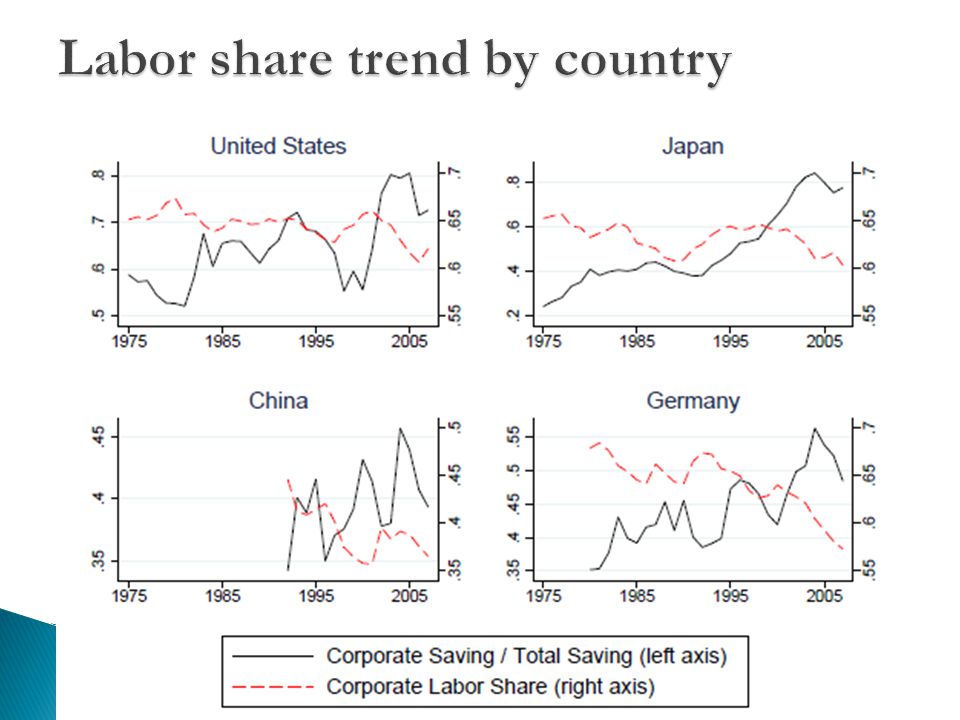
Year fixed effects from a regression of labor shares each year in the eight largest economies that also absorbs country fixed effects. Labor share declines were associated with increases in corporate profits and corporate savings, which equal the portion of profits which were not paid out as dividends

10
Two-sectors (Final consumption good and Final investment good) FINAL CONSUPTION GOOD: Competitive producers assemble the final consumption good Ct using z, a continuum of intermediate inputs with technology: ε is the elasticity of substitution between inputs varieties FINAL INVESTMET GOOD: Competitive producers assemble the final investment good Xt using z, a continuum of intermediate inputs with technology: ξ is the technology level in the production of the consumption good relative to the investment good INTERMEDIATE INPUT: monopolistically competitive firms use capital and labor in a CES production function: HOUSEHOLDS (owner of all capital and labor): maximize utility under a budget constraint:
 FINAL CONSUPTION GOOD: Competitive producers assemble the final consumption good Ct using z, a continuum of intermediate inputs with technology: ε is the elasticity of substitution between inputs varieties FINAL INVESTMET GOOD: Competitive producers assemble the final investment good Xt using z, a continuum of intermediate inputs with technology: ξ is the technology level in the production of the consumption good relative to the investment good INTERMEDIATE INPUT: monopolistically competitive firms use capital and labor in a CES production function: HOUSEHOLDS (owner of all capital and labor): maximize utility under a budget constraint:")
11
The model is solved according to a sequence: First households maximise utility deciding the consumption, labor supply, bonds, and investment. Then final producers of the investment and final goods minimize cost Then each producer of input maximizes profit Finally, markets clear. The share of income is given by Wages Rental of capital return Profits

12
Estimation is based on a CES production function specification. The FOC from this function, combined with the definitions of income shares (previous slide) give the following expression for labor share: Taking changes between two periods (t and t’): Where: μ is the mark-up, SL=share of labor, Ak is capital augmenting technology, R is the rate to which capital is rent. All term with hat are %changes over time.
 give the following expression for labor share: Taking changes between two periods (t and t’): Where: μ is the mark-up, SL=share of labor, Ak is capital augmenting technology, R is the rate to which capital is rent. All term with hat are %changes over time..")
13
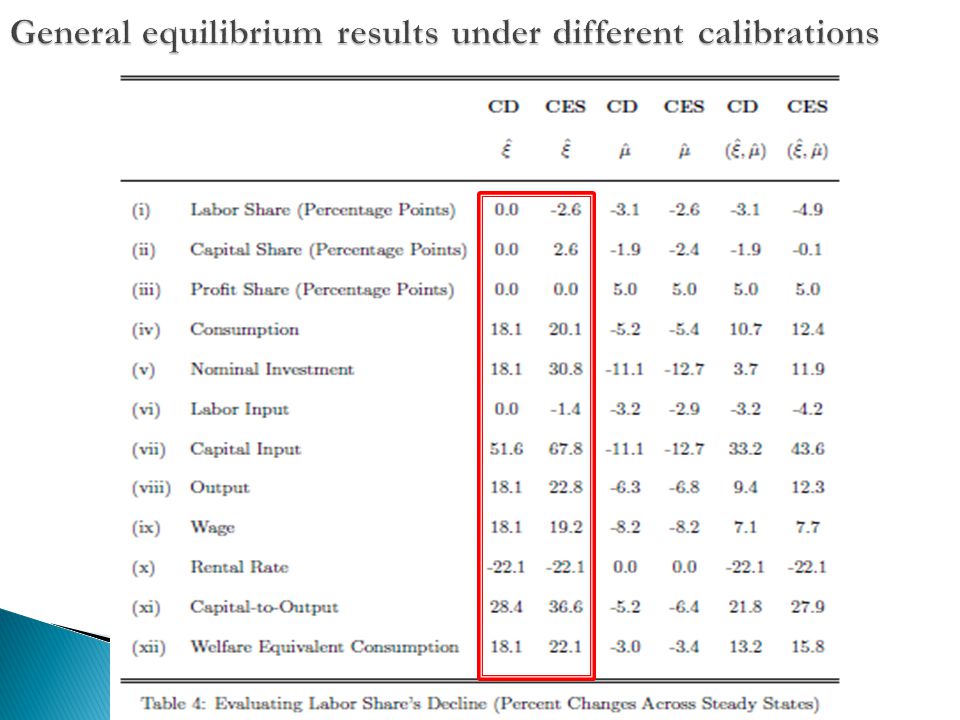
Once σ is estimated (= 1.25), it is used as an input to solve the general equilibrium model. The exercise is repeated with different extensions (addition of mark up, capital goods with higher depreciation rates, capital augmenting technology, skilled labor). I only present here the baseline case as the other specifications do not change the results dramatically. Based on the model described so far, the authors proceed at assessing the cause of labor share decline in two steps: First, the elasticity of capital/labor substitution σ is estimated from the following spécification of the labor share equation (in the CES production function case, with μ=1, μhat=0, Akhat=0):
. I only present here the baseline case as the other specifications do not change the results dramatically. Based on the model described so far, the authors proceed at assessing the cause of labor share decline in two steps: First, the elasticity of capital/labor substitution σ is estimated from the following spécification of the labor share equation (in the CES production function case, with μ=1, μhat=0, Akhat=0):.")
14
Cross section estimation of this equation with different datasets

16
The paper documents a decline in labor share (globally) matched by a decline in the price of investment goods (due to technology), identified as the main driver of the reduction in labor share. Policy implications: Should policy makers intervene (especially taking into account welfare implications). If so, how? Answers change according to main driver (technology/skill/globalization) For example, some propose taxing capital to make capital more costly relative to labor. Other propose to not intervene: just wait for developing countries to exhaust their “cheap labor” capacity. Debate on main causes of labor share decline is not conclusive. For example, Elsby et Al. “The Decline of the U.S. Labor Share” argue that offshoring is the main cause of the decline.
. If so, how. Answers change according to main driver (technology/skill/globalization) For example, some propose taxing capital to make capital more costly relative to labor. Other propose to not intervene: just wait for developing countries to exhaust their cheap labor capacity. Debate on main causes of labor share decline is not conclusive. For example, Elsby et Al. The Decline of the U.S. Labor Share argue that offshoring is the main cause of the decline..")
17
Technology and price of investment goods are not modelled. Not straightforward in the model, to see the channel through which price of investment goods drives labor shares down (via R). The representative household is both owner of the capital and supplier of labor. The model could be extended to provide macroeconomic implications of income distribution.
. The representative household is both owner of the capital and supplier of labor. The model could be extended to provide macroeconomic implications of income distribution..")
Similar presentations