Download presentation
Presentation is loading. Please wait.


1
Preparing Students for the 21 st Century Willard R. Daggett, CEO August 11, 2011

2
School Improvement Schools are Improving

3
School Improvement Changing World

4
Skills Gap

5
School Improvement Changing World Schools are Improving

6
School Improvement Changing World Schools are Improving

7
School Improvement Changing World Schools are Improving

8
WHY – WHAT - HOW

9
WHY

10
The Changing Landscape Technology

11
Semantic Web Analyze Documents Key words and headers (Google) Meaning / Concepts Wolfram Alpha Complete Task
 Meaning / Concepts Wolfram Alpha Complete Task")
12
Implications Homework Term Paper

13
-Wolfram Alpha- Will search all language and give you response in your language Will respond in writing or verbally (in your language)
")
16
SPOT Integrated ProjectionIntegrated Projection Projection KeyboardProjection Keyboard

17
Projection Keyboard

18
Projection Keyboard and Projector

19
1991 2011 Computing Capacity Moores Law – Doubles Every 2 Years 2021

20
The Changing Landscape Technology Financial

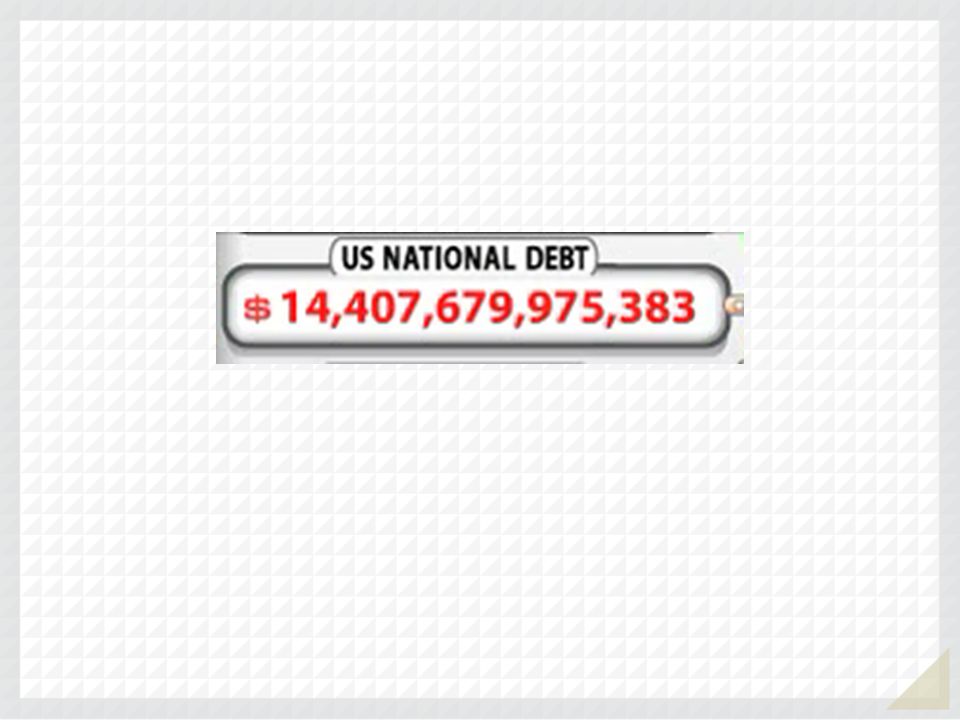
22
2011 US Federal Budget -borrowing 41% of every dollar it is spending

23
The Changing Landscape Technology Financial Globalization

24
Equity Excellence

25
Wal Mart Largest Corporation 8 times Size of Microsoft 2 % of GDP 1.4 Million Employees More Employees than: GM, Ford, G.E. and IBM Combined

26
China today exports in a single day more than it exported in all of 1978. Source: The Rise of India and China...

27
U.S. – 2 nd Half of 20 th Century Only Superpower Highest per Capita Income 1 st in Economic Growth 5% of Population > 24% of Consumption Source: National Academy of Science

28
Elementary Schools 6 Years Integrated Science Biology / Chemistry Grade 7 Biology / PhysicsGrade 8 Physics / Chemistry Grade 9 Integrated ScienceGrades 10 - 12 Source: Ed Week 6/6/07 Chinese Science

29
The Changing Landscape Technology Financial Globalization Demographics

30
Population FemaleMale 1950 2010 2050

31
Workforce 2020 The Ratio of the Prime Working Age Population to the Elderly is Falling YearRatio 19954.1 20004.1 20054.0 20103.9 20203.1 20302.3 Source: Census Bureau Projections

32
WHY – WHAT - HOW

33
Aligned for Success Doctors/Nurses in Hospitals Pilots in Flight Lawyers in a Law Firm Troops in Battle Teachers in a School System

34
why – WHAT - how

35
Reading Study Summary 600 800 1000 1400 1600 1200 Text Lexile Measure (L) High School Literature College Literature High School Textbooks College Textbooks Military Personal Use Entry-Level Occupations SAT 1, ACT, AP* * Source of National Test Data: MetaMetrics Interquartile Ranges Shown (25% - 75%)
 High School Literature College Literature High School Textbooks College Textbooks Military Personal Use Entry-Level Occupations SAT 1, ACT, AP* * Source of National Test Data: MetaMetrics Interquartile Ranges Shown (25% - 75%)")
36
COMMON CORE STATE STANDARDS college and career ready

37
Common Core State Standards Fewer Clearer Higher

38
Proficiency Grade 4 Reading Proficiency Grade 4 Reading Proficient Required NAEP Score Tennessee 88 % North Carolina 82 % Texas 81 % Iowa 77 % Indiana 72 % Massachusetts 48 % California 48 %

39
Proficiency Grade 4 Reading Proficiency Grade 4 Reading Proficient Required NAEP Score Tennessee 88 %170 North Carolina 82 %183 Texas 81 %190 Iowa 77 %197 Indiana 72 %199 Massachusetts 48 %234 California 48 %210

40
Proficiency Grade 8 Reading Proficiency Grade 8 Reading Proficient Required NAEP Score North Carolina 88 % Tennessee 87 % Iowa 72 % Indiana 66 % California 39 % South Carolina 30 %

41
Proficiency Grade 8 Reading Proficiency Grade 8 Reading Proficient Required NAEP Score North Carolina 88 %217 Tennessee 87 %222 Iowa 72 %250 Indiana 66 %249 California 39 %262 South Carolina 30 %276

42
Proficiency Grade 4 Mathematics Proficiency Grade 4 Mathematics Proficient Required NAEP Score North Carolina 91 % Tennessee 87 % Iowa 80 % Indiana 72 % Florida 63 % California 51 % South Carolina 39 % Massachusetts 39 %

43
Proficiency Grade 4 Mathematics Proficient Required NAEP Score North Carolina 91 %203 Tennessee 87 %200 Iowa 80 %219 Indiana 72 %225 Florida 63 %230 California 51 %231 South Carolina 39 %246 Massachusetts 39 %255

44
Proficiency Grade 8 Mathematics Proficiency Grade 8 Mathematics Proficient Required NAEP Score Tennessee 88 % North Carolina 84 % Iowa 76 % Indiana 70 % Michigan 61 % Florida 58 % Massachusetts 42 %

45
Proficiency Grade 8 Mathematics Proficiency Grade 8 Mathematics Proficient Required NAEP Score Tennessee 88 %230 North Carolina 84 %247 Iowa 76 %262 Indiana 70 %266 Michigan 61 %269 Florida 58 %269 Massachusetts 42 %301

46
Common Core State Standards Fewer Clearer Higher Different

47
Application Model 1.Knowledge in one discipline 2.Application within discipline 3.Application across disciplines 4.Application to real-world predictable situations 5.Application to real-world unpredictable situations

48
Knowledge Taxonomy 1.Awareness 2.Comprehension 3.Application 4.Analysis 5.Synthesis 6.Evaluation

49
Application Model 1.Knowledge in one discipline 2.Application within discipline 3.Application across disciplines 4.Application to real-world predictable situations 5.Application to real-world unpredictable situations

50
1 2 3 4 5 Blooms CDCDABABCDCDABAB 4 5 6 3 2 1 Application Levels

51
1 2 3 4 5 6 12345 A B D C Rigor/Relevance Framework Express probabilities as fractions, percents, or decimals. Classify triangles according to angle size and/or length of sides. Calculate volume of simple three- dimensional shapes. Given the coordinates of a quadrilateral, plot the quadrilateral on a grid. Analyze the graphs of the perimeters and areas of squares having different-length sides. Determine the largest rectangular area for a fixed perimeter. Identify coordinates for ordered pairs that satisfy an algebraic relation or function. Determine and justify the similarity or congruence for two geometric shapes. Obtain historical data about local weather to predict the chance of snow, rain, or sun during year. Test consumer products and illustrate the data graphically. Plan a large school event and calculate resources (food, decorations, etc.) you need to organize and hold this event. Make a scale drawing of the classroom on grid paper, each group using a different scale. Calculate percentages of advertising in a newspaper. Tour the school building and identify examples of parallel and perpendicular lines, planes, and angles. Determine the median and mode of real data displayed in a histogram Organize and display collected data, using appropriate tables, charts, or graphs.
 you need to organize and hold this event. Make a scale drawing of the classroom on grid paper, each group using a different scale. Calculate percentages of advertising in a newspaper. Tour the school building and identify examples of parallel and perpendicular lines, planes, and angles. Determine the median and mode of real data displayed in a histogram Organize and display collected data, using appropriate tables, charts, or graphs..")
52
1 2 3 4 5 6 12345 A B D C Analyze the graphs of the perimeters and areas of squares having different-length sides. Determine the largest rectangular area for a fixed perimeter. Identify coordinates for ordered pairs that satisfy an algebraic relation or function. Determine and justify the similarity or congruence for two geometric shapes. Obtain historical data about local weather to predict the chance of snow, rain, or sun during year. Test consumer products and illustrate the data graphically. Plan a large school event and calculate resources (food, decorations, etc.) you need to organize and hold this event. Make a scale drawing of the classroom on grid paper, each group using a different scale. Calculate percentages of advertising in a newspaper. Tour the school building and identify examples of parallel and perpendicular lines, planes, and angles. Determine the median and mode of real data displayed in a histogram Organize and display collected data, using appropriate tables, charts, or graphs. Express probabilities as fractions, percents, or decimals. Classify triangles according to angle size and/or length of sides. Calculate volume of simple three- dimensional shapes. Given the coordinates of a quadrilateral, plot the quadrilateral on a grid. Rigor/Relevance Framework
 you need to organize and hold this event. Make a scale drawing of the classroom on grid paper, each group using a different scale. Calculate percentages of advertising in a newspaper. Tour the school building and identify examples of parallel and perpendicular lines, planes, and angles. Determine the median and mode of real data displayed in a histogram Organize and display collected data, using appropriate tables, charts, or graphs. Express probabilities as fractions, percents, or decimals. Classify triangles according to angle size and/or length of sides. Calculate volume of simple three- dimensional shapes. Given the coordinates of a quadrilateral, plot the quadrilateral on a grid. Rigor/Relevance Framework.")
53
1 2 3 4 5 6 12345 A B D C Express probabilities as fractions, percents, or decimals. Classify triangles according to angle size and/or length of sides. Calculate volume of simple three- dimensional shapes. Given the coordinates of a quadrilateral, plot the quadrilateral on a grid. Analyze the graphs of the perimeters and areas of squares having different-length sides. Determine the largest rectangular area for a fixed perimeter. Identify coordinates for ordered pairs that satisfy an algebraic relation or function. Determine and justify the similarity or congruence for two geometric shapes. Obtain historical data about local weather to predict the chance of snow, rain, or sun during year. Test consumer products and illustrate the data graphically. Plan a large school event and calculate resources (food, decorations, etc.) you need to organize and hold this event. Make a scale drawing of the classroom on grid paper, each group using a different scale. Calculate percentages of advertising in a newspaper. Tour the school building and identify examples of parallel and perpendicular lines, planes, and angles. Determine the median and mode of real data displayed in a histogram. Organize and display collected data, using appropriate tables, charts, or graphs. Rigor/Relevance Framework
 you need to organize and hold this event. Make a scale drawing of the classroom on grid paper, each group using a different scale. Calculate percentages of advertising in a newspaper. Tour the school building and identify examples of parallel and perpendicular lines, planes, and angles. Determine the median and mode of real data displayed in a histogram. Organize and display collected data, using appropriate tables, charts, or graphs. Rigor/Relevance Framework.")
54
1 2 3 4 5 Blooms CDCDABABCDCDABAB 4 5 6 3 2 1 Application Levels

55
1 2 3 12345 A B D C Calculate with numbers, including decimals, ratios, percents, and fractions. Understand two- dimensional motion and trajectories by separating the motion of an object into x and y components. Rigor/Relevance Framework

56
1 2 3 12345 A B D C Know the characteristics and phenomena of sound waves and light waves. Understand the effect of sounds, words, and imagery on a listening audience. Rigor/Relevance Framework

57
A B D C

58
why – what - HOW

59
Next Navigator

60
12345

61
Road Map State Standards to State Test

62
ISTEP+ / ECA English LA Learning Expectations Tested

63
MCA II English LA Benchmarks Tested

64
Louisiana iLEAP / LEAP English Language Arts Grade Level Expectations

65
NC End-of-Course/Grade Test English LA - Objectives

66
Alabama English LA Strands / Objectives ARMT/AHSGE

67
State Tests State Standards A A

68
Road Map State Standards to State Test State Standards to Research

69
National Essential Skills Study (NESS)
")
70
NESS Study Subgroup Rankings ELA Skill: Write clear and concise directions or procedures. GroupRank Overall9 Business/Industry2 Other Non-educators10 English Language Arts Teachers25 Other Educators8

71
NESS Study Subgroup Rankings ELA Skill: Give clear and concise oral directions. GroupRank Overall7 Business/Industry3 Other Non-educators9 English Language Arts Teachers28 Other Educators7

72
NESS Study Subgroup Rankings Math Skill: Apply the Pythagorean Theorem to right triangles. GroupRank Overall20 Business/Industry29 Other Non-educators31 Mathematics Teachers4 Other Educators24

73
NESS Study Subgroup Rankings Math Skill: Understand accuracy and precision of measurement, round off numbers according to the correct number of significant figures, and determine percent error. GroupRank Overall12 Business/Industry3 Other Non-educators10 Mathematics Teachers30 Other Educators8

74
Proficiency

75
Reading Study Summary 600 800 1000 1400 1600 1200 Text Lexile Measure (L) High School Literature College Literature High School Textbooks College Textbooks Military Personal Use Entry-Level Occupations SAT 1, ACT, AP* * Source of National Test Data: MetaMetrics Interquartile Ranges Shown (25% - 75%)
 High School Literature College Literature High School Textbooks College Textbooks Military Personal Use Entry-Level Occupations SAT 1, ACT, AP* * Source of National Test Data: MetaMetrics Interquartile Ranges Shown (25% - 75%)")
76
NESS & Lexile State Tests State Standards C A C

77
Common Core Standards NESS & Lexile State Tests State Standards C A

78
OK Standards CCSS

79
CCSS OK Standards

80
Road Map State Standards to State Test State Standards to Research State Standards to CCSS CCSS to State Standard

81
Road Map State Standards to State Test State Standards to Research State Standards to CCSS CCSS to State Standard State Test to CCSS Samples to NGA

82
Road Map State Standards to State Test State Standards to Research State Standards to CCSS CCSS to State Standard State Test to CCSS Samples to NGA

83
State Test NGA Create a large spinner for a game that has at least eight sectors. Each sector should be assigned a different prize. Prizes should range in value from most appealing to least appealing. Vary the sectors so that the probability to win a desired prize is much less that the probability to win a lesser desired prize. Calculate the theoretical probability of landing on each prize. Conduct multiple trials with the spinner and determine the experimental probability of landing on each prize. Which price has the greatest probability and which prize has the least probability?

84
Common Core Standards NESS & Lexile State Tests State Standards Consortium Assessment DA

85
Road Map State Standards to State Test State Standards to Research State Standards to CCSS CCSS to State Standard State Test to CCSS Samples to NGA NGA to CCSS

86
12345

87
A B D C

88
WHY – WHAT - HOW

89
Aligned for Success Doctors/Nurses in Hospitals Pilots in Flight Lawyers in a Law Firm Troops in Battle Teachers in a School System

90
What Works RESEARCH

91
What Works RESEARCH MODEL SCHOOLS

92
What Works RESEARCH MODEL SCHOOLS STRUCTURE

93
What Works RESEARCH MODEL SCHOOLS BEST PRACTICES STRUCTURE

94
What Works RESEARCH MODEL SCHOOLS ACTION PLAN BEST PRACTICES STRUCTURE

95
What Works RESEARCH MODEL SCHOOLS ACTION PLAN BEST PRACTICES STRUCTURE

96
Focus What is effective?

97
Research on Effectiveness Data-rich, analysis-poor –Meta-analysis

98
Research on Effectiveness Data-rich, analysis-poor –Meta-analysis Visible Learning by John Hattie –52,637 –800 meta-analyses

99
Research on Effectiveness Data-rich, analysis-poor –Meta-analysis Visible Learning by John Hattie –52,637 –800 meta-analyses Sutton Trust Research, UK

100
1 Standard Deviation Students do better than 84% of students not in that initiative

101
1 Standard Deviation Students do better than 84% of students not in that initiative Typically represent 2 years growth in one year

102
Focus What is effective?

103
Application of Knowledge Effective.65 SD = 1.30 Years Growth per Year

104
Student Teacher Relationship Effective.72 SD = 1.44 Years Growth per Year

105
Literacy Strategies Effective.61 SD = 1.22 Years Growth per Year

106
Focus What is effective? What you can impact?

107
Socioeconomic Status Effective

108
You Cannot Change Where YOUR STUDENTS CAME FROM However You Can Change Where YOUR STUDENTS ARE GOING

109
Focus What is effective? What you can impact? What is most efficient?

110
Effectiveness and Efficiency Framework High Cost Low Cost

111
Effectiveness and Efficiency Framework High Cost Low Cost High Student Performance Low Student Performance EfEffecfecttivenessivenessEfEffecfecttivenessivenesst

112
Effectiveness and Efficiency Framework High Cost Low Cost High Student Performance Low Student Performance CDCDABABCDCDABAB EfEffecfecttivenessivenessEfEffecfecttivenessivenesst

113
Greatest Impact What is effective? What you can impact? What is most efficient?

114
Greatest Impact Culture of High Expectations Relevance of Instruction Strong Relationships

115
Findings Teachers are our greatest hope.

116
Student Teacher Relationship Effective Efficient

117
Application of Knowledge EffectiveEfficient

118
Professional Development Effective Efficient

119
Teacher Expectations and Clarity EffectiveEfficient

120
Assessment to Inform and Differentiate Instruction Effective Efficient

121
Literacy Strategies Effective Efficient

122
What is less effective and efficient

123
Class Size EffectiveEfficient

124
Summer School EffectiveEfficient

125
0.72 0.90 0.62 0.75 0.40 0.67 0.90 0.60 0.75 0.90 0.69 0.80 0.60 0.65 0.55 0.75 0.21 0.20 0.30 0.55 0.22 0.90 0.23 0.20 Student Teacher PD Prior Achieve Form. Eval. Teacher Clarity Meta Strats. Literacy Strats. Peer Tutor Class Size Ability Group Teach Test Summer School

126
System

127
Aligned for Success Doctors/Nurses in Hospitals Pilots in Flight Lawyers in a Law Firm Troops in Battle Teachers in a School System

128
Student Achievement

129
Key to Effective Instruction Is Alignment Organizational Leadership Instructional Leadership Teaching

130
Organizational Leadership Instructional Leadership Student Achievement

131
Organizational Leadership Student Achievement

132
Culture Organizational Leadership

133
Semantic Web Analyze Documents Key words and headers (Google) Meaning / Concepts Wolfram Alpha Complete Task
 Meaning / Concepts Wolfram Alpha Complete Task")
134
Create a Culture What is the message? Who it is delivered to and in what order? How to deliver it?

135
Culture Vision Organizational Leadership

136
Criteria Foundation Learning (Achievement in the core subjects of English language arts, math and science and others identified by the school)
")
137
Criteria Foundation Learning (Achievement in the core subjects of English language arts, math and science and others identified by the school) Stretch Learning (Demonstration of rigorous and relevant learning beyond the minimum requirements)
 Stretch Learning (Demonstration of rigorous and relevant learning beyond the minimum requirements)")
138
Criteria Foundation Learning (Achievement in the core subjects of English language arts, math and science and others identified by the school) Stretch Learning (Demonstration of rigorous and relevant learning beyond the minimum requirements) Student Engagement (The extent to which students are motivated and committed to learning; have a sense of belonging and accomplishment; and have relationships with adults, peers, and parents that support learning)
 Stretch Learning (Demonstration of rigorous and relevant learning beyond the minimum requirements) Student Engagement (The extent to which students are motivated and committed to learning; have a sense of belonging and accomplishment; and have relationships with adults, peers, and parents that support learning)")
139
Criteria Foundation Learning (Achievement in the core subjects of English language arts, math and science and others identified by the school) Stretch Learning (Demonstration of rigorous and relevant learning beyond the minimum requirements) Student Engagement (The extent to which students are motivated and committed to learning; have a sense of belonging and accomplishment; and have relationships with adults, peers, and parents that support learning) Personal Skill Development (Measures of personal, social, service, and leadership skills and demonstrations of positive behaviors and attitudes)
 Stretch Learning (Demonstration of rigorous and relevant learning beyond the minimum requirements) Student Engagement (The extent to which students are motivated and committed to learning; have a sense of belonging and accomplishment; and have relationships with adults, peers, and parents that support learning) Personal Skill Development (Measures of personal, social, service, and leadership skills and demonstrations of positive behaviors and attitudes)")
140
Guiding Principles Responsibility Responsibility Contemplation Contemplation Initiative Initiative Perseverance Perseverance Optimism Optimism Courage Courage Respect Respect Compassion Compassion Adaptability Adaptability Honesty Honesty Trustworthiness Trustworthiness Loyalty Loyalty

141
Survey Tools for Rigor, Relevance and Relationships We Learn Student Survey We Teach Instructional Staff Survey We Lead Whole Staff Survey

142
Teacher vs. Student Comparison T – Students can apply what I am teaching to their everyday lives. 92% S – I can apply what I learn to my everyday life. 58%

143
Teacher vs. Student Comparison T – Students in my classroom engage in hands-on activities. 88% S – We do lots of hands-on activities in my classes. 45%

144
Teacher vs. Student Comparison T – I make learning exciting for my students. 84% S – My teachers make learning exciting.40%

145
Teacher vs. Student Comparison T – I recognize students when they demonstrate positive behavior in school. 95% S – Good citizenship is rewarded in this school. 40%

146
Guiding Principles Responsibility Responsibility Contemplation Contemplation Initiative Initiative Perseverance Perseverance Optimism Optimism Courage Courage Respect Respect Compassion Compassion Adaptability Adaptability Honesty Honesty Trustworthiness Trustworthiness Loyalty Loyalty

147
Criteria Foundation Learning (Achievement in the core subjects of English language arts, math and science and others identified by the school) Stretch Learning (Demonstration of rigorous and relevant learning beyond the minimum requirements) Student Engagement (The extent to which students are motivated and committed to learning; have a sense of belonging and accomplishment; and have relationships with adults, peers, and parents that support learning) Personal Skill Development (Measures of personal, social, service, and leadership skills and demonstrations of positive behaviors and attitudes)
 Stretch Learning (Demonstration of rigorous and relevant learning beyond the minimum requirements) Student Engagement (The extent to which students are motivated and committed to learning; have a sense of belonging and accomplishment; and have relationships with adults, peers, and parents that support learning) Personal Skill Development (Measures of personal, social, service, and leadership skills and demonstrations of positive behaviors and attitudes)")
148
Those things that are easy to measure are least important Those thing that are most important are hardest to measure

149
Rubrics AASA NEA AFT NASSP NSBA CCSSO NASBE ASCD AIR Gates Foundation

150
Criteria Foundation Learning (Achievement in the core subjects of English language arts, math and science and others identified by the school) Stretch Learning (Demonstration of rigorous and relevant learning beyond the minimum requirements) Student Engagement (The extent to which students are motivated and committed to learning; have a sense of belonging and accomplishment; and have relationships with adults, peers, and parents that support learning) Personal Skill Development (Measures of personal, social, service, and leadership skills and demonstrations of positive behaviors and attitudes)
 Stretch Learning (Demonstration of rigorous and relevant learning beyond the minimum requirements) Student Engagement (The extent to which students are motivated and committed to learning; have a sense of belonging and accomplishment; and have relationships with adults, peers, and parents that support learning) Personal Skill Development (Measures of personal, social, service, and leadership skills and demonstrations of positive behaviors and attitudes)")
151
Is your purpose to prepare students for the test?

152
Is your purpose to prepare students for the test? What else should you prepare them for?

153
Culture Vision Structure and systems Organizational Leadership

154
Organizational Changes Looping Interdisciplinary Chairs Electives to 9th Grade

155
Culture Vision Structure and systems Organizational Leadership Build leadership

156
Top-down support for bottom-up success

157
Empower Leadership Teams

158
Leadership Teams Coherent Vision Empowerment

159
www.leadrered.com/leadershipacademy

160
Culture Vision Structure and systems Selection, support, evaluation Organizational Leadership Build leadership

161
Culture Vision Structure and systems Selection, support, evaluation Organizational Leadership Data systems Build leadership

162
Teacher evaluation systems need to be tied directly to data systems

163
Rigor and Relevance Teaching

164
1 2 3 4 5 Blooms CDCDABABCDCDABAB 4 5 6 3 2 1 Application Levels

165
Gold Seal Lessons

169
Rigor and Relevance Relationships Teaching

170
A B D C

171
Rigor and Relevance Relationships Content Teaching

172
Rigor and Relevance Relationships Content Teaching How students learn

173
A B D C

174
How They Learn

175
A B D C

176
Rigor and Relevance Relationships Content Teaching How students learn Instructional strategies

177
RIGORRIGOR RELEVANCE A B D C Rigor/Relevance Framework Teacher Works StudentThinks Student Thinks and Works StudentWorks High Low Teacher/Student Roles

178
Rigor and Relevance Handbook

179
Selection of Strategies Based on Rigor/ Relevance Framework

180
Instructional Strategies: How to Teach for Rigor and Relevance

181
Rigor and relevance Relationships Content Teaching How students learn Instructional strategies Assessment to guide instruction

182
Teaching Organizational Leadership Instructional Leadership Student Achievement

183
High expectations Instructional Leadership

184
Teacher Expectations and Clarity Effective Efficient

185
Next Navigator

186
A B D C

187
High expectations Curriculum Instructional Leadership

188
High expectations Curriculum Literacy and math Instructional Leadership

189
High expectations Curriculum Literacy and math Data-driven Instructional Leadership

190
Indiana Career and Technical Education Indiana Language Arts Literacy Standards/Strands/ Learning Expectations Grade 9 ISTEP + Grad e 10 Agriculture, Food & Natural Resources Architectur e & Constructio n Arts, A/V Technology & Communications Food Products &ProcessingSystems AgribusinessSystems Power, Structural &Technical Systems EnvironmentalService Systems Plant Systems Natural ResourceSystems Animal Systems Design/Pre-Construction Construction Maintenance/Operations Performing Arts Visual Arts PrintingTechnology Journalism &Broadcasting A/V Technology& Film Telecommunications Vocabulary and Concept Development 9.1.1 Identify and use the literal and figurative meanings of words and understand the origins of words. M 9.1.2 Distinguish between what words mean literally and what they imply and interpret what the words imply. M 9.1.3 Use knowledge of mythology (Greek, Roman, and others mythologies) to understand the origin and meaning of new words. M Structural Features of Informational and Technical Materials 9.2.1 Analyze the structure and format of functional workplace documents, including the graphics and headers, and explain how authors use the features to achieve their purposes. H 9.2.2 Prepare a bibliography of reference materials for a report using a variety of consumer, workplace, and public documents, such as consumer, government, workplace and others. L
 to understand the origin and meaning of new words. M Structural Features of Informational and Technical Materials Analyze the structure and format of functional workplace documents, including the graphics and headers, and explain how authors use the features to achieve their purposes. H Prepare a bibliography of reference materials for a report using a variety of consumer, workplace, and public documents, such as consumer, government, workplace and others. L.")
191
Indiana Arts Education Indiana Language Arts Literacy Standards/Strands/Learning Expectations Grade 9 NESS Rankings ISTEP+ Grade 10 Visual Arts DanceMusic Theatr e Vocabulary and Concept Development 9.1.1 Identify and use the literal and figurative meanings of words and understand the origins of words. E5M 9.1.2 Distinguish between what words mean literally and what they imply and interpret what the words imply. E5M 9.1.3 Use knowledge of mythology (Greek, Roman, and others mythologies) to understand the origin and meaning of new words. E5 E23 M 9.2.1 Analyze the structure and format of functional workplace documents, including the graphics and headers, and explain how authors use the features to achieve their purposes. E20 E25 H 9.2.2 Prepare a bibliography of reference materials for a report using a variety of consumer, workplace, and public documents, such as consumer, government, workplace and others. E27L* 9.2.3 Generate relevant questions about readings on issues or topics that can be researched. E6L* 9.2.4 Synthesize the content from several sources or works by a single author dealing with a single issue; paraphrase the ideas and connect them to other sources and related topics to demonstrate comprehension. E24H
 to understand the origin and meaning of new words. E5 E23 M Analyze the structure and format of functional workplace documents, including the graphics and headers, and explain how authors use the features to achieve their purposes. E20 E25 H Prepare a bibliography of reference materials for a report using a variety of consumer, workplace, and public documents, such as consumer, government, workplace and others. E27L* Generate relevant questions about readings on issues or topics that can be researched. E6L* Synthesize the content from several sources or works by a single author dealing with a single issue; paraphrase the ideas and connect them to other sources and related topics to demonstrate comprehension. E24H.")
192
Power of Discovery Lexile and Quantile Study Opportunity

193
Lexile Framework ® for Reading Study 600 800 1000 1400 1600 1200 Text Lexile Measure (L) High School Literature College Literature High School Textbooks College Textbooks Military Personal Use Entry-Level Occupations SAT 1, ACT, AP* * Source of National Test Data: MetaMetrics Interquartile Ranges Shown (25% - 75%) Summary of Text Lexile Measures
 High School Literature College Literature High School Textbooks College Textbooks Military Personal Use Entry-Level Occupations SAT 1, ACT, AP* * Source of National Test Data: MetaMetrics Interquartile Ranges Shown (25% - 75%) Summary of Text Lexile Measures")
194
Lexile Framework ® - Student Profile 600 800 1000 1400 1600 1200 Text Lexile Measure (L) Matt * Source of National Test Data: MetaMetrics 910 Matt - Age 15, Grade 10, Lexile 1090, GPA 3.0
 Matt * Source of National Test Data: MetaMetrics 910 Matt - Age 15, Grade 10, Lexile 1090, GPA 3.0")
195
Lexile Framework ® - Student Profile 600 800 1000 1400 1600 1200 Text Lexile Measure (L) High School Literature College Literature High School Textbooks College Textbooks Military Personal Use Entry-Level Occupations SAT 1, ACT, AP* * Source of National Test Data: MetaMetrics Matt 600 800 1000 1400 1600 1200 High School Literature College Literature High School Textbooks College Textbooks Military Personal Use Entry-Level Occupations SAT 1, ACT, AP* 1 st Quarter 2 nd Quarter 3 rd Quarter 4 th Quarter
 High School Literature College Literature High School Textbooks College Textbooks Military Personal Use Entry-Level Occupations SAT 1, ACT, AP* * Source of National Test Data: MetaMetrics Matt High School Literature College Literature High School Textbooks College Textbooks Military Personal Use Entry-Level Occupations SAT 1, ACT, AP* 1 st Quarter 2 nd Quarter 3 rd Quarter 4 th Quarter")
196
High expectations Curriculum Literacy and math Data-driven Provide professional growth Instructional Leadership

197
Teaching Organizational Leadership Instructional Leadership Student Achievement

198
Next Steps

199
Start with awareness program Next Steps

200
Start with awareness program Needs Assessment Next Steps

201
Start with awareness program Needs Assessment Transition Plan Next Steps

202
Start with awareness program Needs Assessment Transition Plan Provide support to teachers now Next Navigator Focused and sustained professional development Next Steps

203
Start with awareness program Needs Assessment Transition Plan Provide support to teachers now Next Navigator Focused and sustained professional development Monitor progress Next Steps

204
Successful Practices Network www.successfulpractices.org Provide Focused / Sustained Professional Development System Robust Online Teacher Support Resources Support Transition to CCSS Improving Instruction / Student Engagement Low Cost - Highly Effective Resources

205
ORLANDO June 24-27 2012 20 th Annual Model Schools Conference www.modelschoolsconference.com

206
Model Schools Conference 2012 June 24 - 27, 2012 Gaylord Palms Resort and Convention Center Orlando, FL SAVE THE DATE!

207
1587 Route 146 Rexford, NY 12148 Phone (518) 399-2776 Fax (518) 399-7607 E-mail: info@LeaderEd.com www.LeaderEd.com International Center for Leadership in Education
 Fax (518) International Center for Leadership in Education")
Similar presentations