Download presentation
Presentation is loading. Please wait.

1
EMR 6500: Survey Research Dr. Chris L. S. Coryn Kristin A. Hobson Spring 2013

2
Agenda Systematic sampling Cluster sampling for means and totals

3
Systematic Sampling

4
Systematic sampling simplifies the sample selection process compared to both simple random sampling and stratified random sampling In systematic sampling an interval (k) is used to select sample elements The starting point is (should be) selected randomly
 is used to select sample elements The starting point is (should be) selected randomly")
5
Systematic Sampling Systematic sampling is a useful alternative to simple random sampling because: 1.It is easier to perform in the field and less subject to selection errors, especially if a good frame is not available 2.It can provide greater information per unit cost than simple random samples for populations with certain patterns in the arrangement of elements

6
1-in-k Systematic Sampling Divide the population size N by the desired sample size n Let k = N/n k must be equal to or less than N/n (i.e., k ≤ N/n) – If N = 15,000 and n = 100, then k ≤ 150
 – If N = 15,000 and n = 100, then k ≤ 150")
7
1-in-k Systematic Sampling If N were 1,000 and n were 100 k would equal 1,000/100 = 10 If k = 10, the start value would range between 1 to 10 and all selections thereafter would be every 10 th entry on the sampling frame – If the start value was 8, then the next selection would be 18, followed by 28, and so forth

8
Random Population Elements

9
Ordered Population Elements

10
Periodic Population Elements

11
Estimation of a Population Mean and Total

12
Estimation of a Population Mean *Note: This formula assumes a randomly ordered population

13
Estimation of a Population Total *Note: This formula assumes a randomly ordered population

14
Estimation of a Population Proportion

15
*Note: This formula assumes a randomly ordered population

16
Selecting the Sample Size

17
Sample Size for Estimating a Population Mean

18
Sample Size for Estimating a Population Proportion

19
Variance Estimation for Ordered and Periodic Distributions

20
Variance Estimates Repeated systematic sampling – Divides a systematic sample into smaller systematic samples to approximate a random population – Multiple 1-in-k systematic samples Successive difference method – A samples of size n yields n-1 successive differences that are used to estimate variance – Best choice when population elements are not randomly ordered

21
Cluster Sampling

22
Cluster sampling is a probability sampling method in which each sampling unit is a collection, or cluster, of elements Clusters can consist of almost any imaginable natural (and artificial) grouping of elements
 grouping of elements")
23
Cluster Sampling Cluster sampling is an effective sampling design if: 1.A good sampling frame listing population elements is not available or is very costly to obtain, but a frame listing clusters is easily obtained 2.The cost of obtaining observations increases as the distance separating elements increases

24
Cluster Sampling Unlike stratified random sampling, in which strata are ideally similar within stratum and where stratum should differ from one another, clusters should be different within clusters and be similar between clusters

26
Cluster Sampling Notation

27
Estimation of a Population Mean and Total

28
Estimation of a Population Mean *Note: takes the form of a ratio estimator, with taking the place of *Note: can be estimated by if M is unknown

29
Example for a Population Mean Cluster Number of residents, m i Total income per cluster, y i Cluster Number of residents, Total income per cluster 18$96,0001410$49,000 212$121,000159$53,000 34$42,000163$50,000 45$65,000176$32,000 56$52,000185$22,000 66$40,000195$45,000 77$75,000204$37,000 85$65,000216$51,000 98$45,000228$30,000 103$50,000237$39,000 112$85,000243$47,000 126$43,000258$41,000 135$54,000

30
Example for a Population Mean nMMedSD Resident ( )256.0406.0002.371 Income ( )25$51,360$49,000$21,784 25099325,189
 Income ( )25$51,360$49,000$21, ,189")
31
Example for a Population Mean *Note: Because M is not known, is estimated by

32
Example for a Population Mean

33
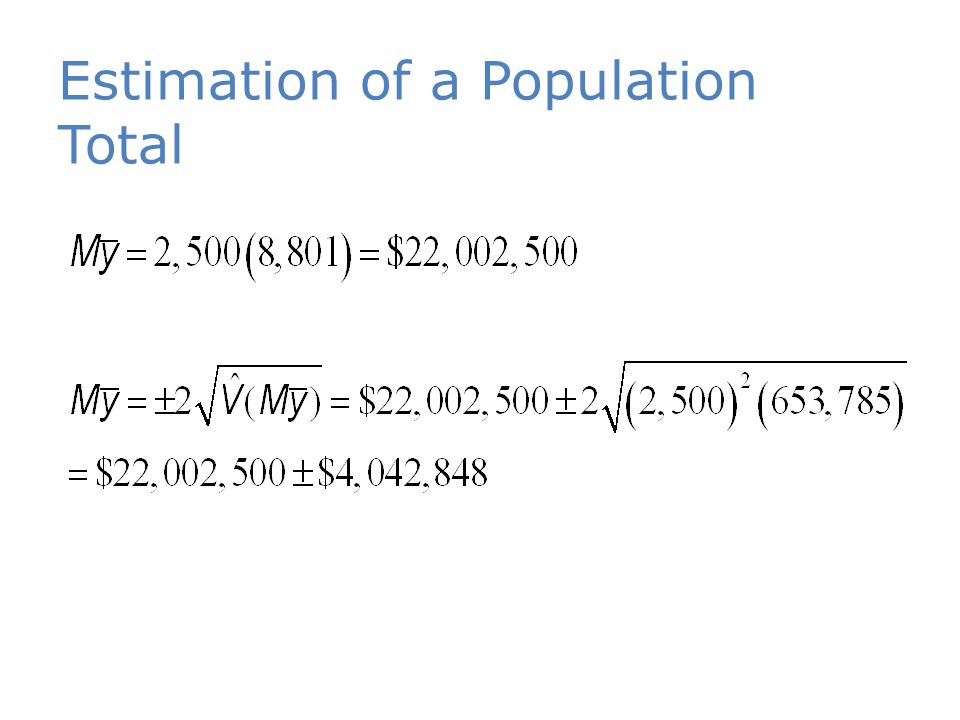
Estimation of a Population Total

35
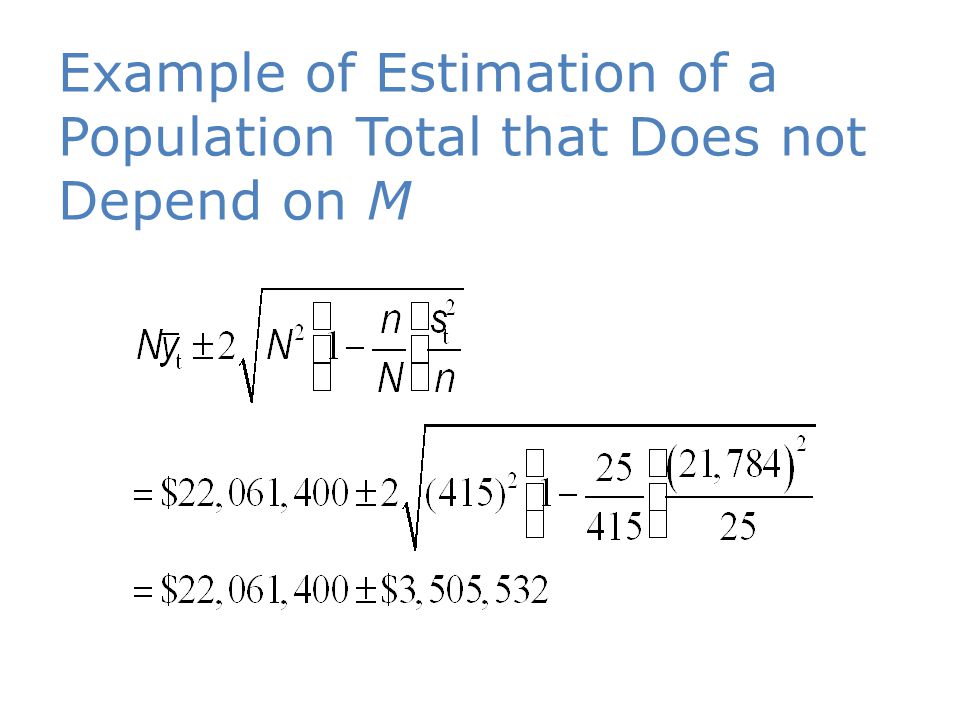
Estimation of a Population Total that Does not Depend on M

36
Example of Estimation of a Population Total that Does not Depend on M

38
Equal Cluster Sizes

39
Equal Cluster Sizes for Estimating a Population Mean All m i values are equal to a common, or constant, value m In this case, M = Nm, and the total sample size is nm elements (n clusters of m elements each) When cluster sizes are equal m 1 = m 2 = m N Variance components analysis simplifies estimating the variance using ANOVA methods
 When cluster sizes are equal m 1 = m 2 = m N Variance components analysis simplifies estimating the variance using ANOVA methods")
40
Equal Cluster Sizes for Estimating a Population Mean

41
ANOVA Method Cluste r Number of NewspapersTotal 1121332141119 2132231411220 3211113213116 4113215123120 There are 4,000 households (elements) There are 400 geographical regions (clusters) There are 10 households in each region
 There are 400 geographical regions (clusters) There are 10 households in each region")
42
ANOVA Method

43
SourcedfSSMS Factor31.070.36 Error3643.301.20 Total3944.38 *Note: ‘Factor’ denotes between-cluster variation and ‘Error’ denotes within cluster variation

44
ANOVA Method

45
Selecting the Sample Size for Estimating Population Means and Totals

46
Sample Size for Estimating Population Means Where is estimated by

47
Example of Sample Size for Estimating Population Means How large a sample should be taken to estimate the average per-capita income with a bound on the error of estimation of B = $500?

48
Example of Sample Size for Estimating Population Means *Note: Because M is not known, is estimated by

49
Example of Sample Size for Estimating Population Means

50
Sample Size for Estimating Population Totals When M is Known Where is estimated by

51
Example of Sample Size for Estimating Population Totals When M is Known How large a sample should be taken to estimate the total income of all residents with a bound on the error of estimation of B = $1,000,000? (M = 2,500)
.")
52
Sample Size for Estimating Population Totals When M is Known

53
Sample Size for Estimating Population Totals When M is Unknown Where is estimated by

54
Example of Sample Size for Estimating Population Totals When M is Unknown How large a sample should be taken to estimate the total income of all residents with a bound on the error of estimation of B = $1,000,000? (M = 2,500)
.")
55
Sample Size for Estimating Population Totals When M is Unknown

Similar presentations


>")


