Download presentation
Presentation is loading. Please wait.

1
Population Dynamics Chapter 6 Populations
AP Environmental Science GNHS

2
4 types of Population Fluxes
Population flux – changes in pops over time. Advantage: Allows vegetation and organism reproduction time to recover Types: 1) stable 3) irregular 2) irruptive 4) cyclic
 stable 3) irregular. 2) irruptive 4) cyclic.")
3
Stable Pop Flux Pop fluctuates around carrying capacity
either slightly above or below Typical of species in undisturbed tropical forests…little variation in average temp or rainfall.

4
Stable Pop Flux Example

5
Irruptive Pop Flux Pop is normally stable but occasionally explodes (erupts) to peak and then crashes to stable lower level. Ex: Racoon, house mouse

6
Irruptive Pop Flux

7
Irregular Pop Flux Chaotic behavior in population size
No recurring pattern May be due to: chaos in ecosystem

8
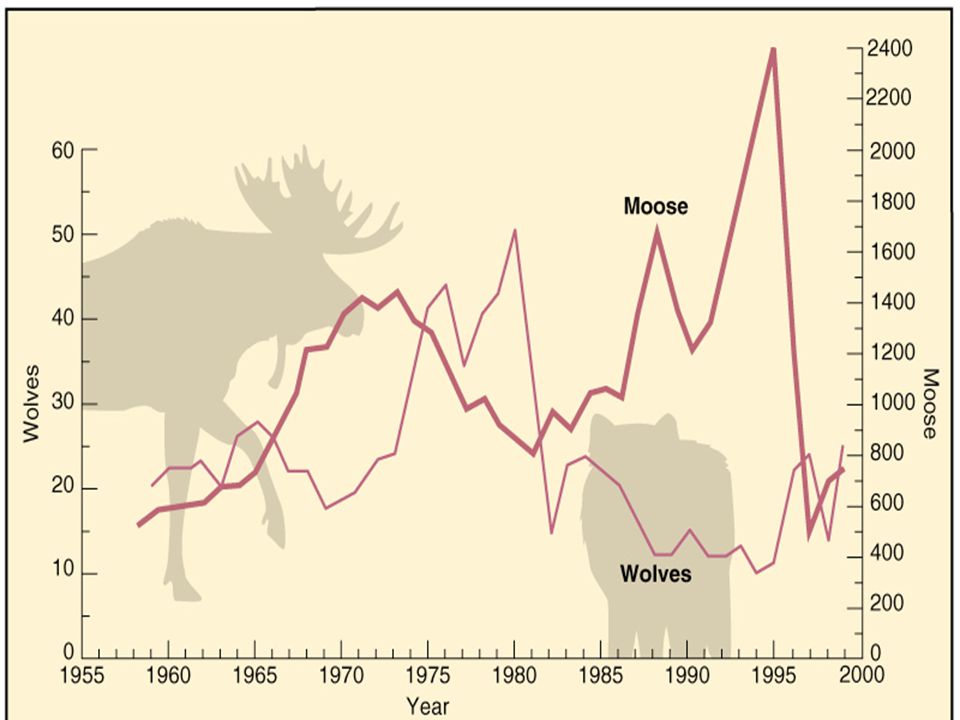
Cyclic Pop Flux Fluctuations in size that occur over a regular time period. Includes predator-prey (lynx and hare)
 .")
10
Population Dynamics Outline
Characteristics of a Population Population Dynamics and Carrying Capacity Reproductive Strategies Conservation Biology Human Impacts Working with Nature

11
Characteristics of a Population
Population - individuals inhabiting the same area at the same time and can interbreed. Population Dynamics: Population change due to Population Size - number of individuals Population Density - population size in a certain space at a given time Population Dispersion - spatial pattern in habitat Age Structure - proportion of individuals in each age group in population

12
Population Size Natality Mortality
Number of individuals added through reproduction Crude Birth Rate - Births per 1000 Total Fertility Rate – Average number of children born alive per woman in her lifetime Mortality Number of individuals removed through death Crude Death Rate Deaths per 1000

13
Population Growth Populations show two types of growth Exponential
J-shaped curve Growth is independent of population density Logistic S-shaped curve Growth is not independent of population density

14
Population Growth – “Mathway”
Benefits: Prediction of future generations Creation of population trends Assists in determining type of growth: exponential or logistics

15
Population Growth - Mathway
Basic variables of population growth N=population number r = rate of growth t = Time in days, months, years, generations d = ‘delta” or change in (ex. dN = change in population) K = carrying capacity
 K = carrying capacity")
16
Zero Population Growth
Population growth depends upon birth rates death rates immigration rates (into area) emigration rates (exit area) Pop = Pop0 + (b + i) - (d + e) Zero Population Growth (b + i) = (d + e)
 emigration rates (exit area) Pop = Pop0 + (b + i) - (d + e) Zero Population Growth. (b + i) = (d + e)")
17
How is “r” determined? r = births – deaths Total Population (rN)
Does not include immigration or emigration! Example: 20,000 births – 15,000 deaths 500,000 organisms Growth Rate (r) = .01 (x 100) = 1.0%
 = .01 (x 100) = 1.0%")
18
Exponential Growth Model (J)
")
19
Growth Rate Example What type of growth is this?
Time N Rate (r) r x N T1 2 10 20 T2 200 T3 2000 T5 20,000
 r x N. T T T T5. 20,000.")
20
J-curve – Exponential Growth

21
Population Growth Rate Practice

22
Exponential Growth Time N r r x N 10 1.5 15 1 23 2 35 3 53 4 80 5 120
10 1.5 15 1 23 2 35 3 53 4 80 5 120 6 180

24
Exponential Growth Rules: If r ˂ 0, then dN is negative and population is declining. If r > 0, then dN is positive and population increases over time If r = 0, then dN is 0 → no change in population

25
Logistics Growth Model (S)
")
26
Logistics Growth Solve for the right side of the equation.
You must know your carrying capacity (K) Example; Look at the N/K part. If K=100 wolves, the maximum pop If N =100 wolves, then N/K = 100 = 1 100
 Example; Look at the N/K part. If K=100 wolves, the maximum pop. If N =100 wolves, then N/K = 100 =")
27
Logistics (cont) If 1-N/K = 1-1 = 0 and rN (0) = 0 and dN/dt = 0.
This means no change in population because the population = carrying capacity. 6. What if N=50 and K=100, please calculate the outcome using the formula.

28
Logistics (cont) Then N/K = 50/100 = ½. 1-N/K = 1-1/2 = ½
Rate of increase is ½ rN or half of the reproductive rate. Try it with N=120 and K=100, what is the reproductive rate going to be?

29
Logistics Growth from Model

30
Population Density Population Density (or ecological population density) is the amount of individuals in a population per unit habitat area Some species exist in high densities - Mice Some species exist in low densities - Mountain lions Density depends upon social/population structure mating relationships time of year

31
Population Doubling Rule of 70 – used for determining how long it takes for a population to double. If a population grows at a rate of 7%, how long would it take to double? 70%, 70 / doubling = = 10 = r (% form) = rr (decimal form) , yrs. THIS IS THE DOUBLING TIME OF A POPULATION!!! is. It states that to find the doubling time of a quantity growing at a given annual percentage rate, divide the percentage number into 70 to r
 = rr (decimal form) ,.07 yrs. THIS IS THE DOUBLING TIME OF A POPULATION!!! is. It states that to find the doubling time of a quantity growing at a given annual percentage rate, divide the percentage number into 70 to r.")
32
Population Dispersion
Population dispersion is the spatial pattern of distribution There are three main classifications Clumped: individuals are lumped into groups ex. Flocking birds or herbivore herds due to resources that are clumped or social interactions most common

33
Population Dispersion
Uniform: Individuals are regularly spaced in the environment - ex. Creosote bush due to antagonism between individuals, or do to regular spacing of resources rare because resources are rarely evenly spaced tips/2002/clover611.htm Random: Individuals are randomly dispersed in the environment ex. Dandelions due to random distribution of resources in the environment, and neither positive nor negative interaction between individuals rare because these conditions are rarely met

34
Age Structure The age structure of a population is usually shown graphically The population is usually divided up into prereproductives, reproductives and postreproductives The age structure of a population dictates whether is will grow, shrink, or stay the same size

35
Age Structure Diagrams
Positive Growth Zero Growth Negative Growth (ZPG) Pyramid Shape Vertical Edges Inverted Pyramid
 Pyramid Shape Vertical Edges Inverted Pyramid.")
36
Population Dynamics Outline
Characteristics of a Population Population Dynamics and Carrying Capacity Reproductive Strategies Conservation Biology Human Impacts Working with Nature

38
Environmental Resistance
Biotic Potential factors allow a population to increase under ideal conditions, potentially leading to exponential growth Environmental Resistance affect the young more than the elderly in a population, thereby affecting recruitment (survival to reproductive age)
")
39
Biotic Potential Ability of populations of a given species to increase in size Abiotic Contributing Factors: Favorable light Favorable Temperatures Favorable chemical environment - nutrients Biotic Contributing Factors: Reproductive rate Generalized niche Ability to migrate or disperse Adequate defense mechanisms Ability to cope with adverse conditions

40
Environmental Resistance
Ability of populations of a given species to increase in size Abiotic Contributing Factors: Unfavorable light Unfavorable Temperatures Unfavorable chemical environment - nutrients Biotic Contributing Factors: Low reproductive rate Specialized niche Inability to migrate or disperse Inadequate defense mechanisms Inability to cope with adverse conditions

42
Exponential Growth As early as Darwin, scientists have realized that populations have the ability to grow exponentially All populations have this ability, although not all populations realized this type of growth Darwin pondered the question of exponential growth. He knew that all species had the potential to grow exponentially He used elephants as an example because elephants are one of the slowest breeders on the planet

43
Exponential Growth 19,000,000 elephants!!!
One female will produce 6 young over her 100 year life span. In a population, this amounts to a growth rate of 2% Darwin wondered, how many elephants could result from one male and one female in 750 years? 19,000,000 elephants!!!

44
Exponential Growth Graph

45
Population Dynamics and Carrying Capacity
Basic Concept: Over a long period of time, populations of species in an ecosystem are usually in a state of equilibrium (balance between births and deaths) There is a dynamic balance between biotic potential and environmental resistance
 There is a dynamic balance between biotic potential and environmental resistance.")
46
Carrying Capacity (K) Exponential curve is not realistic due to carrying capacity of area Carrying capacity is maximum number of individuals a habitat can support over a given period of time due to environmental resistance (sustainability)
")
48
Logistic Growth Because of Environmental Resistance, population growth decreases as density reaches carrying capacity Graph of individuals vs. time yields a sigmoid or S-curved growth curve Reproductive time lag causes population overshoot Population will not be steady curve due to resources (prey) and predators
 and predators.")
51
Population Dynamics Outline
Characteristics of a Population Population Dynamics and Carrying Capacity Reproductive Strategies Conservation Biology Human Impacts Working with Nature

52
Reproductive Strategies
Goal of every species is to produce as many offspring as possible Each individual has a limited amount of energy to put towards life and reproduction This leads to a trade-off of long life or high reproductive rate Natural Selection has lead to two strategies for species: r - strategists and K - strategists

53
r - Strategists Spend most of their time in exponential growth
Maximize reproductive life Minimum life K

54
R Strategists Many small offspring
Little or no parental care and protection of offspring Early reproductive age Most offspring die before reaching reproductive age Small adults Adapted to unstable climate and environmental conditions High population growth rate – (r) Population size fluctuates wildly above and below carrying capacity – (K) Generalist niche Low ability to compete Early successional species
 Population size fluctuates wildly above and below carrying capacity – (K) Generalist niche. Low ability to compete. Early successional species.")
55
K - Strategists Maintain population at carrying capacity (K)
Maximize lifespan K

56
K- Strategist Fewer, larger offspring
High parental care and protection of offspring Later reproductive age Most offspring survive to reproductive age Larger adults Adapted to stable climate and environmental conditions Lower population growth rate (r) Population size fairly stable and usually close to carrying capacity (K) Specialist niche High ability to compete Late successional species
 Population size fairly stable and usually close to carrying capacity (K) Specialist niche. High ability to compete. Late successional species.")
57
Survivorship Curves Late Loss: K-strategists that produce few young and care for them until they reach reproductive age thus reducing juvenile mortality Constant Loss: typically intermediate reproductive strategies with fairly constant mortality throughout all age classes Early Loss: r-strategists with many offspring, high infant mortality and high survivorship once a certain size and age

59
Population Dynamics Outline
Characteristics of a Population Population Dynamics and Carrying Capacity Reproductive Strategies Conservation Biology Human Impacts Working with Nature

60
Conservation Biology Careful and sensible use of natural resources by humans Originated in 1970s to deal with problems in maintaining earth's biodiversity Dedicated to protecting ecosystems and to finding practical ways to prevent premature extinctions of species

61
Conservation Biology Three Principles
Biodiversity and ecological integrity are useful and necessary to all life on earth and should not be reduced by human actions Humans should not cause or hasten the premature extinction of populations and species or disrupt vital ecological processes Best way to preserve earth’s biodiversity and ecological integrity is to protect intact ecosystems that provide sufficient habitat

62
Habitat Fragmentation
Process by which human activity breaks natural ecosystems into smaller and smaller pieces of land Greatest impact on populations of species that require large areas of continuous habitat Also called habitat islands

64
Habitat fragmentation in northern Alberta
Habitat fragmentation in northern Alberta

65
Population Dynamics Outline
Characteristics of a Population Population Dynamics and Carrying Capacity Reproductive Strategies Conservation Biology Human Impacts Working with Nature

66
Human Impacts Fragmentation and degrading habitat
Simplifying natural ecosystems Strengthening some populations of pest species and disease-causing bacteria by overuse of pesticides Elimination of some predators

67
Human Impacts Deliberately or accidentally introducing new species
Overharvesting potentially renewable resources Interfering with the normal chemical cycling and energy flows in ecosystem

68
Population Dynamics Outline
Characteristics of a Population Population Dynamics and Carrying Capacity Reproductive Strategies Conservation Biology Human Impacts Working with Nature

69
Working with Nature Learn six features of living systems
Interdependence Diversity Resilience Adaptability Unpredictability Limits

70
Basic Ecological Lessons
Sunlight is primary source of energy Nutrients are replenished and wastes are disposed of by recycling materials Soil, water, air, plants and animals are renewed through natural processes Energy is always required to produce or maintain an energy flow or to recycle chemicals

71
Basic Ecological Lessons
Biodiversity takes many forms because it has evolved over billions of years under different conditions Complex networks of + and – feedback loops exist Population size and growth rate are controlled by interactions with other species and with abiotic Organisms generally only use what they need

72
Four Principles for Sustainable
We are part of, not apart from, the earth’s dynamic web of life. Our lives, lifestyles, and economies are totally dependent on the sun and the earth. We can never do merely one thing (first law of human ecology – Garret Hardin). Everything is connected to everything else; we are all in it together.
. Everything is connected to everything else; we are all in it together.")
Similar presentations


 that live in the same place at the same time and compete for the same resources. Resources.>")


