Download presentation
Presentation is loading. Please wait.

1
1. All:Take out your BLUE PRINT 2. Runners: go get workbooks for your group 3. Begin Warm Up: Workbook p. 18 (10-14) 4. DEAR when you are done
 4. DEAR when you are done.")
2
Warm Up Answers: WB p. 18 10) $49.99 +.35m = phone bill (“b”) 11) y = x + 5 (600 mins) + (150) = 750 used 49.99 +.35(150) = b12) y = 4x 49.99 + 52.50 = b $102.49 = b13) y = 3x + 1 14a) 45m = w (m- # minutes, w- #words total) 14b) 45(25) = w 1,125 = w 14c) 45m = w 45m = 20,025 m = 445 minutes ~7.4 hours # Correct 7
 $ m = phone bill ( b ) 11) y = x + 5 (600 mins) + (150) = 750 used (150) = b12) y = 4x = b $ = b13) y = 3x a) 45m = w (m- # minutes, w- #words total) 14b) 45(25) = w 1,125 = w 14c) 45m = w 45m = 20,025 m = 445 minutes ~7.4 hours # Correct 7.")
3
Scale Model Project Info… Your BLUE PRINT should be complete as of today 2 weeks until FINAL MODEL is due to display Remember the plaque Remember to do the reflection questions— EVERY PERSON must do this Keep in mind: cost, mobility, difficulty, accuracy GOOD LUCK!

4
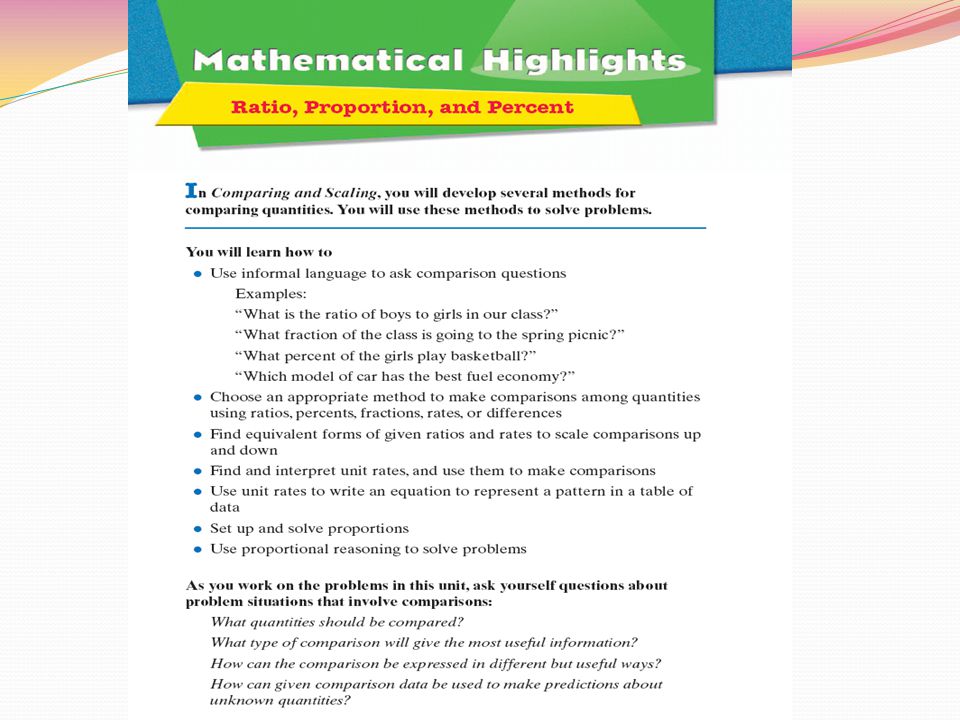
WE START A NEW BOOK TODAY CALLED “Comparing and Scaling” Abbreviation we will use: C&S Problem numbers start over (back to Problem 1.1) Remember to title the tops of your pages correctly: First and Last name Date Problem # ACE #’s Mark your new section of the textbook with a sticky note or book mark to help you
 Remember to title the tops of your pages correctly: First and Last name Date Problem # ACE #’s Mark your new section of the textbook with a sticky note or book mark to help you")
5
Make sure your notebook cover sheet looks like this… #. Date Book/ Brief Description 1.10-19S&SProblem 4.2, ACE 2, 5-8, 27 2. 10-20S&SProblem 4.3, ACE 9-11 3.10-31 S&SProblem 5.1, ACE 1, 2, 6-21 4. 11-1S&SProblem 5.2, ACE 3, 4, 22-24 5.11-2 S&SProblem 5.3, ACE 5, 32-34 6.11-7C&SProblem 1.1, ACE 1-3, 15, 16, 34 You need: Calculator & Lab sheet 1.1 Big Idea: Using Ratios to make comparisons Book: Comparing and Scaling page 2

9
LAUNCH… Can you think of any commercials that compare one product to another—or several others? Youtube: Pepsi vs. Coke http://www.youtube.com/watch?v=EMo6o0BtFG8 http://www.youtube.com/watch?v=EMo6o0BtFG8 Can you think of any that involve a comparison using numbers? Youtube: Denta Stix http://www.youtube.com/watch?v=vFPDaQrPjus http://www.youtube.com/watch?v=vFPDaQrPjus Youtube: Trident http://www.youtube.com/watch?v=E8OinQfUa6Y&feature=related http://www.youtube.com/watch?v=E8OinQfUa6Y&feature=related

12
Think about these questions in your groups for a few minutes: 1)What do you know from each form of comparison given? 2)What info is missing from each form of comparison? 3)Is each form accurate and effective?
What info is missing from each form of comparison. 3)Is each form accurate and effective .")
13
1.The actual results of the survey. 2. Difference, 17139 - 11426 = 5713 3. 60% means 60 out of every 100 people would prefer Bolda Cola. 4. 3 to 2, means if you asked 5 people, 3 would prefer Bolda Cola and 2 would prefer Cola Nola.

14
What did you say…?

15
Yes. 1) 17139 & 11426 are the actual numbers 2) 17139 - 11426 = 5713 3) 17139 + 11426 = 28565, so… “60% of people surveyed like Bolda Cola”.60 * 28565 = 17139 4) 17139 to 11426 = 3 to 2 17139 = 1.5 and 3 = 1.5 60 = 1.5 11426 2 40 NOTICE! 60% = 60 = 6 = 3 NOT 3 100 10 5 2 * Remember to ask yourself if you are comparing part-to-part or part-to-whole in this unit!, 17139/28565 =.6 x 100 = 60%.
 & are the actual numbers 2) = ) = 28565, so… 60% of people surveyed like Bolda Cola .60 * = ) to = 3 to = 1.5 and 3 = = NOTICE. 60% = 60 = 6 = 3 NOT * Remember to ask yourself if you are comparing part-to-part or part-to-whole in this unit!, 17139/28565 =.6 x 100 = 60%..")
16
1.5 times as many people liked Bolda Cola to Cola Nola. Three-fifths (3/5) of people surveyed preferred Bolda Cola. 3 out of every 5 people surveyed prefer Bolda Cola. 17139 people out of 28565 people prefer Bolda Cola.
 of people surveyed preferred Bolda Cola. 3 out of every 5 people surveyed prefer Bolda Cola people out of people prefer Bolda Cola..")
17
600 would like Bolda Cola and 400 would like Cola Nola because… 60% of 1000 = 60040% of 1000 = 400.60 (1000) = 600.40 (1000) = 400 60% + 40% = 100% Bolda Cola + Cola Nola = All people surveyed
 = (1000) = % + 40% = 100% Bolda Cola + Cola Nola = All people surveyed")
18
Summary… From the first statement, can you tell how many people took the survey? (Yes. Add them together; 28565 people) How is statement 2 related to statement 1? (It is the difference of the Bolda and Nola) If you only had statement 2, could you tell how many people were originally surveyed? (No.) Does statement 2 give you a sense of the strength of the preference? (No. Consider if 15,000 were surveyed compared to if 500,000 were surveyed!) Does knowing 60% preferred Bolda give a sense of comparison? (Yes. It tells the comparison regardless of how many were surveyed. But, you have to still ask yourself if it really represent the entire population!) Do you know from statement 3 how many were surveyed? (No.) Do you know from statement 4 how many were surveyed? (No.)
 How is statement 2 related to statement 1. (It is the difference of the Bolda and Nola) If you only had statement 2, could you tell how many people were originally surveyed. (No.) Does statement 2 give you a sense of the strength of the preference. (No. Consider if 15,000 were surveyed compared to if 500,000 were surveyed!) Does knowing 60% preferred Bolda give a sense of comparison. (Yes. It tells the comparison regardless of how many were surveyed. But, you have to still ask yourself if it really represent the entire population!) Do you know from statement 3 how many were surveyed. (No.) Do you know from statement 4 how many were surveyed. (No.).")
19
EXTENSION… Work on Transparency 1.1 B 1) A ratio of 5 to 4 means that for every 5 girls in the class there are 4 boys. 2) 56% means that if there were 100 students in class, 56 of them would be girls. 3) Four-nnths means that out of every 9 students in class, 4 are boys. 4) Yes, they are all equaivalent statements. A ratio of 5 girls to 4 boys means 5 out of 9 are girls and 4 out of 9 are boys. 5/9 = 55.5555….% which is about 56%. 5) No, none of the statements tells you the exact number of girls, boys, or total.)
 56% means that if there were 100 students in class, 56 of them would be girls. 3) Four-nnths means that out of every 9 students in class, 4 are boys. 4) Yes, they are all equaivalent statements. A ratio of 5 girls to 4 boys means 5 out of 9 are girls and 4 out of 9 are boys. 5/9 = ….% which is about 56%. 5) No, none of the statements tells you the exact number of girls, boys, or total.).")
20
Make sure your notebook cover sheet looks like this… #. Date Book/ Brief Description 1.10-19S&SProblem 4.2, ACE 2, 5-8, 27 2. 10-20S&SProblem 4.3, ACE 9-11 3.10-31 S&SProblem 5.1, ACE 1, 2, 6-21 4. 11-1S&SProblem 5.2, ACE 3, 4, 22-24 5.11-2 S&SProblem 5.3, ACE 5, 32-34 6.11-7C&SProblem 1.1, ACE 1-3, 15, 16, 34

Similar presentations