Download presentation
Presentation is loading. Please wait.

1
P.1 Graphs and Models x-2012 f(x)
")
2
P.1 Graphs and Models

3
P. 5

4
P.1 Graphs and Models P. 5

5
P.1 Graphs and Models P. 5

6
P.1 Graphs and Models P. 5

7
P.1 Graphs and Models

8
Graphs and Models 1.The graph of an equation in x and y is symmetric with respect to the y- axis if replacing x by –x yields an equivalent equation. 2.The graph of an equation in x and y is symmetric with respect to the x- axis if replacing y by –y yields an equivalent equation. 3.The graph of an equation in x and y is symmetric with respect to the origin if replacing x by –x and y by –y yields an equivalent equation. ProblemProblem 1Problem 2

9
P.1 Graphs and Models p. 6

10
P.1 Graphs and Models p. 6

11
P.1 Graphs and Models p. 6

12
P.1 Graphs and Models Tests for Symmetry

13
y02 f(y)15
15")
14
P.1 Graphs and Models Put in quadratic form. Factor

15
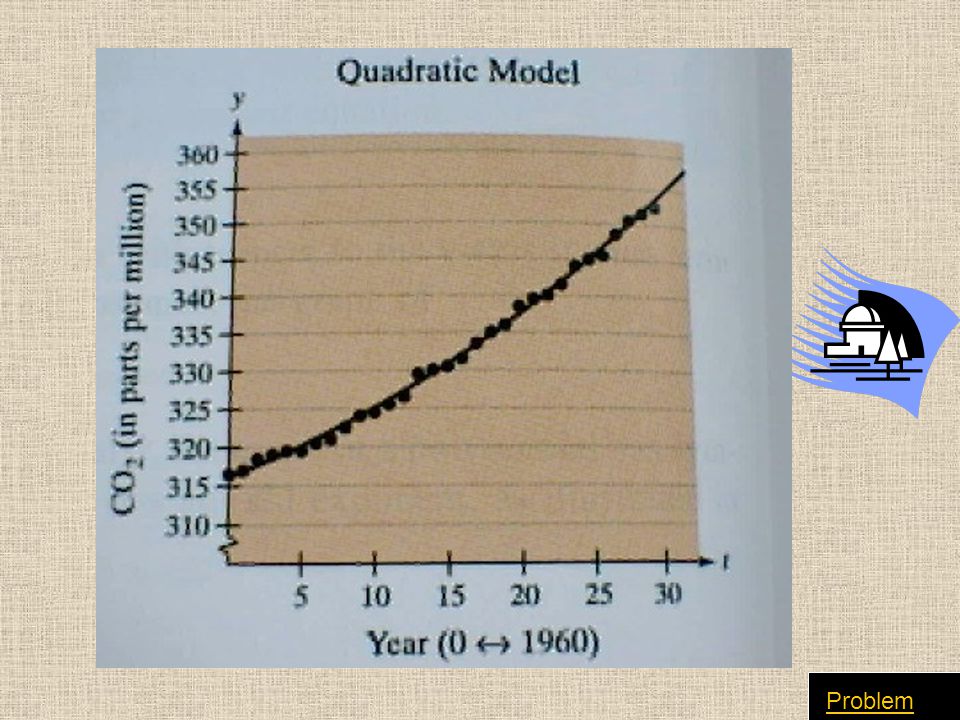
Graphs and Models Real-life applications of mathematics often use equations as mathematical models. In developing a mathematical model to represent actual data, you should strive for two (often conflicting) goals: accuracy and simplicity. That is, you want the model to be simple enough to be workable, yet accurate enough to produce meaningful results.
 goals: accuracy and simplicity. That is, you want the model to be simple enough to be workable, yet accurate enough to produce meaningful results..")
16
Between 1960 and 1990, the Mauna Loa Observatory in Hawaii recorded the carbon dioxide concentration y (in parts per million) in the earth’s atmosphere. The January readings for each year are shown. In the first graph, a linear model has been fitted to the data y = 313.6 + 1.24t Where t = 0 represents 1960. In the second graph, a quadratic model has been fitted to the data y = 316.2 +.70t + 0.018t 2 Which model better represents the data? In the July 1990 issue of Scientific American, these data were used to predict the carbon dioxide level in earth’s atmosphere in the year 2035. The prediction was 470 parts per million. Which, if either, of the two models could have been used to make this prediction? Linear ModelQuadratic Model Calc.

17
Problem

20
P.1 Graphs and Models

Similar presentations


 September 5th, 2012. I. The Graph of an Equation Ex. 1: Sketch the graph of y = (x - 1) 2 - 3.>")


