Download presentation
Presentation is loading. Please wait.

1
Prevention and Screening MMS Year 4 Public Health Workshop in O&G

2
Why is prevention better than cure? Hygieia – goddess of health

3
McKeowan (1979) and Illich (1976) Personal medical care has contributed relatively little to the improvements in mortality since 1800sPersonal medical care has contributed relatively little to the improvements in mortality since 1800s
 and Illich (1976) Personal medical care has contributed relatively little to the improvements in mortality since 1800sPersonal medical care has contributed relatively little to the improvements in mortality since 1800s")
4
Medical care Bunker 1995Bunker 1995 –Only 2 years of the 23 years increase in longevity is due to medical intervention between 1900- 1950 –But since 1950, 3 out of the 7 years increased life expectancy –Why?

5
Prevention Primary prevention – –Stopping a disease from occurring (incidence) Secondary prevention – –Detecting a disease early to allow early intervention to reduce mortality and morbidity Tertiary Prevention – –Stopping the recurrence or complications of a disease
 Secondary prevention – –Detecting a disease early to allow early intervention to reduce mortality and morbidity Tertiary Prevention – –Stopping the recurrence or complications of a disease")
6
Why do we do them? IntuitiveIntuitive CostCost BenefitBenefit –Quality of life –Morbidity –Mortality So why don’t we do them for everything?So why don’t we do them for everything?

7
Why don’t we do them CostCost BenefitBenefit –Evidence based Early detectionEarly detection TreatmentTreatment Ethical (Abdominal Aortic Aneurysm)Ethical (Abdominal Aortic Aneurysm) IntuitiveIntuitive –Persuasion –Side effects (pertussis) –Harm (MMR, psychological) Risk no longer existsRisk no longer exists
Ethical (Abdominal Aortic Aneurysm) IntuitiveIntuitive –Persuasion –Side effects (pertussis) –Harm (MMR, psychological) Risk no longer existsRisk no longer exists")
8
TASK: WHY DO YOU WEAR A SEATBELT?

9
Prevention Paradox Rose 1981 – –“A preventative measure that brings large benefits to the community offers little to each participating individual.”

10
Secondary/Tertiary Prevention

11
Screening: doing more good than harm Mission of the National Screening Committee

12
What is screening? ‘Healthy’ population Asked a question or offered a test Identifies individuals who are more likely to be helped than harmed by further tests or treatment to reduce the risk of a disease or its complications

13
Limitations of Screening Ethical differences from clinical practice for people who present with symptoms Should help individuals to make informed choices about their health Risks as well as benefits

14
TASK: What screening programmes are NHS funded? Rapid list on the whiteboard

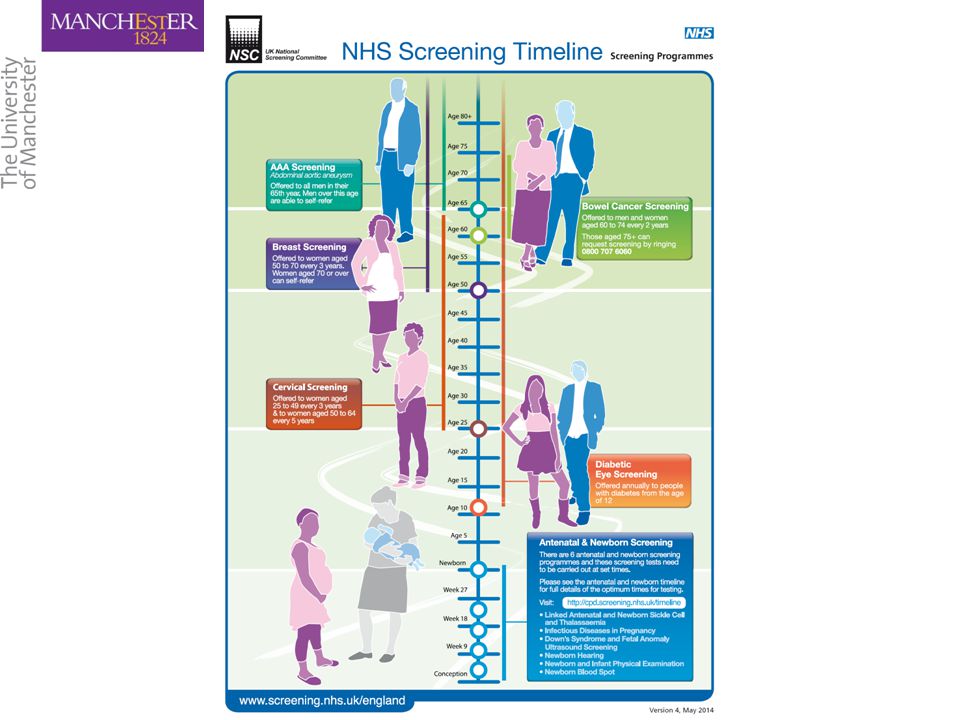
16
Animation http://cpd.screening.nhs.uk/timelinehttp://cpd.screening.nhs.uk/timeline

17
Criteria for Screening Programmes Ideally all criteria should be met!

18
The Condition Important health problem Natural history understood – –development from latent to declared disease – –detectable risk factor – –disease marker Cost-effective primary prevention interventions implemented Carriers identified as a result of screening – –natural history of this status understood psychological implications

19
The Test Validated screening test – –Simple – –Safe – –Precise Test values in the target population known – –suitable cut-off level defined and agreed Acceptable to the population Agreed investigation if positive test – –With choices For mutations – –the criteria for subset of mutations to be covered

20
The Treatment Effective treatment or intervention – –evidence of early treatment leading to better outcomes Evidence based policies covering – –individuals should be offered treatment – –appropriate treatment to be offered Clinical management and patient outcomes should be optimised

21
The Screening Programme Randomised Controlled Trials – –effective in reducing mortality or morbidity – –evidence from trials for informed decision making that the test accurately measures risk Acceptable to professionals and the public – –Clinically – –Socially – –Ethically – –Benefit outweigh the physical and psychological harm Opportunity cost – –value for money

22
The Screening Programme Plan for managing and monitoring programme – –quality assurance standards Adequate staffing and facilities All other options considered – –more cost effective intervention? Evidence-based info allowing informed choice – –consequences of testing – –investigation and treatment Anticipate public pressure – –widening the eligibility criteria – –reducing the screening interval

23
Sensitivity The proportion of truly diseased patients in the screened population who are identified as diseased by the screening test.The proportion of truly diseased patients in the screened population who are identified as diseased by the screening test. – –The probability of correctly diagnosing a case True positive rate

24
Specificity The proportion of truly non- diseased persons who are so identified by the screening test.The proportion of truly non- diseased persons who are so identified by the screening test. – –The probability of correctly identifying a non-diseased person with a screening test True negative rate – –This is what a clinician or the patient wants to know

27
Example 1 Has Disease No Disease Test Positive 2010 Test Negative 80890

28
Answer SensitivitySensitivity 20/10020/100 0.20.2 20%20% Specificity 890/900 0.99 99%

29
Example 2 Has Disease No Disease Test Positive 805 Test Negative 20895

30
Answer SensitivitySensitivity 80/10080/100 0.20.2 80%80% SpecificitySpecificity 895/900895/900 0.990.99 99%99%

31
Positive Predictive Value The probability that a person with a positive test is a true positiveThe probability that a person with a positive test is a true positive – –Does have the disease – –This is what a clinician or the patient wants to know

32
Negative Predictive Value The probability that a person with a negative test is a true negativeThe probability that a person with a negative test is a true negative – –Does not have the disease

33
Positive Predictive Value = a/ (a+b) Negative Predictive Value = d/(c+d)
 Negative Predictive Value = d/(c+d)")
35
Example 3 Has Disease No Disease Test Positive 2010 Test Negative 80890

36
Answer PPVPPV 20/3020/30 0.670.67 67%67% NPV 890/970 0.92 92%

37
Example 4 Has Disease No Disease Test Positive 805 Test Negative 20895

38
Answer PPVPPV 80/8580/85 0.940.94 94%94% NPVNPV 895/915895/915 0.970.97 97%97%

Similar presentations


 Benefits (evidence) Cost Cost Does it fit wilson’s.>")