Download presentation
Presentation is loading. Please wait.

1
John R. Kasich, GovernorJerry Wray, Director “Big Data & Asset Management” Ohio Planning Conference 2014

2
www.transportation.ohio.gov John R. Kasich, GovernorJerry Wray, Director Ohio Department of Transportation Big Data: Asset Management Andrew Williams, Administrator Office of Technical Services

3
Big Data Big data is a collection of large data sets so large and complex that it becomes difficult to process using on-hand database management tools. More data tends to lead to more accuracy. More accurate analyses may lead to more confident decision making. And better decisions can mean greater operational efficiencies, cost reductions and reduced risk.

4
The four dimensions of use Aspects of the way in which users want to interact with their data… Totality: Users have an increased desire to process and analyze all available data Exploration: Users apply analytic approaches where the schema is defined in response to the nature of the query Frequency: Users have a desire to increase the rate of analysis in order to generate more accurate and timely business intelligence Dependency: Users’ need to balance investment in existing technologies and skills with the adoption of new techniques

5
Data Cycle

6
Asset Management Video Click link below to watch Asset Management Video on YouTube: http://www.dot.state.oh.us/Divisions/Planning/Conference/Pages/ Big-Data-Video.aspx

7
www.transportation.ohio.gov John R. Kasich, GovernorJerry Wray, Director Ohio Department of Transportation Managing Big Data – with GIS Dave Blackstone Transportation Information Management Section / Office of Technical Services

8
County Boundaries

10
Township Boundaries

12
City Boundaries

14
Urban Boundaries

16
State Route System (19,467 miles)
")
17
State (19,467) & County (28,973)
 & County (28,973)")
18
State (19,467), County (28,973) & Township (41,530)
, County (28,973) & Township (41,530)")
19
State (19,467), County (28,973), Township (41,530) & Muni (31,664)
, County (28,973), Township (41,530) & Muni (31,664)")
20
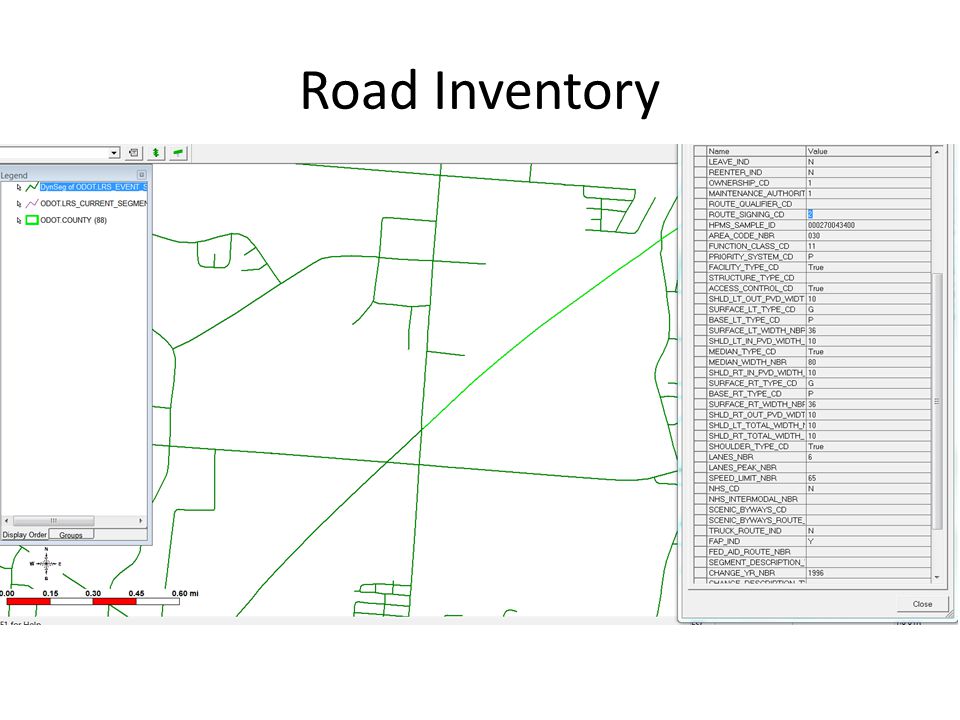
Road Inventory

22
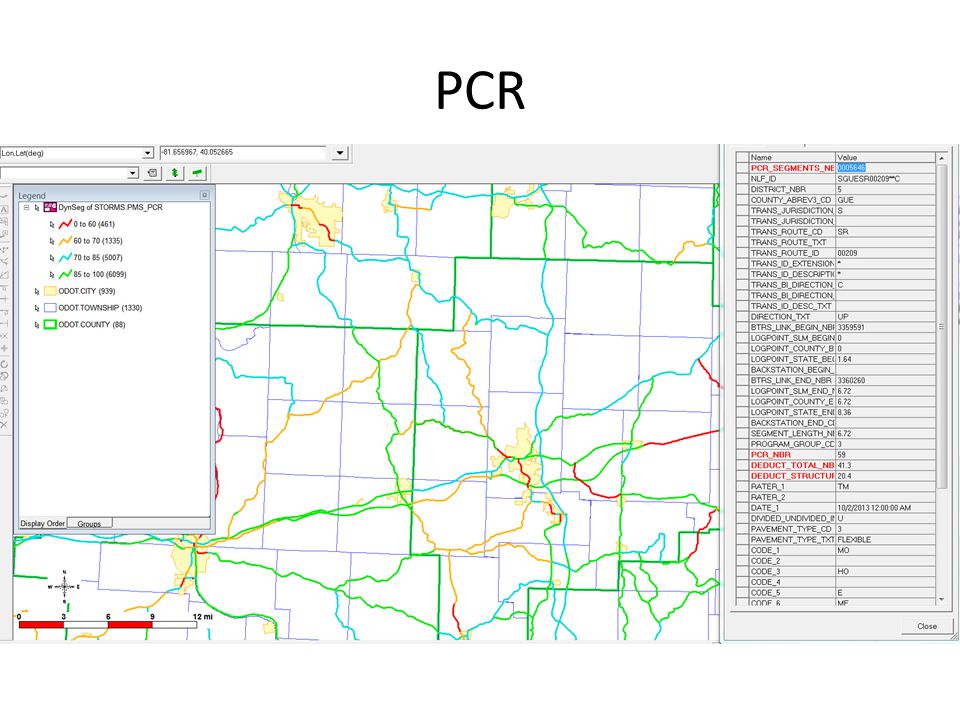
PCR

24
ELLIS 2014 - 2016

26
ELLIS

28
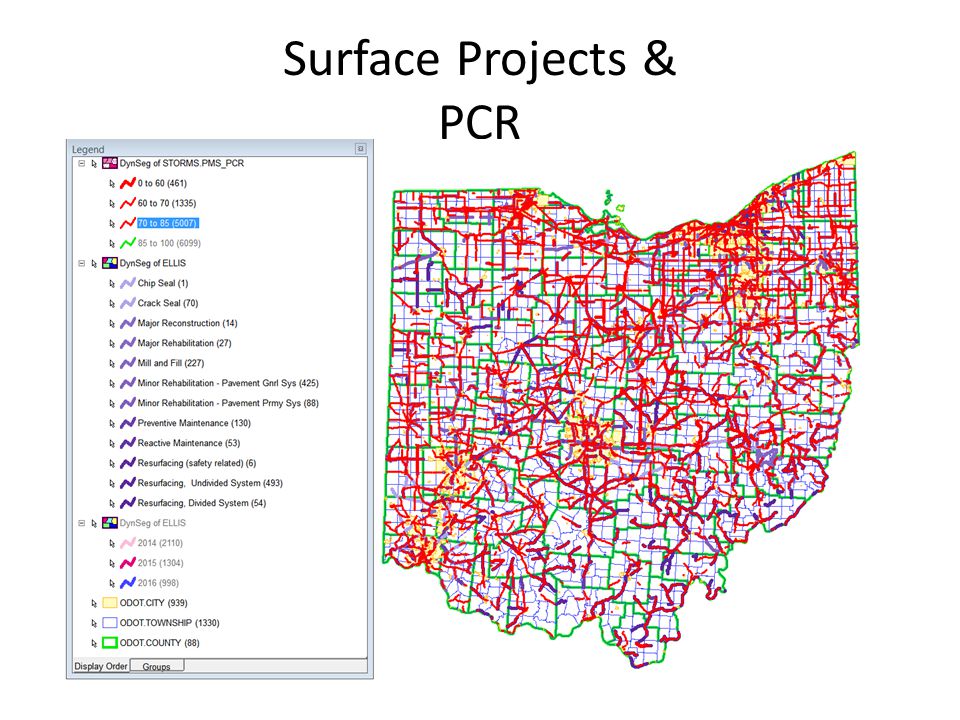
Surface Projects & PCR

30
Bridges

31
Bridges by System

32
Bridges by GA

33
Bridges

34
Bridges & OSIP Imagery

35
Rail Lines

36
Rail Crossings

37
Airports

38
Intermodal

39
Crashes - 2013

41
Crashes by Severity

42
ADT

43
Underground Mines

45
Underground Mines & Road Segments

46
Road Section & Mines

47
PCR

48
ADT

49
Crash

50
ADT-PCR-Crash

51
Number of Crashes/Segment

52
Crash Rate

53
Contact Information Dave Blackstone Office of Technical Services Transportation Information Management Section 614-466-2594 dave.blackstone@dot.state.oh.us http://www.dot.state.oh.us/Divisions/Planning/ TechServ/Pages/default.aspx

54
www.transportation.ohio.gov John R. Kasich, GovernorJerry Wray, Director Ohio Department of Transportation Big Data – It All “Counts” Dave Gardner Traffic Monitoring Section / Office of Technical Services

55
Traffic Monitoring Section

56
Traffic Monitoring Program Count Programming Data Collection Data Processing & Editing Reporting

57
ODOT Count Program Where do we (ODOT) collect traffic data? 3 – Year Cycle –State System Roads (Interstate, US, and State Routes) –14,200 6-Year Cycle (Local Roads) –HPMS Universe Counts – 4,200 –Safety – 3,700 –Modeling – 5,500 Additional Counts Received from –County Engineers – 6,200 –MPOs – 12,000 Total Program Counts – 45,800
 –14,200 6-Year Cycle (Local Roads) –HPMS Universe Counts – 4,200 –Safety – 3,700 –Modeling – 5,500 Additional Counts Received from –County Engineers – 6,200 –MPOs – 12,000 Total Program Counts – 45,800.")
58
Data Collection - Types of Counts Portable Vehicle Classification Counts Portable Vehicle Volume Counts Manual Intersection Turning Movement Counts Permanent Traffic Counter Weigh-In-Motion (WIM)
")
59
ODOT Count Program How do we (ODOT) collect traffic data? Short Term Counts –ODOT - Collected by 3 Consultants Statewide –Local Agency Coordination – Have acquired close 18,000 counts from the county engineers and MPOs.

60
ODOT Count Program How do we (ODOT) collect traffic data? Permanent Counts – ODOT/Contractor Maintained

61
ODOT Count Data Processing (Current) Short Term Counts -VB.net application/Access Database Permanent Counts -Traffic Keeper Ohio (TKO) Client/Server Weigh-In-Motion -TKO/Mainframe
 Short Term Counts -VB.net application/Access Database Permanent Counts -Traffic Keeper Ohio (TKO) Client/Server Weigh-In-Motion -TKO/Mainframe")
62
Reporting Annual Average Daily Traffic (AADT) Vehicle Volume Data Vehicle Classification Data Adjustment Factors Various Summary Reports: Daily Weekly Annually By direction, by lane Equivalent Single Axle Loadings (ESALs)
 Vehicle Volume Data Vehicle Classification Data Adjustment Factors Various Summary Reports: Daily Weekly Annually By direction, by lane Equivalent Single Axle Loadings (ESALs)")
63
ODOT Count Data Reporting (Current) Traffic Survey Report/Map
 Traffic Survey Report/Map")
64
ODOT Count Data Reporting (Current) TIMS
 TIMS")
65
ODOT Count Data Processing (Future) Midwestern Software Solutions -Cloud based system -Offers Traffic Count Database, Traffic Count Segments, and Turning Movement Modules -Consolidates processing, storage, and reporting for Short term, permanent, and turning movement counts.
 Midwestern Software Solutions -Cloud based system -Offers Traffic Count Database, Traffic Count Segments, and Turning Movement Modules -Consolidates processing, storage, and reporting for Short term, permanent, and turning movement counts.")
66
ODOT Count Data Reporting (Future)
")
67
ODOT Count Data Processing (Future) Integration with: -Roads and Highways (RI) -TIMS -BTRS -Safety -Permitted Lane Closure -Pavements -Others
 Integration with: -Roads and Highways (RI) -TIMS -BTRS -Safety -Permitted Lane Closure -Pavements -Others")
68
Contact Information Dave Gardner Office of Technical Services Traffic Monitoring Section 614-752-5740 dave.gardner@dot.state.oh.us http://www.dot.state.oh.us/Divisions/Planning/ TechServ/Pages/default.aspx

69
www.transportation.ohio.gov John R. Kasich, GovernorJerry Wray, Director Ohio Department of Transportation Brian Schleppi Infrastructure Management Section / Office of Technical Services

70
http://pathweb.pathwayservices.com/ohiopublic/pathweb.pathwayservices.com/ohiopublic

71
1 Cycle of Images Roughly 27,000 miles X 200 shots per mile X 4 camera views (left, front, right, & rear) = over 21 million images = over 11 TB of data (single copy)
 = over 21 million images = over 11 TB of data (single copy)")
72
1 Cycle of Images ~ $ 1 million to support per cycle < 5 cents per image really becomes < 1 cent per image when you prorate for other data collected Road profiles Macrotexture Rutting Surface images Spatial reference

73
1 Cycle of Images All data inclusive of: Linear Reference: County, Route, Logpoint/Milepoint Spatial Reference: Latitude & Longitude Date & Time Stamp Free access to ODOT & J. Q. Public

74
Asset Extractions from Images Building Asset Inventories for Barrier and Overhead Signs 71,816 barrier runs for 5,612 miles of barrier Concrete barrier (rigid) 1,031 miles Guardrail barrier (semi-rigid) 4,296 miles Flexible barrier (cable rail) 284 miles 25 interns completed in 3 weeks time
 1,031 miles Guardrail barrier (semi-rigid) 4,296 miles Flexible barrier (cable rail) 284 miles 25 interns completed in 3 weeks time")
75
Overhead Sign Inventory Collection Process

76
Locating signs with BOX 76 Left click and use cursor to drag a box around sign.

77
Recording info into database 77 Once sign or signs are boxed, now fill out the database record window.

78
Selecting Correct Sign 78 Select correct sign based off of image.

79
Legend Data & Number Of Signs 79 Select number of signs being collected. Any wording on signs will be placed in the Legend.

80
Selecting Sign Supports 80 Select sign support from support menu.

81
Continue Collecting 81

82
Macrotexture Analysis Safety Component Proactively Identify potential High Wet Crash locations

84
1 Cycle of network road profiles Roughly 27,000 miles X 5280 feet per mile X 12 elevation points per mile X 2 wheel paths mile = over 3.4 Billion stored profile points

85
Network Road Profiles FHWA / MAP-21 Requirement to report data nationally as performance metric (IRI) Used in OH DOT’s Pavement Management System Leveraged to develop IRI based smoothness specifications for highway construction
 Used in OH DOT’s Pavement Management System Leveraged to develop IRI based smoothness specifications for highway construction")
86
International Roughness Index (IRI) Using profiles to simulate vehicle response (What the public “feels”)
 Using profiles to simulate vehicle response (What the public feels )")
87
Click the link below to watch Road Profiling Videos http://www.dot.state.oh.us/Divisions/Planning/Confere nce/Pages/Road-Profiling-Videos.aspx

88
Network Road Profiles In-house Research –Interstate Bridges 2.5 X rougher than Pavement –Bridges make up less than 4% of network by length –Bridges raised network IRI by almost 8% Set the stage to develop PN 555, IRI for Bridges –Happy motoring public –Infrastructure Benefits

89
Contact Information Brian Schleppi Office of Technical Services Infrastructure Mangement Section 614-752-5745 brian.schleppi@dot.state.oh.us http://www.dot.state.oh.us/Divisions/Planning/ TechServ/Pages/default.aspx

Similar presentations


 JOURNEY April 19, 2012.>")
 Kick-Off John Kasich, Ohio Governor Jerry Wray, ODOT Director.>")


 2014 TxDOT Transportation Planning Conference.>")
