Download presentation
Presentation is loading. Please wait.

1
Decision Tools to Evaluate Vulnerabilities and Adaptation Strategies to Climate Change The Water Resource Sector Full references can be found in Chapter 11, Bibliography, of the Handbook.

2
Outline Vulnerability and adaptation with respect to water resources
Viewing water resources from a ‘services’ perspective Hydrologic implications of climate change for water resources Tools/models WEAP model presentation Role for Multi-Criteria Analysis (MCA) The water resources sector presentation is divided into five main components. First, a review of V&A concepts for the water resource sector: V&A assessment is more than just looking at the hydrologic response of a watershed to climate change, but a more holistic approach that attempts to look at the hydrologic cycle in terms of both the physical response and management potential in light of that response. Then V&A climate change assessment often begins with an analysis of the hydrologic cycle. We introduce some general concepts on how to address changes in watershed hydrology for V&A assessment. We introduce the concept of the water resource sector providing services. These could include water irrigation, water for municipalities and industry, water for environmental protection, and watersheds for flood control. Tools and models for V&A assessment are mentioned, with the focus on a particular water resources tool, the Water Evaluation and Planning Model (WEAP21.org). Finally, we will discuss MCA as a tool to facilitate prioritization of potential adaptation strategies.
 The water resources sector presentation is divided into five main components. First, a review of V&A concepts for the water resource sector: V&A assessment is more than just looking at the hydrologic response of a watershed to climate change, but a more holistic approach that attempts to look at the hydrologic cycle in terms of both the physical response and management potential in light of that response. Then V&A climate change assessment often begins with an analysis of the hydrologic cycle. We introduce some general concepts on how to address changes in watershed hydrology for V&A assessment. We introduce the concept of the water resource sector providing services. These could include water irrigation, water for municipalities and industry, water for environmental protection, and watersheds for flood control. Tools and models for V&A assessment are mentioned, with the focus on a particular water resources tool, the Water Evaluation and Planning Model (WEAP21.org). Finally, we will discuss MCA as a tool to facilitate prioritization of potential adaptation strategies.")
3
Effective V&A Assessments
Defining V&A assessment Often V&A focuses on analysis over assessment Why? Because the focus is on biophysical impacts, e.g., hydrologic response, crop yields, forests, etc. Assessment is an integrating process requiring the interface of physical and social science and public policy V&A in the water resource sector is more than just looking at the hydrologic response of a watershed to climatic changes. Assessment must look beyond the purely physical response of the watershed to climate forcing; it must address how society might respond to these impacts. To do so, we must develop integrating tools to address all aspects of the hydrologic cycle, including human interventions in the cycle. V&A assessment must include both hydrologic processes and the management components of developed watersheds.

4
Effective V&A Assessments (continued)
General questions What is the assessment trying to influence? How can the science/policy interface be most effective? How can the participants be most effective in the process? General problems Participants bring differing objectives/ expertise These differences often lead to dissention/ differing opinions – this is where MCA can help in prioritization We have introduced some general questions regarding V&A assessment in the water resource sector. Too often assessments just look at hydrologic vulnerability (e.g., as scientists, we tend to “live in a bubble,” and restrict ourselves to interfacing only with other water resource specialists). If our V&A work is to be credible, we must take it out into the public policy arena, and in doing so, our work must be credible, legitimate, and relevant.
. If our V&A work is to be credible, we must take it out into the public policy arena, and in doing so, our work must be credible, legitimate, and relevant.")
5
Effective V&A Assessments (continued)
To be valuable, the assessment process requires Relevancy Credibility Legitimacy Consistent participation An interdisciplinary process The assessment process often requires a tool The tool is usually a model or suite of models These models serve as the interface This interface is a bridge for dialogue between scientists and policy makers The V&A process must be interdisciplinary. Appropriate tools are needed as an interface between scientists conducting the research and policy makers who are attempting to make change.

6
The Water Resource Sector Water’s “Trade-Off” Landscape
When we look at water resources planning we are looking at how to balance demand from agriculture, industry, domestic use, nature, and recreation. We are talking not only about quantity but also quality, timing of the flow, and regulations involved.

7
Water Resources from a Services Perspective
Not just an evaluation of rainfall-runoff or streamflow But an evaluation of the potential impacts of global warming on the goods and services provided by freshwater systems We want to emphasize that it is not just about runoff – we want to look at how much water comes from a watershed – what does that water do – how does it provide services for the different uses, including municipal, industry, biodiversity, etc. How is the system managed and regulated?

8
Freshwater Ecosystem Services
Extractable; Direct Use; Indirect Use Here is an example showing what services a watershed provides. A large watershed might comprise upper catchments, lower catchments, a delta, and a bay. An upper river can provide water for power generation among other services. It can also help mitigate floods and droughts and provide erosion control whereas a bay cannot provide those services. Extractable services from the freshwater ecosystem could be harvestable fish (and other biota), water for irrigation, etc. Direct use services are those derived directly from the freshwater. The water must there “in place” for the service to be available. The services might affect the quality of the water (lead to warming or quality degradation), but not lead to extraction of water in terms of total volume. Indirect services are more difficult to quantify, such as nutrient recycling, natural flood control, etc., but are important services to consider.
, water for irrigation, etc. Direct use services are those derived directly from the freshwater. The water must there in place for the service to be available. The services might affect the quality of the water (lead to warming or quality degradation), but not lead to extraction of water in terms of total volume. Indirect services are more difficult to quantify, such as nutrient recycling, natural flood control, etc., but are important services to consider.")
9
Water Resources – A Critical V&A Sector
Critical to both managed and natural systems Human activity influences both systems Managed Systems External Pressure Natural Systems External Pressure State of System Little Control of processes Product, good or service Process Control services We distinguish between two hydrologic contexts: The first are managed watershed systems, where there is some level of control over hydrologic processes. For example, the use of water for irrigation is a controlled process, that gives rise to goods and services, but may also lead to the degradation of other services (e.g., wetlands can be drained to created agricultural areas). In unmanaged systems, where there is no human intervention in the hydrologic cycles, natural systems dominate. Services still flow out of natural systems, such as biodiversity, which might yield opportunities for wildlife viewing. A wetland that serves as a hydrologic buffer can provide natural water purification and flood protection. Example: Agriculture Example: Wetlands
. In unmanaged systems, where there is no human intervention in the hydrologic cycles, natural systems dominate. Services still flow out of natural systems, such as biodiversity, which might yield opportunities for wildlife viewing. A wetland that serves as a hydrologic buffer can provide natural water purification and flood protection. Example: Agriculture. Example: Wetlands.")
10
Hydrologic ‘External Pressures’ related to Climate Change
Precipitation amount Global average increase Marked regional differences Precipitation frequency and intensity Less frequent, more intense (Trenberth et al., 2003) Evaporation and transpiration Increase total evaporation Regional complexities due to plant/atmosphere interactions These next few slides look at the vulnerability of hydrology to climate change. A change that appears most likely is that global average precipitation will increase as global temperatures rise. Evaporation will increase with warming because a warmer atmosphere can hold more moisture. This capacity is governed by the exponential Clausius-Claperyon equation, which states that for an increase in air temperature of 1°C, the water-holding capacity of the atmosphere increases by about 7%. For example, Trenberth et al. (2003) hypothesized that, on average, precipitation will tend to be less frequent, but more intense when it does occur, implying greater incidence of extreme floods and droughts, with resulting consequences for water storage. Their arguments are based on the premise that local and regional rainfall rates greatly exceed evaporation rates and thus depend on the convergence of regional- to continental-scale moisture sources. They surmise that rainfall intensity should increase at about the same rate as the increase in atmospheric moisture, namely 7% K-1 with warming. This means that the changes in rain rates, when it rains, are at odds with the 1%-2% K-1 for total rainfall amounts as discussed previously. The implication is that there must be a decrease in light and moderate rains, and/or a decrease in the frequency of rain events. Thus, the prospect may be for fewer but more intense rainfall – or snowfall – events.
 Evaporation and transpiration. Increase total evaporation. Regional complexities due to plant/atmosphere interactions. These next few slides look at the vulnerability of hydrology to climate change. A change that appears most likely is that global average precipitation will increase as global temperatures rise. Evaporation will increase with warming because a warmer atmosphere can hold more moisture. This capacity is governed by the exponential Clausius-Claperyon equation, which states that for an increase in air temperature of 1°C, the water-holding capacity of the atmosphere increases by about 7%. For example, Trenberth et al. (2003) hypothesized that, on average, precipitation will tend to be less frequent, but more intense when it does occur, implying greater incidence of extreme floods and droughts, with resulting consequences for water storage. Their arguments are based on the premise that local and regional rainfall rates greatly exceed evaporation rates and thus depend on the convergence of regional- to continental-scale moisture sources. They surmise that rainfall intensity should increase at about the same rate as the increase in atmospheric moisture, namely 7% K-1 with warming. This means that the changes in rain rates, when it rains, are at odds with the 1%-2% K-1 for total rainfall amounts as discussed previously. The implication is that there must be a decrease in light and moderate rains, and/or a decrease in the frequency of rain events. Thus, the prospect may be for fewer but more intense rainfall – or snowfall – events.")
11
Specific Pressures: Retreating Himalayan glaciers
Forecasts of 25% losses globally by 2050; 50% by 2100 The retreat of glaciers has progressed substantially during the last 50 years and will have substantial impact on the availability freshwater resources.

12
Specific Pressures: Retreating Himalayan glaciers
Meltwaters are depended upon during dry season to sustain low flow periods Probable diminished volume and earlier timing of flows Has implications for hydropower production, agricultural demands, and river and riparian quality and ecosystem needs Meltwater from glaciers provides freshwater during critical points in the dry season and the shrinking of glaciers will change the volume and timing of meltwater flows, impacting hydropower production, irrigation and freshwater ecosystems.

13
Specific Pressures: Sea level rise
Sea level could rise by as much as 50 cm by 2100 (IPCC, 2001) For islands, coasts: sea level rise, inundation of coast lines, and decreasing infiltration of precipitation will lead to shrinking groundwater lenses Displacement of people will cause new localized stresses on water resource allocation water tables may rise to land surface, causing full evapotranspiration and diminished water quality (Burns 2000)
 For islands, coasts: sea level rise, inundation of coast lines, and decreasing infiltration of precipitation will lead to shrinking groundwater lenses. Displacement of people will cause new localized stresses on water resource allocation. water tables may rise to land surface, causing full evapotranspiration and diminished water quality (Burns 2000)")
14
Specific Pressures: Extreme weather
Typhoons and cyclones could increase by 50-60% (NASA, 2001), with intensities increasing by 10-20% (IPCC 2001). Possible doubling of frequency of 100 mm/day rainfall events and 15-18% increase in rainfall intensity over large areas of the Pacific (IPCC 2001). This may lead to greater soil erosion and runoff, and less water available for infiltration and evapotranspiration
, with intensities increasing by 10-20% (IPCC 2001). Possible doubling of frequency of 100 mm/day rainfall events and 15-18% increase in rainfall intensity over large areas of the Pacific (IPCC 2001). This may lead to greater soil erosion and runoff, and less water available for infiltration and evapotranspiration.")
15
Examples of Adaptation in Water Resources
Construction/modification of physical infrastructure Canal linings Closed conduits instead of open channels Integrating separate reservoirs into a single system Reservoirs/hydro-plants/delivery systems Raising dam wall height Increasing canal size Removing sediment from reservoirs for more storage Inter-basin water transfers For managed watersheds, a list of potential adaptations to climate change is presented. These include both physical modifications to the watershed, and management options. These are supply side adaptations.

16
Examples of Adaptation in Water Resources (continued)
Adaptive management of existing water supply systems Change operating rules Use conjunctive surface/groundwater supply Physically integrate reservoir operation system Coordinate supply/demand Indigenous options

17
Examples of Adaptation in Water Resources (continued)
Policy, conservation, efficiency, and technology Domestic Municipal and in-home re-use of water Leak repair Rainwater collection for non-potable uses Low-flow appliances Dual-supply systems (potable and nonpotable) Agriculture Irrigation timing and efficiency Drainage re-use, use of wastewater effluent High value/low water use crops Drip, micro-spray, low-energy, precision application irrigation systems Salt-tolerant crops that can use drain water These are demand side adaptations.
 Agriculture. Irrigation timing and efficiency. Drainage re-use, use of wastewater effluent. High value/low water use crops. Drip, micro-spray, low-energy, precision application irrigation systems. Salt-tolerant crops that can use drain water. These are demand side adaptations.")
18
Examples of Adaptation – Water Supply (continued)
Policy, conservation, efficiency, and technology (continued) Industry Water re-use and recycling Closed cycle and/or air cooling More efficient hydropower turbines Cooling ponds, wet towers and dry towers Energy (hydropower) Reservoir re-operation Cogeneration (beneficial use of waste heat) Additional reservoirs and hydropower stations Low head run of the river hydropower Market/price-driven transfers to other activities Using water price to shift water use between sectors
 Industry. Water re-use and recycling. Closed cycle and/or air cooling. More efficient hydropower turbines. Cooling ponds, wet towers and dry towers. Energy (hydropower) Reservoir re-operation. Cogeneration (beneficial use of waste heat) Additional reservoirs and hydropower stations. Low head run of the river hydropower. Market/price-driven transfers to other activities. Using water price to shift water use between sectors.")
19
Tools in Water Resource V&A Studies
What tools are available to understand both water resource vulnerabilities and evaluate adaptation strategies? How can stakeholders be engaged in these processes? The approach presented to the UNFCCC focuses on water resource modeling tools for V&A assessment.

20
Types of Water Resources Models
Hydraulic: biophysical process models describing streamflow, flooding Hydrology: rainfall/runoff processes Planning: water resource systems models Which model?... What questions are you trying to answer?

21
Hydraulic Model Critical questions How fast, deep is river flowing
How do changes to flow and channel morphology impact sediment transport and services provided (fish habitats, recreation, etc).
.")
22
Hydrology Model Critical questions
How does rainfall on a catchment translate into flow in a river? What pathways does water follow as it moves through a catchment? How does movement along these pathways impact the magnitude, timing, duration, and frequency of river flows, as well as water quality? The two main components of a water resources river basin model such as WEAP are hydrology and planning. Given a set of parameters specific to a catchment, these are questions the hydrology model answers.

23
Planning Model Critical questions
How should water be allocated to various uses in time of shortage? How can these operations be constrained to protect the services provided by the river? How should infrastructure in the system (e.g., dams, diversion works) be operated to achieve maximum benefit (economic, social, ecological)? How will allocation, operations, and operating constraints change if new management strategies are introduced into the system? We now put human factors into the model that will affect the way water is used in the catchment. These are some questions that can be analyzed/answered using WEAP.
 be operated to achieve maximum benefit (economic, social, ecological) How will allocation, operations, and operating constraints change if new management strategies are introduced into the system We now put human factors into the model that will affect the way water is used in the catchment. These are some questions that can be analyzed/answered using WEAP.")
24
Tools to Use for the Assessment: Referenced Water Models
Operational and hydraulic HEC HEC-HMS – event-based rainfall-runoff (provides input to HEC-RAS for doing 1-d flood inundation “mapping”) HEC-RAS – one-dimensional steady and unsteady flow HEC-ResSim – reservoir operation modeling WaterWare RiverWare MIKE11 Delft3d HEC: WaterWare: RiverWare: MIKE 11: Delft3d:
 HEC-RAS – one-dimensional steady and unsteady flow. HEC-ResSim – reservoir operation modeling. WaterWare. RiverWare. MIKE11. Delft3d. HEC: WaterWare: RiverWare: MIKE 11: Delft3d:")
25
Hydraulic Water Management Model
HEC-HMS watershed scale, event based hydrologic simulation, of rainfall-runoff processes Sub-daily rainfall-runoff processes of small catchments Free, download from web HEC models are looking more at hydraulics, modeling sub-daily. These models are used to get runoff – used for for flood studies, urban flooding, etc. The Hydrologic Modeling System is designed to simulate the precipitation-runoff processes of watershed systems.

26
Tools to Use for the Assessment: Referenced Water Models (continued)
Planning/ hydrology WEAP21 Aquarius SWAT IRAS (Interactive River and Aquifer Simulation) RIBASIM MIKE 21 and BASIN WEAP21: Aquarius: SWAT: IRAS: RIBASIM: (river basin model) MIKE 21 and BASIN:
 RIBASIM. MIKE 21 and BASIN. WEAP21: Aquarius: SWAT: IRAS: RIBASIM: (river basin model) MIKE 21 and BASIN:")
27
Current Focus – Planning and Hydrologic Implications of Climate Change
Selected planning/hydrology models: can be deployed on PC, extensive documentation, ease of use, free (or free to developing nations)… Aquarius SWAT (Soil Water Assessment Tool) WEAP21 (Water Evaluation and Planning) These are the models we will talk more about. The focus for this workshop is planning and hydrology, not hydraulics. These models are free, have good documentation, and are fairly easy to use. We will be providing you with the WEAP model. The other models you can get via the web. Some require licensing.
… Aquarius. SWAT (Soil Water Assessment Tool) WEAP21 (Water Evaluation and Planning) These are the models we will talk more about. The focus for this workshop is planning and hydrology, not hydraulics. These models are free, have good documentation, and are fairly easy to use. We will be providing you with the WEAP model. The other models you can get via the web. Some require licensing.")
28
Physical Hydrology and Water Management Models
AQUARIS advantage: Has economic efficiency criterion requiring the reallocation of stream flows until the net marginal return in all water uses is equal Cannot be climatically driven – flows prescribed by user Economic focus Aquarius is an optimization model that uses perfect foresight. The graphic represents a frontier curve for optimization. The model is driven by an economic efficiency operational criterion requiring the reallocation of stream flows until the net marginal return in all water uses is equal. This occurs by systematically examining, using a nonlinear optimization technique, the feasibility of reallocating unused or marginally valuable water storage and releases in favor of alternative uses. Because water-system components can be interpreted as objects of a flow network, the model considers each component as an equivalent node or structure in the programming environment as well.

29
Physical Hydrology and Water Management Models (continued)
SWAT advantage: Can predict effect of management decisions on water, sediment, nutrient and pesticide yields on ungauged river basins. Considers complex water quality constituents. Rainfall-runoff, river routing on a daily timestep Focuses on supply side of water balance SWAT addresses simple management issues, with more focus on the supply side. It lightly touches on the demand side of water management modeling. Model Objective Predict the effect of management decisions on water, sediment, nutrient, and pesticide yields with reasonable accuracy on large, ungauged river basins. Model Components Weather, surface runoff, return flow, percolation, ET, transmission losses, pond and reservoir storage, crop growth and irrigation, groundwater flow, reach routing, nutrient and pesticide loading, water transfer.

30
Physical Hydrology and Water Management Models (continued)
WEAP21 advantage: Seamlessly integrates watershed hydrologic processes with water resources management Can be climatically driven Based on holistic approach of integrated water resources management (IWRM) – supply and demand WEAP21 has many advantages. Although it is mainly a river basin model that looks at supply, demand, and infrastructure, it also has a hydrologic model that can determine runoff along with irrigation “cropwat” type modeling capabilities. This is our model of focus.
 – supply and demand. WEAP21 has many advantages. Although it is mainly a river basin model that looks at supply, demand, and infrastructure, it also has a hydrologic model that can determine runoff along with irrigation cropwat type modeling capabilities. This is our model of focus.")
31
IWRM Principles Freshwater is finite and has economic and social value in its competing uses Water is essential to sustain life and safe water should be accessible to all Water development and management should be participatory, involving users, planners, policy makers at all levels and recognize that women in particular play a central role in water provision for their families. 1992 International Conference on Water and Environment, Dublin, Ireland

32
Global Water Partnership
IWRM Principles Promotes the coordinated development and management of land, water and related resources to maximize social and economic welfare in equitable way without comprising sustainability Cross-sectoral integration in water policy development Global Water Partnership

33
Global Water Partnership at:
IWRM Resources Global Water Partnership at:

34
Overview WEAP21 Hydrology and planning
Planning (water distribution) examples and exercises Adding hydrology to the model User interface Scale Data requirements and resources Calibration and validation Results Scenarios Licensing and registration
 examples and exercises. Adding hydrology to the model. User interface. Scale. Data requirements and resources. Calibration and validation. Results. Scenarios. Licensing and registration.")
35
A Simple System with WEAP21
60 40 The next few slides show how water is distributed and tracked in the WEAP21 model. WEAP operates on simple principles of water balance accounting. Legend: Red circle = demand site Blue line = river (arrow points downstream – value at the top in blue represents the headflow of the river) Green line = transmission link (brings water from supply to demand) Black line = represents where the water is flowing and how much In this slide, 100 units of water are coming in via headflow of the river, 40 units are pulled from the river to meet the demand, leaving 60 units to continue downstream.
 Green line = transmission link (brings water from supply to demand) Black line = represents where the water is flowing and how much. In this slide, 100 units of water are coming in via headflow of the river, 40 units are pulled from the river to meet the demand, leaving 60 units to continue downstream.")
36
An Infrastructure Constraint
70 30 10 Unmet Here there is an infrastructure constraint on the transmission link (maximum allowed is 30 units). Again, 100 units of water are supplied via the headflow of the river. Although the demand site is asking for 40 units, it will receive only 30 units because of the constraint on the transmission link. This leaves 70 units to continue downstream.
. Again, 100 units of water are supplied via the headflow of the river. Although the demand site is asking for 40 units, it will receive only 30 units because of the constraint on the transmission link. This leaves 70 units to continue downstream.")
37
A Regulatory Constraint
70 30 10 Unmet IFR Met Here there is a minimum flow requirement downstream of 70 units of water. There is no constraint on the transmission link, but the flow requirement has a higher priority than the demand site. Here 100 units are supplied as headflow; the priority is the downstream flow requirement of 70 units, which leaves only 30 units for the demand site. The demand site is unmet by 10 units.

38
Different Priorities For example, the demands of large farmers (70 units) might be Priority 1 in one scenario whereas the demands of smallholders (40 units) may be Priority 1 in another 40 60 10 unmet This example shows the priority system in WEAP21. Each demand site is given a priority (represented in the schematic by the black number in the red authorized circle). Higher priorities receive water before lower priorities. The water will be distributed equally among demand sites of the same priority. In the schematic the smallholder demand has the higher priority. Since only 100 units of water are supplied, the large farmer’s demand is unmet by 10 units. If the large farmer had a higher priority then the smallholder would receive only 30 units (a 10 unit deficit).
 might be Priority 1 in one scenario whereas the demands of smallholders (40 units) may be Priority 1 in another unmet. This example shows the priority system in WEAP21. Each demand site is given a priority (represented in the schematic by the black number in the red authorized circle). Higher priorities receive water before lower priorities. The water will be distributed equally among demand sites of the same priority. In the schematic the smallholder demand has the higher priority. Since only 100 units of water are supplied, the large farmer’s demand is unmet by 10 units. If the large farmer had a higher priority then the smallholder would receive only 30 units (a 10 unit deficit).")
39
Different Preferences
30 10 For example, a center pivot operator may prefer to take water from a tributary because of lower pumping costs 90 This example shows the supply preference in WEAP21. We just saw how a demand will have a priority in the overall system. If a demand site is connected to more than one supply source, it can have a preference on which supply source it prefers more. For example, the demand site in the schematic is connected to two different supply sources (two rivers). It prefers to receive as much water as possible from river 1 (30 units of headflow). Since river 1 can only supply 30 units, the demand site will receive its remaining 10 units from river 2 (100 units of headflow). Preferences can vary because of water quality issues, cost issues, political issues, etc.
. It prefers to receive as much water as possible from river 1 (30 units of headflow). Since river 1 can only supply 30 units, the demand site will receive its remaining 10 units from river 2 (100 units of headflow). Preferences can vary because of water quality issues, cost issues, political issues, etc.")
40
WEAP and Planning Provides a common framework for transparently organizing water resource data at any scale desired – local watershed, regional or transboundary river basin Scenarios can be easily developed to explore possible water futures Implications of various policies can be evaluated

41
WEAP Capabilities Can do
High level planning at local and regional scales Demand management Water allocation Infrastructure evaluation Cannot do Sub-daily operations Optimization of supply and demand (e.g. cost minimizations or social welfare maximization)
")
42
Uses of WEAP Policy Research Capacity Building Negotiation
Alternative Allocations Climate Change Land Use Change Infrastructure Planning Capacity Building Negotiation Stakeholder Engagement

43
To summarize, sustainable development requires an integrated view that captures the linkages across sectors, themes and scales. This is not easy. We need new holistic ways of thinking about and analyzing our world. Most importantly, we must have a long time perspective, since sustainable development is about passing on a livable world to our children and grandchildren.

44
WEAP is Scenario-driven
The scenario editor readily accommodates analysis of: Climate change scenarios and assumptions Future demand assumptions Future watershed development assumptions

45
Futures and Scenarios: Why?
Scenarios: a systematic way of thinking about the future To gain a better understanding of the possible implications of decisions (or non-decisions across scales and time To support decision-making

46
Driving Forces Technological Demographic
More people Urbanization Older Economic Growing integration of global economy Social Increasing inequality Persistent poverty Cultural Spread of values of consumerism and individualism Nationalist and religious reaction Technological Computer and information technology Biotechnology Miniaturization Environmental/Climatic Increasing global stress Local degradation Some remediation in richer countries Governance Global institutions Democratic government Role for civil society in decision-making

47
Who are the Actors? Government Private sector Civil society Public
Rich farmers Poor farmers Urban users Environmentalists Or?

48
Consider Sources of Uncertainty
Ignorance Understanding is limited Surprise The unexpected and the novel can alter directions But, of course, the future is highly uncertain. There are three types of uncertainty: Ignorance – our understanding of current conditions and the forces causing change is far from complete. Surprise - the possibility for unexpected events and novel behavior of physical and social systems introduces additional uncertainty. Volition - the future is subject to human choices that have not yet been made, indeed, choices that can be influenced by the very process of studying the future. Volition Human choice matters

49
? Forecast and Backcast Where is society going? forecast backcast
Some scenarios look forward – they are called “forecasts”. They describe how future conditions might develop from current conditions and driving forces. Typical so-called “business-as-usual” projections are forecasts. They generally focus on the continuation of current trends and relationships into the future. But scenarios that predict breakdowns and crises are also forecasts, where the analysts project the breakdown of continuity and the structural integrity of the system. Others scenarios are called “backcasts”. They differ from forecasts by beginning with an image of the future. They then seek to identify plausible development pathways for getting there. Backcasts are very useful to sustainable development studies. With backcasts we can ask: Where do we want to go? And: How do we get there? For example, in a water sustainability study we might imagine the future of a water basin where there is investment in water infrastructure, more efficient use and water allocation rules that balance between different users and environmental requirements. Then, we might explore the changes of polices, values and technologies that could get us from here to there. Where do we want to go? How do we get there?

50
All WEAP applications follow a similar structure:
The Study definition sets up the time frame, spatial boundaries, system components and the configuration of the problem. The Current Accounts represent the baseline or existing conditions in a system, including the demands, pollution loads, resources and supplies. Scenarios can then be constructed, typically with a base case scenario developed based on existing trends and policies, that can be contrasted with alternative scenarios. Alternative sets of future assumptions are based on policies, costs and factors that affect the demands, pollution loads, supply and hydrology. Finally the scenarios can be evaluated with regard to water sufficiency, costs and benefits, compatibility with environmental targets and sensitivity to uncertainty in key variables.

51
WEAP21 Program Structure
The structure of WEAP includes a menu bar that provides access to the most important functions of the program, such as creating a new area, saving data and results and setting overall parameters for the study. In addition, WEAP is structured as a set of five different “views” of your area. These views are listed as graphical icons on the “View Bar”, located on the left of the screen. Clicking on an icon in the View Bar allows you to select one of the views. For the Results and Overviews view, WEAP will calculate scenarios before the view is displayed, if any changes have been made to the system or the scenarios.

52
The WEAP21 Graphical User Interface
Languages: Interface Only English French Chinese Spanish The Schematic View is the starting point for all activities in WEAP. A central feature of WEAP is its easy-to-use “drag and drop” graphical interface used to describe and visualize the physical features of the water supply and demand system. This spatial layout is called the schematic. You can create, edit and view it in the Schematic View. GIS layers can be added to add clarity and impact. The Schematic View provides you with one-click access to your entire analysis—right clicking on any element in the schematic gives access to its data or results.

53
The Data View is the place where you create your data structures, models and assumptions in WEAP. In the Data View, the screen is divided into four panes. On the top left, a hierarchical tree is used to create and organize data structures under six major categories Key Assumptions, Demand Sites, Hydrology, Supply and Resources, Environment, and Other Assumptions. The tree is also used to select the data to be edited, which is shown on the right of the screen. For example, clicking on the “Demand Sites” tree branch on the left of the screen, will display the data for all demand sites on the right of the screen. On the top-right of the screen, a data entry table is used to edit data and create modeling relationships. The information you enter here is displayed graphically in the bottom right pane. Data entry in WEAP is very interactive and user friendly. Data can be entered internally via the WEAP interface, or the user can point to external data files.

54
Data Requirements WEAP allows the user to determine the level of complexity desired according to the questions that need to be addressed the availability of data WEAP allows users to specify several types of water sources, including surface and ground water. Other components of supply include diversions and reservoirs. Finally, other sources of water may be available, such as desalination plants or inter-basin transfers. WEAP requires water supply and demand data. Water supply can be given as a fixed time series, or the physical hydrology module can be used to generate river flow dynamically.

55
From the simple… A WEAP application for the Sadah area of Yemen looking at the impact of declining groundwater levels on rural smallholder farmers and rain harvesting as a possible adaptation strategy.

56
To the complex…. WEAP application of the Hai River basin of Beijing, looking at issues of water competition among Beijing and the upstream rural poor that it shares its watershed with.

57
Data Requirements: Supply
User-prescribed supply (riverflow given as fixed time series) Time series data of riverflows (headflows) cfs River network (connectivity) Alternative supply via physical hydrology (let the watershed generate riverflow) Watershed attributes Area, land cover . . . Climate Precipitation, temperature, windspeed, and relative humidity WEAP allows users to specify several types of water sources, including surface and ground water. Other components of supply include diversions and reservoirs. Finally, other sources of water may be available, such as desalination plants or inter-basin transfers. WEAP requires water supply and demand data. Water supply can be given as a fixed time series, or the physical hydrology module can be used to generate river flow dynamically.
 Time series data of riverflows (headflows) cfs. River network (connectivity) Alternative supply via physical hydrology (let the watershed generate riverflow) Watershed attributes. Area, land cover Climate. Precipitation, temperature, windspeed, and relative humidity. WEAP allows users to specify several types of water sources, including surface and ground water. Other components of supply include diversions and reservoirs. Finally, other sources of water may be available, such as desalination plants or inter-basin transfers. WEAP requires water supply and demand data. Water supply can be given as a fixed time series, or the physical hydrology module can be used to generate river flow dynamically.")
58
Letting Climate Drive Hydrology
We add hydrology, letting the catchment land use and physical properties determine the division of precipitation among runoff, infiltration and evapotranspiration . Hydrology is affected by climate change – temperature, relative humidity, precipitation, how pasture and vegetable irrigation demands are going to change.

59
The WEAP 2-Bucket Hydrology Module
Surface Runoff = f(Pe,z1,1/LAI) Sw This represents how WEAP translates precipitation into surface runoff, interflow, and baseflow. This is a stylized limited parameter hydrologic model. We are computing a watershed mass balance in a stylized way – we will be going through these parameters in the example and if you want more details you can read the supporting papers. Runoff from the upper storage occurs as direct, surface, and interflow, whereas baseflow originates only from the lower storage. P = precipitation Et = evapotranspiration Pe = effective precipitation Sw = upper storage capacity (root zone) Dw = lower storage capacity (deep water zone) Z1 = average, long-term relative storage in the root zone (percentage of total available capacity; % of Sw) Z2 = average, long-term relative storage in the deep water zone (percentage of total available capacity; % of Dw) Dw
 Sw. This represents how WEAP translates precipitation into surface runoff, interflow, and baseflow. This is a stylized limited parameter hydrologic model. We are computing a watershed mass balance in a stylized way – we will be going through these parameters in the example and if you want more details you can read the supporting papers. Runoff from the upper storage occurs as direct, surface, and interflow, whereas baseflow originates only from the lower storage. P = precipitation. Et = evapotranspiration. Pe = effective precipitation. Sw = upper storage capacity (root zone) Dw = lower storage capacity (deep water zone) Z1 = average, long-term relative storage in the root zone (percentage of total available capacity; % of Sw) Z2 = average, long-term relative storage in the deep water zone (percentage of total available capacity; % of Dw) Dw.")
60
One 2-Bucket Model per Land Class
Each separate land class is analyzed with the 2 bucket model (i.e., there will be parameters associated with each land class – Sw[Root Zone Water Capacity] = 400 mm for trees, 300 mm for grass, and 350 mm for pasture).
.")
61
Integrated Hydrology/Water Management Analytical Framework in WEAP21
This is a view of a catchment in both a cross-section view (top) and plan view (bottom), describing how the catchment can be subdivided into headwater and floodplain areas for example. A catchment could be divided according to other geologic, geomorphic, land use criteria.
 and plan view (bottom), describing how the catchment can be subdivided into headwater and floodplain areas for example. A catchment could be divided according to other geologic, geomorphic, land use criteria.")
62
Data Requirements: Demand
Water demand data: multi-sectoral Municipal and industrial demand Aggregated by sector (manufacturing, tourism, etc.) Disaggregated by population (e.g., use/capita, use/socioeconomic group) Agricultural demands Aggregated by area (# hectares, annual water-use/hectare) Disaggregated by crop water requirements Ecosystem demands (in-stream flow requirements) Water demand calculations are one of WEAP21’s strengths. Demands can be aggregated or disaggregated according to a user’s available data and level of detail needed. A demand site is best defined as a set of water users that share a physical distribution system, that are all within a defined region, or that share an important withdrawal supply point. You also must decide whether to lump demands together into aggregate demand sites (e.g., counties) or to separate key water uses into individual demand sites. You might want to define demand sites according to the following groupings: major cities or counties individual user which manages a surface or groundwater withdrawal point, such as an industrial facility irrigation districts demands which return to a unique wastewater treatment plant water utilities
 Disaggregated by population (e.g., use/capita, use/socioeconomic group) Agricultural demands. Aggregated by area (# hectares, annual water-use/hectare) Disaggregated by crop water requirements. Ecosystem demands (in-stream flow requirements) Water demand calculations are one of WEAP21’s strengths. Demands can be aggregated or disaggregated according to a user’s available data and level of detail needed. A demand site is best defined as a set of water users that share a physical distribution system, that are all within a defined region, or that share an important withdrawal supply point. You also must decide whether to lump demands together into aggregate demand sites (e.g., counties) or to separate key water uses into individual demand sites. You might want to define demand sites according to the following groupings: major cities or counties. individual user which manages a surface or groundwater withdrawal point, such as an industrial facility. irrigation districts. demands which return to a unique wastewater treatment plant. water utilities.")
63
Data Requirements (continued)
SECTOR SUBSECTOR END-USE DEVICE Agriculture Industry Municipal Cotton Rice Wheat ... Electric Power Petroleum Paper South City West City Irrigation ... Cooling Processing Others Single Family Multi-family Furrow Sprinkler Drip Standard Efficient ... Kitchen Bathing Washer Toilet You can adapt the structure of the data to your purposes, based on the availability of data, the types of analyses you want to conduct, and your unit preferences. Note also that you can create different levels of disaggregation in each demand site and sector. Types of disaggregation: Sector: A sample sectoral partition could include agriculture, industry, urban domestic and rural domestic. The sector categories can be used flexibly to correspond to the particular problem under analysis. The example at the right has no sectoral breakdown within a demand site—the demand sites themselves each represent one sector (two each for municipal, industry and agriculture). Subsector: For example, the industrial sector could be divided into industrial classifications, e.g., steel and iron, petroleum, chemistry, textile, pulp and paper, and food processing. The agriculture sector might be broken down by crop type, livestock or another appropriate subsector. End-use: For example, a crop end-use might be characterized by water requirements in different soil conditions or in different locations in the study area, or different irrigation techniques. Industrial end-uses might include processing, cooling and sanitary amenities. Device: For example, sprinkler, drip or flooding irrigation in agricultural sectors, or showers, toilets, and washing for domestic sectors.
. Subsector: For example, the industrial sector could be divided into industrial classifications, e.g., steel and iron, petroleum, chemistry, textile, pulp and paper, and food processing. The agriculture sector might be broken down by crop type, livestock or another appropriate subsector. End-use: For example, a crop end-use might be characterized by water requirements in different soil conditions or in different locations in the study area, or different irrigation techniques. Industrial end-uses might include processing, cooling and sanitary amenities. Device: For example, sprinkler, drip or flooding irrigation in agricultural sectors, or showers, toilets, and washing for domestic sectors.")
64
Example Data Resources
Indigenous knowledge! Climate (Asia Pacific Data Research Center) Hydrology (Global Runoff Data Center) GIS (Asian Spatial Information and Analysis Network) General Resources
 Hydrology. (Global Runoff Data Center) GIS. (Asian Spatial Information and Analysis Network) General Resources.")
65
Calibration and Validation
Model evaluation criteria Flows along mainstem and tributaries Reservoir storage and release Water diversions from other basins Agricultural water demand and delivery Municipal and industrial water demands and deliveries Groundwater storage trends and levels In WEAP, you can calibrate and validate the model by gathering this type of information.

66
Modeling Streamflow You can look at streamflow as part of your validation and calibration process.

67
Looking at Results Select results to be viewed, including
which scenario here. Change units and sub categories of results, and change the style of the graph here. Select values for the y here. The Results View displays a wide variety of charts and tables covering each aspect of the system: demand, supply, costs, and environmental loadings. Customizable reports can be viewed for one or more scenarios. You can also use the “Favorites” option to bookmark the most useful charts for your analysis. You can export it directly to Excel.

68
What next? How can output from WEAP, or any water resource model for that matter, be organized and analyzed to select adaptation strategies?... Stakeholder-driven multi-criteria analysis can help…

69
Multi-criteria Analysis (MCA)
Any structured approach used to determine overall preferences among alternative options, where the alternatives can accomplish several objectives Is particularly useful to situations where a single criterion would fall short, and allows decision-makers to address a range of relevant factors

70
MCA: Scope All sectors, regions, livelihoods, ecosystems, etc.
Has been used extensively in water resources planning, coastal zone management, agricultural development, and stakeholder processes

71
MCA: Key Outputs A single preferred option, or…
A short list of preferred options, or… A characterization of acceptable and unacceptable possiblities

72
MCA: Key Inputs Evaluation criteria
Relevant metrics for those criteria

73
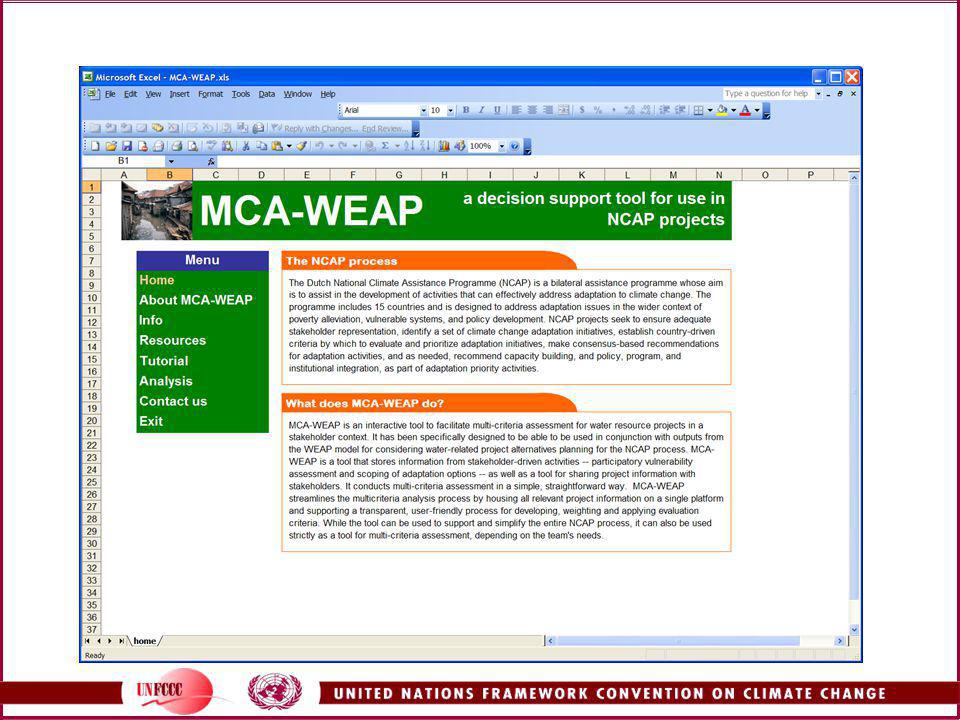
MCA–WEAP: Motivation Develop an interactive computer tool to facilitate multi-criteria assessment for water resource options in a stakeholder context Designed specifically to be used in conjunction with outputs from the WEAP model and stakeholder processes to develop, weight and apply evaluation criteria to adaptation options

74
MCA–WEAP: History MCA-WEAP is a new Excel macros-based model, built off of NAPAssess, a tool developed by SEI for use by Sudan and Yemen in their NAPA processes Now reshaped to focus exclusively on adaptation options around water – used so far in Netherlands Climate Assistance Program (NCAP) studies ensure adequate stakeholder representation Identify CC adaptation strategies establish country-driven criteria to evaluate and prioritize Make concensus-based recommendations for adaptation initiatives Open source, and still a BETA version!
 studies. ensure adequate stakeholder representation. Identify CC adaptation strategies. establish country-driven criteria to evaluate and prioritize. Make concensus-based recommendations for adaptation initiatives. Open source, and still a BETA version!")
76
MCA–WEAP: Capabilities
Streamlines the multi-criteria analysis process by: Housing all relevant project information on a single platform Supporting a transparent, user-friendly process for developing, weighting, and applying evaluation criteria Producing a ranked set of alternatives

77
MCA–WEAP: Steps Assess vulnerability priorities
Identify key stakeholders Identify potential adaptation strategies Develop stakeholder-driven evaluation criteria to determine trade-offs Assign weights to criteria Prioritize adaptation options for best meeting the needs of those most vulnerable

78
Licensing WEAP Go to and register for a new license (free for government, university, and non-profit organizations in developing countries) Register WEAP under Help menu and select “Register WEAP”
 Register WEAP under Help menu and select Register WEAP")
Similar presentations


. BEST METHODS (POLICY, TOOLS AND TECHNIQUES) TO ENHANCE.>")


>")
