Download presentation
Presentation is loading. Please wait.

1
Predecessor Rainfall Events (PRE) in Tropical Cyclones - Results from a Recent Northeastern U.S. Collaborative Science, Technology, and Research (CSTAR) Project Matthew Cote, Lance Bosart, and Daniel Keyser State University of New York, Albany, NY Michael L. Jurewicz, Sr. National Weather Service, Binghamton, NY July 10, 2008 – HPC, Camp Springs, MD

2
Outline Data Sources Definition of PRE
Motivating factors / goals for this session Methodologies for the project Categorize PRE / Establish climatologies for the Eastern U.S. / Atlantic Basin TC Provide operational forecasting resources Composites / Conceptual models Case Study Examples Summary

3
Data Sources WSI NOWRAD Radar Imagery HPC Surface / Radar Analyses
SPC Upper-Air / Mesoanalyses Archived TC Tracks / Positions from TPC NARR 32-km Datasets NWS WES Imagery NPVU QPE Data from NWS RFC’s

4
PRE – What are They ? Coherent areas of heavy rainfall observed poleward of Tropical Cyclones (TC) Distinct from the main precipitation shields of TC, or their extra-tropical remnants Yet, still indirectly tied to TC

5
PRE Example – Frances (2004)
Main Precipitation Shield of the TC PRE

6
Results of the Frances PRE

7
Motivation for Research
PRE can be particularly challenging phenomena for operational meteorologists NWP models often underestimate / misplace heavy rainfall associated with PRE Poor handling of diabatic heating transfer / upper-jet intensification Attention is frequently diverted to different areas / times Closer to where TC make landfall Future time periods when the more direct impacts of TC or their remnants may be expected

8
Goals To provide NWS forecasters / operational meteorologists with:
Background Knowledge / Awareness of PRE Forecast Tools PRE Climatologies Conceptual Models / Composite Charts Case Study Examples

9
Methodology We restricted classifications of PRE to systems that met the following criteria: 100 mm (4”) of rainfall needed to be observed within a 24-hour period Such rainfall had to be connected with a well defined region of precipitation Not scattered / isolated convection
 of rainfall needed to be observed within a 24-hour period. Such rainfall had to be connected with a well defined region of precipitation. Not scattered / isolated convection.")
10
Frequency of Occurrence
Our period of study ran from 1998 to 2006 47 PRE were identified, which were tied to a total of 21 TC An average of about 2 PRE per PRE-producing TC (PPTC) About 1/3 of all Atlantic Basin TC that made U.S. Landfall for this period were PPTC A few outlier PPTC did not actually make landfall
 About 1/3 of all Atlantic Basin TC that made U.S. Landfall for this period were PPTC. A few outlier PPTC did not actually make landfall.")
11
PRE Statistics Separation Distance 1086 ± 482 km Median: 935 km
Agnes PRE Separation Distance 1086 ± 482 km Median: 935 km Bosart and Carr (1978) conceptual model of antecedent rainfall indirectly associated with TC Agnes (from 1972)
 conceptual model of antecedent rainfall indirectly associated with TC Agnes (from 1972)")
12
PRE Statistics (Continued)
Agnes PRE Separation Distance 1086 ± 482 km Median: 935 km Event Duration 14 ± 7 h Median: 12 h Bosart and Carr (1978) conceptual model of antecedent rainfall indirectly associated with TC Agnes (from 1972)
 conceptual model of antecedent rainfall indirectly associated with TC Agnes (from 1972)")
13
PRE Statistics (Continued)
ROT Separation Distance 1086 ± 482 km Median: 935 km Event Duration 14 ± 7 h Median: 12 h Time Lag 45 ± 29 h Median: 36 h LOT Bosart and Carr (1978) conceptual model of antecedent rainfall indirectly associated with TC Agnes (from 1972)
 conceptual model of antecedent rainfall indirectly associated with TC Agnes (from 1972)")
14
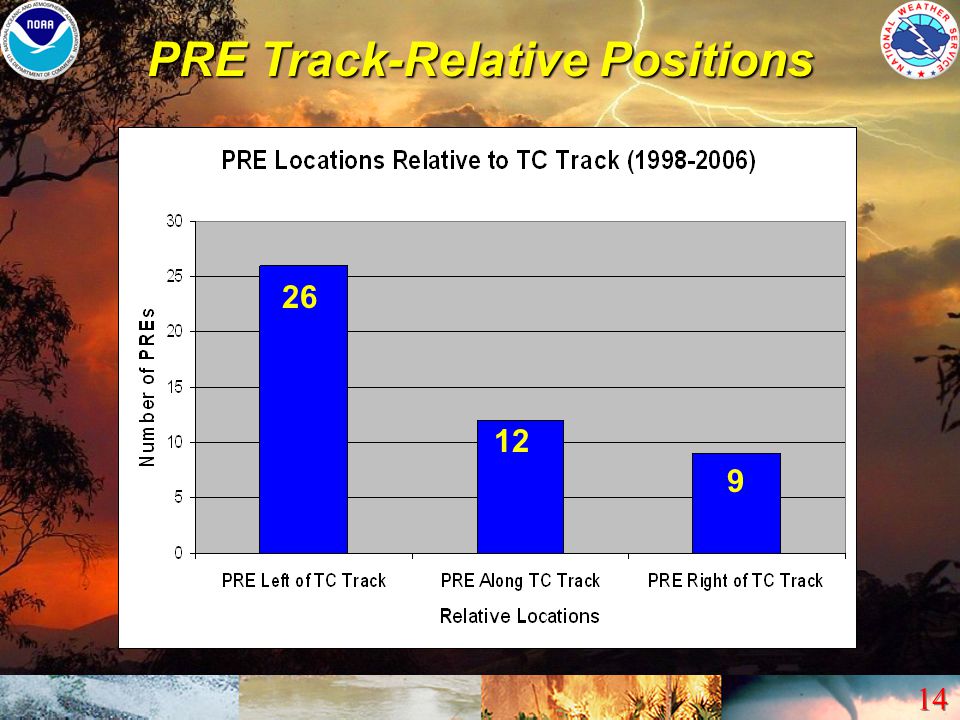
PRE Track-Relative Positions
26 12 9
15
PRE Track-Relative Positions
Potential for excessive flooding beginning before arrival of TC rainfall 26 12 9

16
PRE Track-Relative Positions
Potential for flooding in areas not directly impacted by TC rainfall 26 12 9

17
Further Sub-Classifications
Separation by Similarity of TC Track: Southeast Recurvatures (SR) Highest percentage of PPTC Atlantic Recurvatures (AR) Most common TC Track Central Gulf Landfalls (CG) Lower percentage of PPTC, but high frequency PRE production within those PPTC Other “Hybrid” TC that were harder to categorize
 Highest percentage of PPTC. Atlantic Recurvatures (AR) Most common TC Track. Central Gulf Landfalls (CG) Lower percentage of PPTC, but high frequency PRE production within those PPTC. Other Hybrid TC that were harder to categorize.")
18
SR TC Tracks and PRE Locations
All SR PPTC Tracks; with PRE centroids (colored dots) All SR TC Tracks
 All SR TC Tracks.")
19
AR TC Tracks and PRE Locations
All AR PPTC Tracks; with PRE centroids (colored dots) All AR TC Tracks
 All AR TC Tracks.")
20
CG TC Tracks and PRE Locations
All CG PPTC Tracks; with PRE centroids (colored dots) All CG Tracks
 All CG Tracks.")
21
Favorable Locations for PRE
Within the Right-rear quadrant (RRQ) of an Upper-level Jet Ahead of the Mean Long-Wave Trough Axis at Mid-levels (trough axis is west of the parent TC’s longitude) Near or just upstream from Short-wave Ridging Near a Low-level Front / Baroclinic Zone On the periphery of a Tropical Moisture Plume Near or just west of a Low-level Theta-E Ridge Axis
 of an Upper-level Jet. Ahead of the Mean Long-Wave Trough Axis at Mid-levels (trough axis is west of the parent TC’s longitude) Near or just upstream from Short-wave Ridging. Near a Low-level Front / Baroclinic Zone. On the periphery of a Tropical Moisture Plume. Near or just west of a Low-level Theta-E Ridge Axis.")
22
SR PPTC Composites (PRE - 12)
Trough axis Ridge axis θe-Ridge axis 700 mb heights (dam) and upward vertical motion (shaded, μb s-1) 925 mb heights (dam), θe (K), and mb winds (shaded, m s-1) Center of composite TC
 and upward vertical motion (shaded, μb s-1) 925 mb heights (dam), θe (K), and 200 mb winds (shaded, m s-1) Center of composite TC.")
23
SR PPTC Composites (At Time of PRE)
Trough axis Ridge axis θe-Ridge axis 700 mb heights (dam) and upward vertical motion (shaded, μb s-1) 925 mb heights (dam), θe (K), and mb winds (shaded, m s-1) Center of composite TC Centroid of 1st composite PRE
 and upward vertical motion (shaded, μb s-1) 925 mb heights (dam), θe (K), and 200 mb winds (shaded, m s-1) Center of composite TC. Centroid of 1st composite PRE.")
24
SR PPTC Composites (PRE + 12)
Ridge axis Trough axis θe-Ridge axis 700 mb heights (dam) and upward vertical motion (shaded, μb s-1) 925 mb heights (dam), θe (K), and mb winds (shaded, m s-1) Center of composite TC Centroid of 1st composite PRE Centroid of 2nd composite PRE
 and upward vertical motion (shaded, μb s-1) 925 mb heights (dam), θe (K), and 200 mb winds (shaded, m s-1) Center of composite TC. Centroid of 1st composite PRE. Centroid of 2nd composite PRE.")
25
Common Detracting Elements for PRE Formation
A Zonal Flow Pattern is in place Poleward of the TC Lack of merdional flow discourages northward return of deep tropical moisture away from the TC itself The Long-wave Mid-level Trough Axis is already east of the TC’s Longitude A Low-level Blocking Ridge is located north / northeast of the TC Tends to prevent significant moisture inflow into any frontal boundaries or jet circulations that may be poleward of the TC

26
SR Null-Case Composites
700 mb heights (dam) and upward vertical motion (shaded, μb s-1) 925 mb heights (dam), θe (K), and mb winds (shaded, m s-1) Center of composite TC
 and upward vertical motion (shaded, μb s-1) 925 mb heights (dam), θe (K), and 200 mb winds (shaded, m s-1) Center of composite TC.")
27
Case Study (TC Erin, 2007) CG Landfall PPTC
Several PRE were associated with Erin (typical of CG PPTC) Erin’s PRE exhibited many of the “classic” synoptic-scale ingredients Within RRQ of an upper-level jet Deep moisture was fed northward into the PRE / pronounced theta-e ridging developed A low-level boundary was in the vicinity
 Erin’s PRE exhibited many of the classic synoptic-scale ingredients. Within RRQ of an upper-level jet. Deep moisture was fed northward into the PRE / pronounced theta-e ridging developed. A low-level boundary was in the vicinity.")
28
Track of Erin (Aug , 2007) 20/00z 19/12z 19/06z 19/00z 18/12z
 20/00z 19/12z 19/06z 19/00z 18/12z")
29
Multiple PRE Producer (First 2 PRE)
PRE #2 – 4-8” ( mm) of rain early on 8/18/07 PRE #1 – 3-6” ( mm) of rain late on 8/17/07 (“Along-track” PRE)
 of rain early on 8/18/07. PRE #1 – 3-6 ( mm) of rain late on 8/17/07 ( Along-track PRE)")
30
Locally 12+” (300+ mm) of rain on the evening of 8/18/07
Erin’s 3rd PRE Locally 10+ “ Locally 12+” (300+ mm) of rain on the evening of 8/18/07
 of rain on the evening of 8/18/07.")
31
Ramifications of PRE #3 12” - 15” of rain fell in 6 hours or less over parts of Southeastern MN and Southwestern WI Record flooding Several fatalities

32
MSLP Isobars and Mean 925-850 mb Winds
Water Vapor – 02z, 8/19/07 Significant PRE Erin’s Moisture Plume L TD Erin MSLP Isobars and Mean mb Winds

33
300 mb Analysis – 00z, 8/19/07 PRE Jet Entrance Region

34
850 mb Moisture Transport - 00z, 8/19/07
PRE L TD Erin

35
Surface Analysis + Radar - 00z, 8/19/07
PRE

36
Flooding Pictures

37
Null-Case Study (TC Gabrielle, 2007)
Became a Tropical Storm over the western Atlantic, before brushing the Outer Banks of NC Then recurved towards the east-northeast over the open Atlantic (Would be categorized as an AR TC) No PRE were associated with this TC Expansive ridge axis blocked advection of deeper moisture into the U.S.
 No PRE were associated with this TC. Expansive ridge axis blocked advection of deeper moisture into the U.S.")
38
Track of Gabrielle (Sept. 8-12, 2007)
")
39
24 Hour QPE –Ending 12z, Sept. 10, 2007 Localized 1-2” (25-50 mm) rainfall amounts in a 24 hour period – Available moisture was not associated with Gabrielle
 rainfall amounts in a 24 hour period – Available moisture was not associated with Gabrielle.")
40
MSLP Isobars and Mean 925-850 mb Winds
Water Vapor – 09z, 9/09/07 Frontal Plume of Moisture…Disconnected from Gabrielle Dry Wedge Gabrielle MSLP Isobars and Mean mb Winds

41
300 mb Analysis – 12z, 9/09/07 Trough Axis Ridge Axis L Gabrielle

42
850 mb Moisture Transport – 12z, 9/09/07
Axis of minimum Theta-e L Gabrielle

43
Surface Analysis + Radar - 12z, 9/09/07
Ridge axis blocks inflow of moisture towards poleward front

44
Conceptual Model: LOT PRE (SR/AR TC)
UL Jet LL θe-Ridge Axis PREs See inset ML Streamlines TC Rainfall Revised and updated from Fig. 13 of Bosart and Carr (1978) Representative TC Tracks
 Representative TC Tracks.")
45
Conceptual Model (More Detailed Inset) LL Temp/ Moisture Boundary
UL Jet LL θe-Ridge Axis LL Temp/ Moisture Boundary Mountain Axes UL Jet LL θe-Ridge Axis PREs PREs Idealized LL Winds ML Streamlines TC Rainfall TC Tracks

46
Summary – Forecast Challenges
NWP models are often poor with the placement / intensity of PRE Attention is frequently diverted away from potential PRE development PRE can impact almost any area of the CONUS

47
Summary – PRE Statistics
About 1/3 of U.S. Landfalling TC in our period of study ( ) were PPTC LOT PRE were the most common Typically the best synoptic enhancement AT PRE can be the most dangerous Double-shot of heavy rainfall ROT PRE tended to display the highest rainfall rates Typically slower moving PRE, with less synoptic forcing Orography perhaps more important
 were PPTC. LOT PRE were the most common. Typically the best synoptic enhancement. AT PRE can be the most dangerous. Double-shot of heavy rainfall. ROT PRE tended to display the highest rainfall rates. Typically slower moving PRE, with less synoptic forcing. Orography perhaps more important.")
48
Summary – Similarity of TC Tracks
SR TC had the highest percentage of PPTC AR TC were the most common in our period of study However, had a lower percentage of PPTC CG TC had the lowest percentage of PPTC However, CG PPTC were the most prolific PRE producers (an average of 3-4 PRE per TC)
")
49
Summary – Favored PRE Locations
Within the RRQ of a strengthening poleward upper-level jet streak Downstream of a mid-level trough, which is well west of the parent TC’s longitude Near a low-level boundary On the northern or western fringes of a deep tropical moisture plume (evident on water vapor imagery) Near or just west of a low-level theta-e ridge axis
 Near or just west of a low-level theta-e ridge axis.")
50
Summary – Unfavorable Setup for PRE
A de-amplified, zonally oriented flow pattern is in place north of the TC The main poleward mid-level trough axis is already at, or east of the TC’s longitude A low-level blocking ridge is north / northeast of the TC

51
Future Work Expand PRE database to include the western U.S. (Pacific Basin TC) Add composites / conceptual models for AT and ROT PRE, and possibly other TC tracks (i.e. CG) Develop a technique to identify / quantify PRE rainfall in TC precipitation analyses Perform modeling studies to interrogate the role that TC have in modulating the strength of poleward jets
 Develop a technique to identify / quantify PRE rainfall in TC precipitation analyses. Perform modeling studies to interrogate the role that TC have in modulating the strength of poleward jets.")
52
References Atallah, E. H., and L. F. Bosart, 2003: The extratropical transition and precipitation distribution of Hurricane Floyd (1999). Mon. Wea. Rev., 131, 1063–1081. Atallah, E., L. F. Bosart, and A. R. Aiyyer, 2007: Precipitation distribution associated with landfalling tropical cyclones over the eastern United States. Mon. Wea. Rev., 135, 2185–2206. Bosart and F. H. Carr, 1978: A case study of excessive rainfall centered around Wellsville, New York, June Mon. Wea. Rev., 106, 348–362. Bosart and D. B. Dean, 1991: The Agnes rainstorm of June 1972: Surface feature evolution culminating in inland storm redevelopment. Wea. and Forecasting, 6, 515–537. Brooks, H. E., and D. J. Stensrud, 2000: Climatology of heavy rain events in the United States from hourly precipitation observations. Mon. Wea. Rev., 128, 1194–1201. DeLuca, D. P., 2004: The distribution of precipitation over the Northeast accompanying landfalling and transitioning tropical cyclones. M.S. thesis, Department of Earth and Atmospheric Sciences, University at Albany, State University of New York, 177 pp. DiMego, G. J., and L. F. Bosart, 1982a: The transformation of tropical storm Agnes into an extratropical cyclone. Part I: The observed fields and vertical motion computations. Mon. Wea. Rev., 110, 385–411. LaPenta, K. D., and Coauthors, 1995: The challenge of forecasting heavy rain and flooding throughout the eastern region of the National Weather Service. Part I: Characteristics and events. Wea. Forecasting, 10, 78–90. Schumacher, R. S., and R. H. Johnson, 2005: Organization and environmental properties of extreme-rain-producing mesoscale convective systems. Mon. Wea. Rev., 133, 961–976. Uccellini, L. W., and D. R. Johnson, 1979: The coupling of upper and lower tropospheric jet streaks and implications for the development of severe convective storms. Mon. Wea. Rev., 107, 682–703. Ulbrich, C. W., and L. G. Lee, 2002: Rainfall characteristics associated with the remnants of tropical storm Helene in upstate South Carolina. Wea. Forecasting, 17, 1257–1267.
. Mon. Wea. Rev., 131, 1063–1081. Atallah, E., L. F. Bosart, and A. R. Aiyyer, 2007: Precipitation distribution associated with landfalling tropical cyclones over the eastern United States. Mon. Wea. Rev., 135, 2185–2206. Bosart and F. H. Carr, 1978: A case study of excessive rainfall centered around Wellsville, New York, June Mon. Wea. Rev., 106, 348–362. Bosart and D. B. Dean, 1991: The Agnes rainstorm of June 1972: Surface feature evolution culminating in inland storm redevelopment. Wea. and Forecasting, 6, 515–537. Brooks, H. E., and D. J. Stensrud, 2000: Climatology of heavy rain events in the United States from hourly precipitation observations. Mon. Wea. Rev., 128, 1194–1201. DeLuca, D. P., 2004: The distribution of precipitation over the Northeast accompanying landfalling and transitioning tropical cyclones. M.S. thesis, Department of Earth and Atmospheric Sciences, University at Albany, State University of New York, 177 pp. DiMego, G. J., and L. F. Bosart, 1982a: The transformation of tropical storm Agnes into an extratropical cyclone. Part I: The observed fields and vertical motion computations. Mon. Wea. Rev., 110, 385–411. LaPenta, K. D., and Coauthors, 1995: The challenge of forecasting heavy rain and flooding throughout the eastern region of the National Weather Service. Part I: Characteristics and events. Wea. Forecasting, 10, 78–90. Schumacher, R. S., and R. H. Johnson, 2005: Organization and environmental properties of extreme-rain-producing mesoscale convective systems. Mon. Wea. Rev., 133, 961–976. Uccellini, L. W., and D. R. Johnson, 1979: The coupling of upper and lower tropospheric jet streaks and implications for the development of severe convective storms. Mon. Wea. Rev., 107, 682–703. Ulbrich, C. W., and L. G. Lee, 2002: Rainfall characteristics associated with the remnants of tropical storm Helene in upstate South Carolina. Wea. Forecasting, 17, 1257–1267.")
53
Any Questions ?? Thank You !!

54
WFO BGM Usage of HPC Products
Days 4-7 Gridded Output (Medium Range) Common starting point HPC has access to more model data / better ensembling capabilities (“Master Blender”) Preferable to always populating with one model (GMOS grids) Lets us focus on short-term issues
 Common starting point. HPC has access to more model data / better ensembling capabilities ( Master Blender ) Preferable to always populating with one model (GMOS grids) Lets us focus on short-term issues.")
55
Usage of HPC Stuff (Shorter Range)
Model diagnostics Will view discussions / graphics in more complicated scenarios Especially when there’s significant model discrepancies QPF / Excessive Rainfall Will often use HPC QPF, or a blend of HPC and other model QPF’s in the first 24 – 48 hours Depending on timing, may use data from a previous model cycle Will utilize Excessive Rainfall discussions / graphics as guidance in heavy precipitation situations Winter Weather Desk Will typically view WWD graphics as a “reality check” against our thinking Particularly with mixed phase events / model disagreements

Similar presentations


 National.>")
, Brian Hoskins.>")

