Download presentation
Presentation is loading. Please wait.

2
Sleeping and Happiness
Hours slept (X) Happiness (Y) Pam 8 7 Jim 9 Dwight 5 4 Michael 6 Meredith You are interested in the relationship between hours slept and happiness. 1) Make a scatter plot 2) Guess the correlation 3) Guess and draw the location of the regression line
 Happiness. (Y) Pam Jim. 9. Dwight Michael. 6. Meredith. You are interested in the relationship between hours slept and happiness. 1) Make a scatter plot. 2) Guess the correlation. 3) Guess and draw the location of the regression line.")
3
. . . . . r = .76

4
Remember this: Statistics Needed
Need to find the best place to draw the regression line on a scatter plot Need to quantify the cluster of scores around this regression line (i.e., the correlation coefficient)
")
5
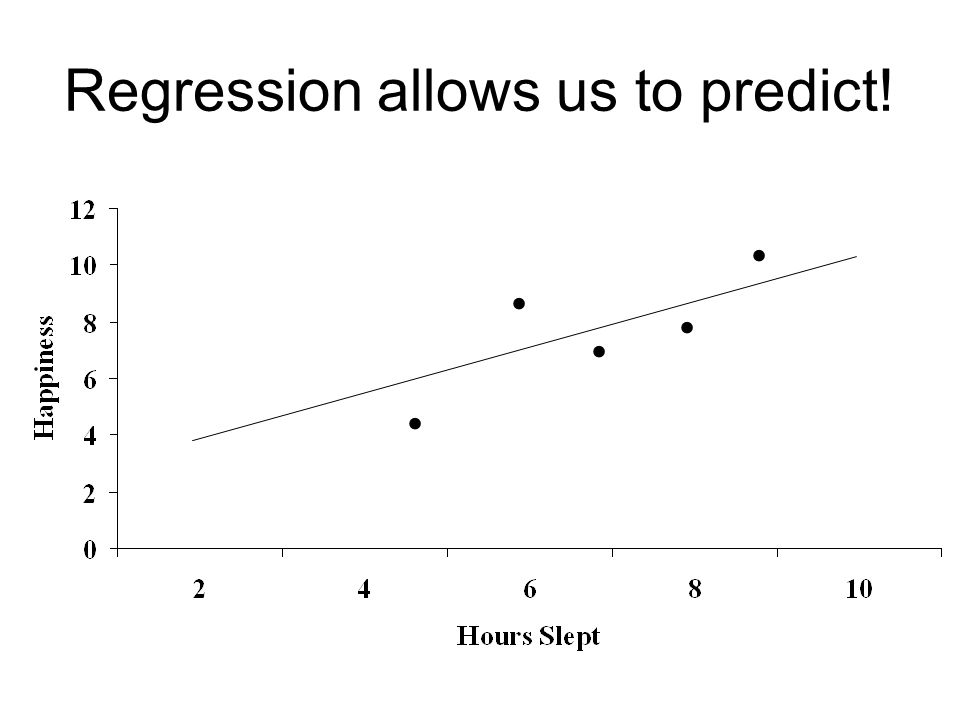
Regression allows us to predict!
. . . . .
6
Straight Line Y = mX + b Where:
Y and X are variables representing scores m = slope of the line (constant) b = intercept of the line with the Y axis (constant)
 b = intercept of the line with the Y axis (constant)")
7
Excel Example

8
That’s nice but How do you figure out the best values to use for m and b ? First lets move into the language of regression

9
Straight Line Y = mX + b Where:
Y and X are variables representing scores m = slope of the line (constant) b = intercept of the line with the Y axis (constant)
 b = intercept of the line with the Y axis (constant)")
10
Regression Equation Y = a + bX Where:
Y = value predicted from a particular X value a = point at which the regression line intersects the Y axis b = slope of the regression line X = X value for which you wish to predict a Y value

11
Practice Y = -7 + 2X What is the slope and the Y-intercept?
Determine the value of Y for each X: X = 1, X = 3, X = 5, X = 10

12
Practice Y = -7 + 2X What is the slope and the Y-intercept?
Determine the value of Y for each X: X = 1, X = 3, X = 5, X = 10 Y = -5, Y = -1, Y = 3, Y = 13

13
Finding a and b Uses the least squares method Minimizes Error
Error = Y - Y (Y - Y)2 is minimized
2 is minimized.")
14
. . . . .

15
. . . . . Error = Y - Y (Y - Y)2 is minimized Error = 1 Error = .5
2 is minimized Error = 1 Error = .5")
16
Finding a and b Ingredients r value between the two variables
Sy and Sx Mean of Y and X

17
b = b r = correlation between X and Y SY = standard deviation of Y
SX = standard deviation of X

18
a a = Y - bX Y = mean of the Y scores b = regression coefficient computed previously X = mean of the X scores

19
Mean Y = 4.6; SY = 2.41 r = .88 Mean X = 3.0; SX = 1.41

20
Mean Y = 4.6; SY = 2.41 r = .88 Mean X = 3.0; SX = 1.41

21
Mean Y = 4.6; SY = 2.41 r = .88 Mean X = 3.0; SX = 1.41
b =

22
Mean Y = 4.6; SY = 2.41 r = .88 Mean X = 3.0; SX = 1.41
b = .88 1.50 1.41

23
Mean Y = 4.6; SY = 2.41 r = .88 Mean X = 3.0; SX = 1.41 b = 1.5
a = Y - bX

24
Mean Y = 4.6; SY = 2.41 r = .88 Mean X = 3.0; SX = 1.41 b = 1.5
0.1 = (1.50)3.0
3.0.")
25
Regression Equation Y = a + bX Y = (1.5)X
X")
26
Y = (1.5)X . . . . .
X")
27
Y = (1.5)X X = 1; Y = 1.6 . . . . . .
X X = 1; Y =")
28
Y = (1.5)X X = 5; Y = 7.60 . . . . . . .
X X = 5; Y =")
29
Y = (1.5)X . . . . . . .
X")
Similar presentations

 3. The y - intercept.>")


