Download presentation
Presentation is loading. Please wait.

1
Observations des données: recherche des régions spectrales corrélées

2
6- Classification de spectres Etant donné un nombre de spectres, comment les classer par “ressemblance”

3
6- Classification de spectres hierarchical clustering Step 1: the Euclidian distance between each pair of spectra is calculated. Figure: 5 spectra represented in a 2-D space (say we recorded only the absorbance at two wavenumbers)
.")
4
6- Classification de spectres Step 2: grouping starts by linking the closest spectra. Figure: grouping of spectra (#1 to 5) and clusters (beyond #5) hierarchical clustering
 and clusters (beyond #5) hierarchical clustering.")
5
6- Classification de spectres Step 3: dendrogram representation. Statistical significance of the distances hierarchical clustering

6
50 protéines

7
6- Classification de spectres donovani hierarchical clustering

8
6- Classification de spectres K-means clustering kmeans treats each spectrum as an object having a location in space. It finds a partition in which spectra within each cluster are as close to each other as possible, and as far from spectra in other clusters as possible. kmeans uses an iterative algorithm that minimizes the sum of distances from each object to its cluster centroid, over all clusters. This algorithm moves objects between clusters until the sum cannot be decreased further. The result is a set of clusters that are as compact and well-separated as possible.

9
Identification de lignées cellulaires

10
Chemical differences as (CH 3 ) s (CH 3 ) as (CH 2 ) (C=O) ester (CH 3 ) (CH 2 ) as (PO 2 - ) (C-O) s (PO 2 - ) as (N-(CH 3 ) 3 + ) Amide I (C=O) amide Amide II (N-H) amide (C-OH) Phospholipid (DMPC) Glycoprotéine Mucine RNA DNA Correlated with growth, not with species
 s (CH 3 ) as (CH 2 ) (C=O) ester (CH 3 ) (CH 2 ) as (PO 2 - ) (C-O) s (PO 2 - ) as (N-(CH 3 ) 3 + ) Amide I (C=O) amide Amide II (N-H) amide (C-OH) Phospholipid (DMPC) Glycoprotéine Mucine RNA DNA Correlated with growth, not with species")
11
INFRARED MEASUREMENTS X3

12
Infrared spectrum of a cell The conformation of the molecules, especially proteins IR spectrum = fingerprint of: The chemical nature of the components (glycosylations, DNA, RNA, proteins, lipids,….)
")
13
Fingerprinting and cell classification

14
Dendrogram of a hierarchical cluster analysis performed on 240 spectra of different strains of Gram-positive and Gram-negative bacteria, and of yeasts belonging to the genus Candida (a). Dendrogram obtained when cluster analysis is performed on the yeast spectra only (b). FTIR of bacteria
. FTIR of bacteria.")
16
Spectral typing of closely related microorganisms. (a) Clinical isolates of E. coli (numbers in right column) belonging to different serogroups: O 25, O 18, and O 114 according to their O-antigenic structure. FTIR of bacteria
 Clinical isolates of E. coli (numbers in right column) belonging to different serogroups: O 25, O 18, and O 114 according to their O-antigenic structure. FTIR of bacteria.")
17
Application à des cellules eucaryotes 1.Identification de Leismania sp. 2.Cellules leucémiques K562 wt ou résistantes 3.Classification de cellules gliales 4.Mode d’action de molécules anticancéreuses 5.Etudes microscopiques de tissus

18
L. lainsoni versus L. brasiliensis (87 spectra)
")
19
recording: 2 cm -1, 256 scans noise evaluation Water vapor subtraction (when necessary), apodization at 4 cm -1 final resolution Baseline subtraction (typically 3620 3010 2700 2395 2247 1775 1718 1483 1434 1353 1196 948 845) Scaling for a same area under 1718-1483 cm -1 Spectra recording and processing
, apodization at 4 cm -1 final resolution Baseline subtraction (typically ) Scaling for a same area under cm -1 Spectra recording and processing")
20
Identification de cellules eucaryotes Leishmania lainsoni Leishmania brasiliensis

21
Différences significatives (Student test) Différence des moyennes Moyenne pour L. lainsoni Moyenne pour L. brasiliensis * Student positive, alpha=0.01

22
Classification supervisée / non supervisée Analyse non supervisée: decomposition en composants principaux (cross validation) Analyse supervisée: régression linéaire (cross validation)
 Analyse supervisée: régression linéaire (cross validation)")
23
Distance between spectra Model built after variable selection and principal component analysis Leishmania lainsoni Leishmania brasiliensis

24
L. lainsoni versus L. brasiliensis MANOVA using 1753, 1724, 3008 and 1430 cm -1 L. brasiliensis L. lainsoni

25
Classification de quatre espèces Leishmania peruviana Leishmania lainsoni Leishmania donovani Leishmania brasiliensis

26
Distance analysis between species donovani

27
Chemical differences * Student positive, alpha=0.01 Mean L. brasiliensis – Mean L. lainsoni as (CH 3 ) s (CH 3 ) as (CH 2 ) (C=O) ester (CH 3 ) (CH 2 ) as (PO 2 - ) (C-O) s (PO 2 - ) as (N-(CH 3 ) 3 + ) Amide I (C=O) amide Amide II (N-H) amide (C-OH) Phospholipid (DMPC) Glycoprotéine Mucine RNA DNA Correlated with growth, not with species
 s (CH 3 ) as (CH 2 ) (C=O) ester (CH 3 ) (CH 2 ) as (PO 2 - ) (C-O) s (PO 2 - ) as (N-(CH 3 ) 3 + ) Amide I (C=O) amide Amide II (N-H) amide (C-OH) Phospholipid (DMPC) Glycoprotéine Mucine RNA DNA Correlated with growth, not with species.")
28
Difference of the means Strain 1, mean Strain 2, mean Effect of culture growth. Comparing two strains. Culture day

29
CONCLUSIONS 1.Certaines régions spectrales décrivent la croissance de la culture indépendamment de l’espèce 2.D’autres régions décrivent l’espèce indépendamment de l’état de la culture 3.La spectroscopie FTIR peut devenir un outil rapide et économique pour la détermination de Leishmania sp.

30
trace A: Representative infrared spectrum of resistant K562 cells. trace B: Representative infrared spectrum of sensitive K562 cells. trace C: Difference infrared spectrum between resistant and sensitive K562 cells, this spectrum is magnified 4 times. trace D: Result of the Student test performed at alpha level = 5%, the wavelengths in blue are significantly different between the two cell lines. Example of information retrieved from the data: the intensity ratio between 2958cm -1 (CH 3 stretching) and 2923cm -1 (CH 2 stretching) is increased by 20% in resistant cells, suggesting a qualitative modification of the lipids in the cell membranes. 2) Resistant / sensitive K562
 and 2923cm -1 (CH 2 stretching) is increased by 20% in resistant cells, suggesting a qualitative modification of the lipids in the cell membranes. 2) Resistant / sensitive K562.")
31
2D plot of K562 sensitive (22 spectra, blue points) and resistant (26 spectra, red stars) cells spectra reduced by PCA. Unsupervised classification

32
Belot et al., Glia 2001, 36, 375-390 3) Identification de phénotypes: le cas des gliomes
 Identification de phénotypes: le cas des gliomes")
33
In vitro parameters : Motility : Maximum Relative Distance from the Origin Motility : Average Speed Growth : Anchorage-dependent growth Growth : Anchorage-independent growth (in semi-solid agar) Invasion : percentage of cells invading a collagen matrix In vivo parameter : Aggressiveness : Median Survival Time 2852 cm -1 2983 cm -1 2945 cm -1 Identification de phénotypes: le cas des gliomes
 Invasion : percentage of cells invading a collagen matrix In vivo parameter : Aggressiveness : Median Survival Time 2852 cm cm cm -1 Identification de phénotypes: le cas des gliomes")
35
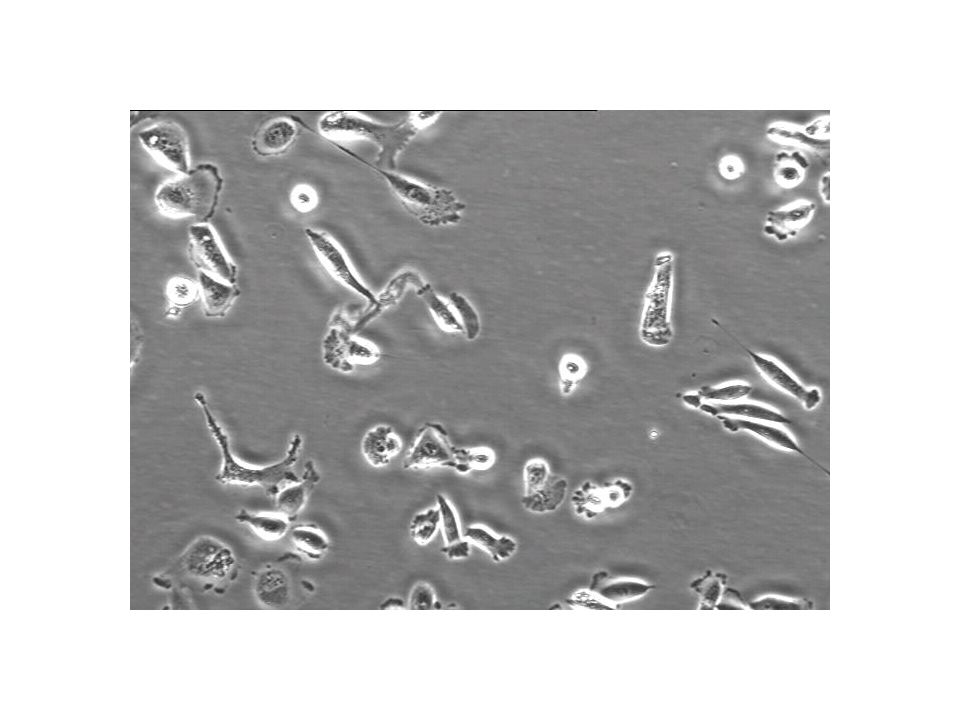
Sample preparation FTIR de cellules Identification de phénotypes: le cas des gliomes

36
16 cell lines used Identification de phénotypes: le cas des gliomes

37
Multiple regression explaining the average speed R = 0.96 (P = 0.003). Multiple regression explaining the median survival periods of the nude mice grafted with glioma cells. R = 0.97 (P = 5 10 -3 ). Average speed Median survival time Identification de phénotypes: le cas des gliomes
. Average speed Median survival time Identification de phénotypes: le cas des gliomes.")
38
Mode d’action de molécules anticancéreuses

39
Studies on cells - PC-3 prostate cancer cells in culture - Washed in 0.9% NaCl - Deposited on a BaF 2 window

40
Daunorubicine Doxorubicine Irinotecan Mercaptopurine Méthotrexate Paclitaxel Vinblastine Vincristine Non traitées

41
Daunorubicin Doxorubicin Mercaptopurine Methotrexate Paclitaxel Vinblastine Vincristine Distance Hierarchichal classification of “ difference spectra” FTIR of drug signature on cancer cells

42
Model Predicted Control Topoiso- merases inhibitors Antimeta- bolites Antimicro- tubules Training Control97.302.70 Topoiso- merases inhibitors 099.700.3 Antimeta- bolites 4.3094.31.4 Antimicro- tubules 6.100.493.5 FTIR of drug signature on cancer cells

Similar presentations


 Dimension reduction theory (PCA/Clustering) Dimension reduction.>")


 Analysis of co-expression Search for similarly expressed genes experiment1 experiment2 experiment3 ……….. Gene i:>")