Download presentation
Presentation is loading. Please wait.

1
NORTHUMBERLAND VISITOR SURVEY 2010 NORTHUMBERLAND ATTRACTIONS ASSOCIATION 24 th JANUARY 2011

2
AGENDA −METHODOLOGY −VISITOR PROFILES −ACCOMMODATION −MOTIVATIONS AND INFLUENCES −EXPENDITURE −IMPORTANCE AND SATISFACTION

3
OBJECTIVES −Inform development and investment decisions −Understand visitor satisfaction – Where can we improve? −Understand what draws visitors to the region −Understand our visitor profiles – target market more effectively, tailor our products −Understand where visitors are spending their money

4
METHODOLOGY −3 RD Region wide visitor survey −1600 core sample – 400 in each sub region −1 st May and 19 th September 2010 −Total completed surveys in Northumberland – 602 Northumberland National Park and North Pennines AONB Booster samples −Respondents qualified as tourists Excluding people on business, on regular shopping trip etc −Quotas set for: 50% overnight (achieved 47%) A maximum of 25% shoppers (achieved 9%) At least 25% from outside of the region (achieved 36%)
 A maximum of 25% shoppers (achieved 9%) At least 25% from outside of the region (achieved 36%)")
5
METHODOLOGY INTERVIEW LOCATIONS Kielder (Leaplish waterside park)30 Wooler20 Alnwick Garden60 Woodhorn Museum near Ashington60 Lindisfarne Castle30 Bamburgh Castle20 The Chantry TIC Morpeth30 Berwick TIC30 Vindolanda60 Seahouses60 Rothbury Tourist Information centre100 Allen Banks and Staward Gorge (AONB)51 Blanchland (AONB)51 602
30 Wooler20 Alnwick Garden60 Woodhorn Museum near Ashington60 Lindisfarne Castle30 Bamburgh Castle20 The Chantry TIC Morpeth30 Berwick TIC30 Vindolanda60 Seahouses60 Rothbury Tourist Information centre100 Allen Banks and Staward Gorge (AONB)51 Blanchland (AONB)51 602")
6
VISITOR PROFILES

7
DAY/OVERNIGHT

8
GROUP COMPOSITION

9
AGE PROFILES

10
AGE COMPARISONS

11
ORIGIN OF VISITORS

12
TRAVEL TO THE REGION 87% 4% 3% 7% 3% 1% 2% 1%

13
VISITOR SEGMENTS

14
ADDITIONAL DATA −16% of visitors to Northumberland were new visitors – higher than all other sub regions −36% have been more than 20 times before UKOVERSEASDAYOVERNIGHT First visit in five years 9%23%4%13% 2 - 3 times 24%23%15%30% 4 - 6 times 12%4%8%14% 7 - 8 times 3%4%2%3% 9 - 10 times 4% 3%4% 11 - 20 times 4%12%5%4% More than 20 times 36%27%50%25% Don't know / can't remember 10%4%14%7%

15
ACCOMMODATION

16
WHERE ARE VISITORS STAYING?..... Overnight visitors to Northumberland are most likely to be staying in……….. −Berwick – 8% −Seahouses – 6% −Rothbury – 6% −Wooler – 5% −Bamburgh – 4% −Alnwick – 4% −Newcastle – 4% −Durham – 3%

17
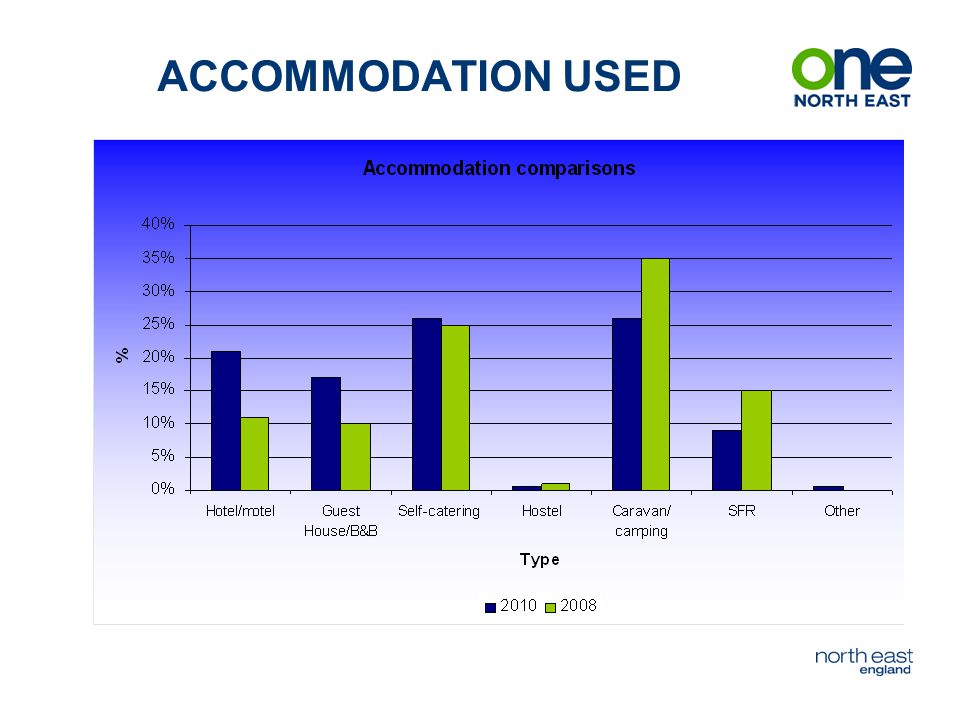
ACCOMMODATION USED

20
AVERAGE LENGTH OF STAY

21
LEAD TIMES

22
LEAD TIME COMPARISONS

23
THE BOOKING PROCESS

24
MOTIVATIONS AND INFLUENCES

25
MAIN REASON FOR VISIT What was your main reason for visiting?20102008 General Sightseeing23%30% Visiting heritage sites, castles, monuments, churches etc12%9% Visit market town/ village11%4% walking 2+ miles9%4% VFR8% Visiting artistic or heritage exhibits, museums galleries etc7% walking <2 miles3%2% Nature Reserve/ Wildlife2%1% Eating out2%0% Visiting beach2%3%

26
INFORMATION/INFLUENCE LEVELS 2010 On/from a previous visit 64% Advertising in newspaper/magazine4% Advice from friends/relatives 22% www.visitnorthumberland.com 7% Newspaper/magazine articles 2% Travel agent/Tour Operator 1% Internet 4% www.visitnortheastengland.com 2% Free tourist brochure 1% Tourist Information Centre 2%

27
INFORMATION/INFLUENCE LEVELS 2010 2008 On/from a previous visit 64% 47% Advertising in newspaper/magazine4% 2% Advice from friends/relatives 22% 19% www.visitnorthumberland.com 7% n/a Newspaper/magazine articles 2% 3% Travel agent/Tour Operator 1% 3% Internet 4% 5% www.visitnortheastengland.com 2% 6% Free tourist brochure 1% 0% Tourist Information Centre 2% 0%

28
USE OF INFORMATION

30
SOURCES OF INFORMATION

31
USE OF GUIDES – DURING VISIT 11% 6% Most used of all sub regional/ local guides

32
EXPENDITURE

33
ALL VISITOR EXPENDITURE 201020082005/06 Accommodation25.1726.8129.01 Non-routine shopping4.623.672.68 Food and drink12.248.8610.63 Transport6.514.275.21 Entertainment3.723.604.46 Grocery shopping4.133.264.16 Miscellaneous2.130.522.05 total58.5250.9958.20

34
IMPORTANCE AND SATISFACTION

35
IMPORTANCE Very UnimportantUnimportantNeitherImportant Very important Attractions2484442 Retail1319263111 Information47154827 Accommodation15343642 Eating establishments2475334 Ease of Parking2245042 Transport127213625 Signage24114935 Nightlife451026145 Car Parking3364643 Cleanliness0114553

36
SATISFACTION %Very poorPoorNeitherGood Very Good Visitor Attractions0123562 Shopping02165923 Visitor Information0134749 Accommodation1143956 Eating0055639 Ease of Parking1245044 Transport0144550 Signage0146035 Nightlife11159260 Car Parking0235342 Cleanliness0124157

37
SATISFACTION COMPARISONS Very Good North EastTees ValleyNorthumberland County Durham Tyne and Wear Visitor Attractions49%33%62%49%47% Shopping23%18%23%24% Visitor Information40%28%49%37%41% Accommodation53%44%56%54%56% Eating35%26%38%33%37% Ease of Parking40%34%44%37%43% Transport53%48%50%49%60% Signage34%35% 33% Nightlife30%18%26%33%39% Car Parking40%39%42%41%39% Cleanliness52%42%57%55%51%

38
CUSTOMER SERVICE

39
PERCEPTION OF THE REGION

40
COMPARISON TO DESTINATIONS −Q. Thinking of short break/holidays you have taken in the last two years, where did you visit most recently? BLACKPOOL CORNWALL COTSWOLDS CUMBRIA DERBY DEVON EDINBURGH EASTBOURNE FRANCE GLASGOW GREAT YARMOUTH ISLE OF WIGHT ITALY LAKE DISTRICT LIVERPOOL LONDON NORFOLK NEW YORK NORTH YORKS SPAIN WALES

41
COMPARISON TO DESTINATIONS Northumberland is……….BetterSimilarWorse Attractions76159 Shopping65278 Visitor Information45496 Accommodation40564 Eating Establishments75168 Nightlife20782 Cleanliness8568

42
RECOMMENDING NORTHUMBERLAND −98% of people would recommend Northumberland to friends −94% would recommend other parts of the North East −97% of overseas visitors would recommend Northumberland −96% of first time visitors would recommend Northumberland

43
SUMMARY −Almost 2/3rds of visitors to Northumberland stay overnight −Less than 1/5 th have children in their party −1 in 5 are on their first visit – 1/3rd have been more than 20 times −Growth in overnight staying in serviced accommodation, 1-3 months being the most common booking lead time, growth in shorter lead times −Growth in online bookings as well as people using the internet to find information while in Northumberland −1/5 th use free tourist brochure for information −More people are visiting market towns and looking for long walks

44
SUMMARY −Overseas and new first visitors are most in need of visitor information −Overall expenditure per person per day up £7, food and drink growth is strong −Satisfaction levels are good but could be better – although attractions, car parking and accommodation fared well −Customer service is good but not excellent −98% would recommend Northumberland to their friends and relatives

46
IAN THOMAS/TRACEY BAKER Tel: 0191 2296843/6844 Ian.thomas@onenortheast.co.uk www.tourismnortheast.co.uk

Similar presentations


>")

