Download presentation
Presentation is loading. Please wait.

2
Diabetes Mellitus

3
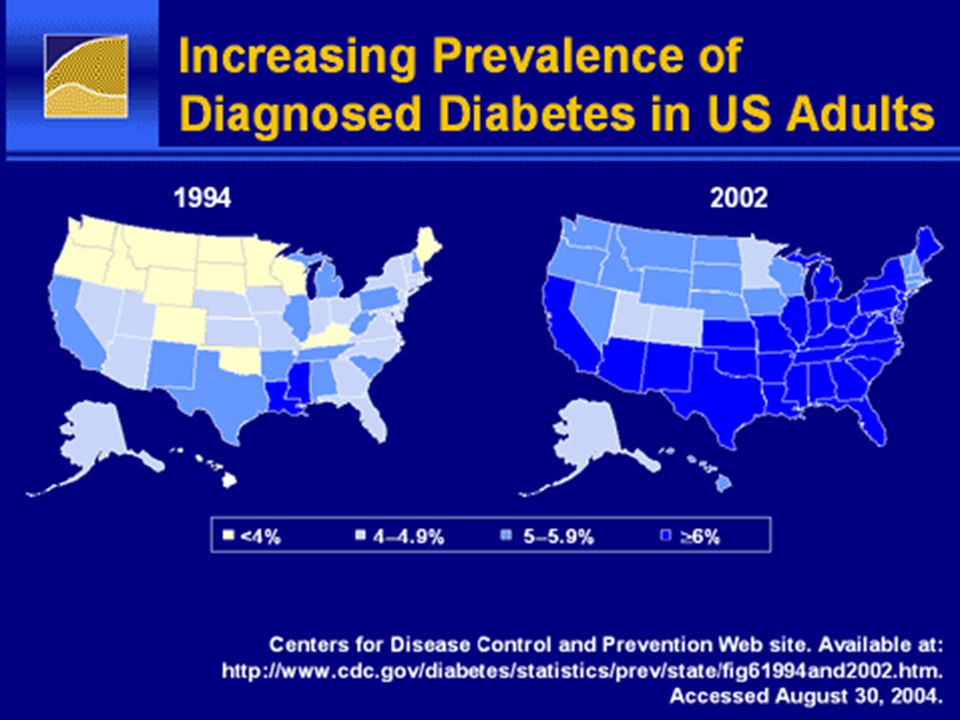
Estimated prevalence of diabetes worldwide in 2025
Number of persons <5,000 5,000 – 74,000 75,000 – 349,000 350,000 – 1,500,000 >1,500,000 No data available Diabetes affects over 140 million worldwide and this figure is likely to reach 300 million by 2025 The causes behind this rapid rise in prevalence include population growth and aging, an increasing trend towards a poor diet, obesity, a sedentary lifestyle and urbanization Type 2 diabetes represents therefore a major, and increasing, healthcare burden A projected 300 million people with diabetes worldwide by 2025 WHO. The World Health Report 1998; 91; King H, et al. Diabetes Care 1998; 21:1414–1431.

5
Pathophysiology- Type 2 DM
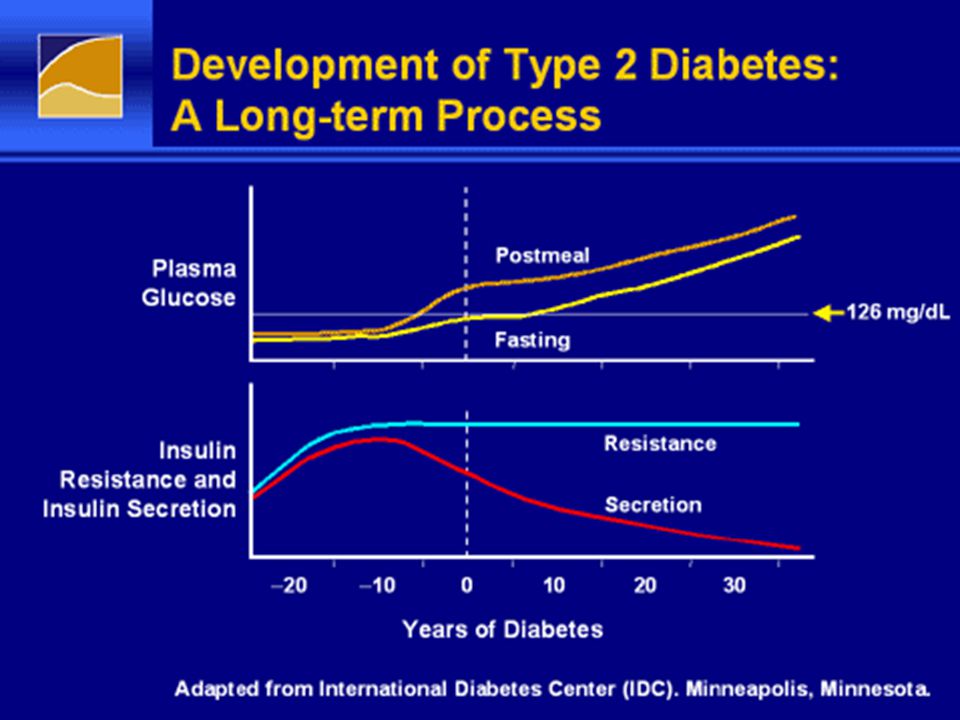
1. Progressive beta cell dysfunction: -Reduced Insulin secretion in response to serum glucose 2. Insulin resistance: genetic -increases with age and weight. - glucotoxicity - lipotoxicity

6
Pathophyisiology-T2DM
3. Impaired insulin processing: proinsulin ratio increase to 40% in T2DM from a nl ratio of 10-15%

7
Pathophysiology -Type 1DM
Epidemiology: - bimodal: a. one peak at 4-6 years of age b. second in early puberty (10-14 years) M=F.
 M=F.")
8
Genetic susceptibility -T1DM
• No family history: 0.4 % • affected mother: % • affected father: 5 to 8 % • both parents affected: 30 % • Non-twin sibling of affected patient: 5 % • Dizygotic twin: 8 % • Monozygotic twin: 50 % lifetime risk

9
Environmental factors-T1DM
• Viral infections • Immunizations • Diet: cow's milk at an early age • Vitamin D deficiency • Perinatal factors:maternal age, h/o pre- eclampsia, and neonatal jaundice Low birth weight decreases the risk of developing type 1 diabetes

10
Type 1 versus type 2 diabetes
1 • Body habitus : T2DM: overweight T1DM: not overweight and often have a recent history of weight loss. 2 • Age : T2DM :after the onset of puberty. T1DM bimodal: 4 -6 yrs, and yrs

11
3• Insulin resistance : acanthosis nigricans,HTN, dyslipidemia, and PCOS 4• FH: type 2 > type 1 5• Autoimmune Abs: T1DM: +:GAD, tyrosine phosphatase (IA2), and/or insulin Abs T2DM: 30 % have + Abs
, and/or insulin Abs. T2DM: 30 % have + Abs.")
12
Insulin resistance and -cell dysfunction
Increased lipolysis and release of free fatty acids Elevated circulating FFA lipotoxicity High insulin demand Insulin resistance -Cell dysfunction glucotoxicity Decreased glucose uptake into glucose output The consequences of insulin resistance include decreased insulin-dependent glucose uptake into liver, adipose tissue and muscle, as well as increased hepatic glucose production, resulting in hyperglycemia In addition, insulin resistance promotes excessive breakdown of triglycerides in adipose tissue, which increases circulating free fatty acids The combination of hyperglycemia and elevated fatty free acids may drive the deterioration in -cell function through glucotoxicity and lipotoxicity Hyperglycemia muscle and adipose tissue and raised hepatic Type 2 diabetes

15
Beta-cell function progressively declines
Extrapolation of beta-cell function prior to diagnosis 20 40 100 –4 6 –10 –8 –6 –2 2 4 80 60 –12 8 Diabetes diagnosis Years from diagnosis Beta-cell function (%, HOMA) Beta cell function progressively declines UKPDS shows that at the time of diagnosis -cell function is already markedly compromised by up to 50%, with -cell function continuing to deteriorate in the years following diagnosis. Furthermore, extrapolation of these data tells us that -cell function in UKPDS patients may have been suboptimal for 10 years prior to diagnosis. Reference UKPDS population: UKPDS 16. Diabetes 1995;44:1249–58 HOMA: homeostasis model assessment Lebovitz. Diabetes Reviews 1999;7:139–53 (data are from the UKPDS population: UKPDS 16. Diabetes 1995;44:1249–58)
 Beta cell function progressively declines. UKPDS shows that at the time of diagnosis -cell function is already markedly compromised by up to 50%, with -cell function continuing to deteriorate in the years following diagnosis. Furthermore, extrapolation of these data tells us that -cell function in UKPDS patients may have been suboptimal for 10 years prior to diagnosis. Reference. UKPDS population: UKPDS 16. Diabetes 1995;44:1249–58. HOMA: homeostasis model assessment Lebovitz. Diabetes Reviews 1999;7:139–53 (data are from the UKPDS population: UKPDS 16. Diabetes 1995;44:1249–58)")
16
Genetic susceptibilty- T2DM
- T2DM is 2-6x (blacks> whites) 39% have at least one parent with the disease monozygotic twin: 90 % The lifetime risk for a first-degree relative of a pt with T2DM is 5-10 x higher than age- & wt-matched
 39% have at least one parent with the disease. monozygotic twin: 90 % The lifetime risk for a first-degree relative of a pt with T2DM is 5-10 x higher than age- & wt-matched.")
17
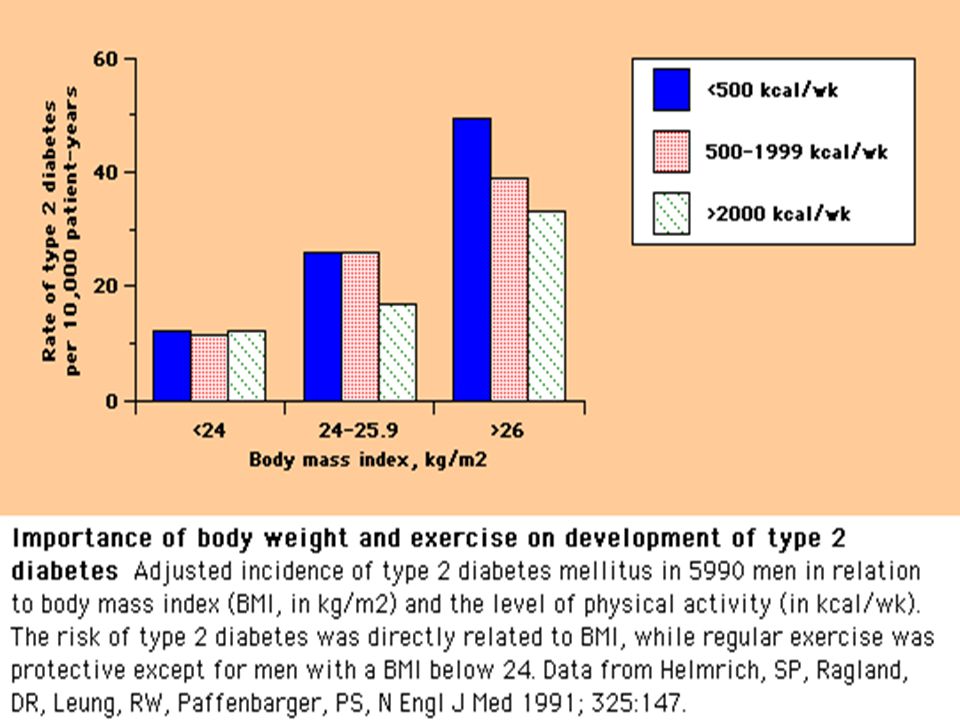
ROLE OF DIET, OBESITY, AND INFLAMMATION
Increasing weight and less exercise Obesity epidemic Increasing T2DM in children and adolescents

19
MAJOR RISK FACTORS ( Type2DM)
- FH of DM - Overweight (BMI > 25 kg/m2) -physical inactivity -Race/ethnicity (African-Americans, Hispanic-Americans) - h/o IFG or IGT -History of GDM or delivery of a baby weighing >9 lbs -Signs of insulin resistance or conditions associated with insulin resistance : *Hypertension ( 140/90 mmHg in adults) *HDL cholesterol 35 mg/dl (0.90 mmol/l) and/or a triglyceride level 250 mg/dl (2.82 mmol/l) *Polycystic ovary syndrome *acanthosis nigricans MAJOR RISK FACTORS ( Type2DM)
 -physical inactivity. -Race/ethnicity (African-Americans, Hispanic-Americans) - h/o IFG or IGT. -History of GDM or delivery of a baby weighing >9 lbs. -Signs of insulin resistance or conditions associated with insulin resistance : *Hypertension ( 140/90 mmHg in adults) *HDL cholesterol 35 mg/dl (0.90 mmol/l) and/or a triglyceride level 250 mg/dl (2.82 mmol/l) *Polycystic ovary syndrome *acanthosis nigricans. MAJOR RISK FACTORS ( Type2DM)")
20
Symptoms Polyuria, increased frequency of urination, nocturia.
Increased thirst, and dry mouth Weight loss Blurred vision Numbness in fingers and toes Fatigue Impotence (in some men)
")
21
Signs Weight loss: muscle weakness Decreases sensation
Loss of tendon reflexes Foot Inter-digital fungal infections Retinal changes by fundoscopy

22
Criteria for the diagnosis of diabetes
1. A1C ≥6.5 %. * 2. FPG ≥126 mg/dL . Fasting is defined as no caloric intake for at least 8 h.* 3. Two-hour plasma glucose ≥200 mg/dL during an OGTT. 75 g anhydrous glucose dissolved in water.* 4. In a patient with classic symptoms of hyperglycemia or hyperglycemic crisis, a random plasma glucose ≥200 mg/dL . * In the absence of unequivocal hyperglycemia, criteria 1-3 should be confirmed by repeat testing.

25
Diabetes Prevention-DPP trial
3234 obese (average BMI 34 kg/m2) age yrs at high risk for DM (Obese+ IFG/IGT) were randomized to: 1. Intensive lifestyle changes: 7 % wt loss ( low-fat diet and exercise for 150 min/ wk) 2. metformin (850 mg BID) + information on diet and exercise 3. Placebo plus information on diet and exercise
 age yrs at high risk for DM (Obese+ IFG/IGT) were randomized to: 1. Intensive lifestyle changes: 7 % wt loss ( low-fat diet and exercise for 150 min/ wk) 2. metformin (850 mg BID) + information on diet and exercise. 3. Placebo plus information on diet and exercise.")
26
DPP The intensive lifestyle and metformin interventions reduced the cumulative incidence of diabetes by 58 and 31 %, respectively compared to placebo.

27
DPP The diet and exercise group lost an average of 6.8 kg (7%) of wt / 1st yr. At 3 years, fewer patients in this group developed diabetes (14 versus 22 and 29 % in the metformin and placebo groups) Lifestyle intervention was effective in men and women in all age groups and in all ethnic groups.
 Lifestyle intervention was effective in men and women in all age groups and in all ethnic groups.")
28
DPP 16 % reduction in DM risk for every kg lost
Improvements in insulin sensitivity and insulin secretion, correlated directly with decreased risk of diabetes

29
Management of Type2DM 1. Lifestyle modifications:
- Medical nutrition therapy - increased physical activity - wt reduction 2. Oral Drug Therapy/Noninsulin sc therapy 3. Insulin therapy

30
Key challenges of type 2 diabetes: outcome
43% of patients do not achieve glycaemic targets (HbA1c<7%) Key challenges of type 2 diabetes: outcome The study by Ford et al aimed to examine trends in glycemic control among U.S. adults with diagnosed diabetes from 1999 to 2004. Data from The National Health and Nutrition Examination Survey (NHANES) 1999–2004 showed that 43% of diabetes patients aged >20 years+ were found to have HbA1c levels above 7%. The results from the study by Ford et al are consistent with other data suggesting that improvements in glycemic control have occurred among patients with diabetes in the U.S. The authors suggest that “as welcome as the recent favorable trends in glycemic control are, additional efforts are needed to help the 40% of patients with diabetes who do not have adequate glycemic control.” Reference Ford et al (NHANES). Diabetes Care. 2008; 31: 102–4 Ford et al (NHANES). Diabetes Care 2008;31:102–4
 Key challenges of type 2 diabetes: outcome. The study by Ford et al aimed to examine trends in glycemic control among U.S. adults with diagnosed diabetes from 1999 to Data from The National Health and Nutrition Examination Survey (NHANES) 1999–2004 showed that 43% of diabetes patients aged >20 years+ were found to have HbA1c levels above 7%. The results from the study by Ford et al are consistent with other data suggesting that improvements in glycemic control have occurred among patients with diabetes in the U.S. The authors suggest that as welcome as the recent favorable trends in glycemic control are, additional efforts are needed to help the 40% of patients with diabetes who do not have adequate glycemic control. Reference. Ford et al (NHANES). Diabetes Care. 2008; 31: 102–4. Ford et al (NHANES). Diabetes Care 2008;31:102–4.")
31
Current available Therapy
1. Biguanides: Metformin -decrease hepatic glucose output -increases glucose utilization in peripheral tissues (such as muscle and liver) -antilipolytic effect -increases intestinal glucose utilization Efficacy : HbA1c reduction by 1-1.5%
 -antilipolytic effect. -increases intestinal glucose utilization. Efficacy : HbA1c reduction by 1-1.5%")
32
Side Effects: GI upset initially, Lactic acidosis ( 9 cases per 100,000 person-years of exposure)e )
C/I : renal impairment S.Cr > 1.5 mg/dl males, and S.Cr > 1.4 Females, liver failure, advanced heart failure, sepsis, hypotension.

33
Drug therapy-2 2. Sufonylureas and Meglitinides: Glibenclamide, Repagnilide - Mechanism: activate SU receptor, stimulate insulin secretion - Efficacy : HbA1c reduction 1-2 % ( SU), <1% Glinides - S/E: Hypoglycemia, wt gain - C/I: pregnancy,
, <1% Glinides. - S/E: Hypoglycemia, wt gain. - C/I: pregnancy,")
34
Drug therapy-3 3. Alpha- glucosidase inhibitors: Acarbose
- inhibits GI glucose absorption - prominent GI S/E - modest HbA1c reductions 0.6%

35
4. Thiazolidinediones: Pioglitazones,Rosiglitazones
- PPAR Gamma agonists -insulin sensitizer on adipose tissue, liver, skeletal muscles. -S/E: fluid retention-edema,CHF, Hepatotoxicity, bone fractures, macular edema -Efficacy: HbA1c reduction %

36
Drug therapy-3 5. Incretin based therapy: a. DPP4 Inhibitors:
- inhibit Dipeptidylpeptidase 4 enzyme which inactivates native GLP-1 - given orally - Efficacy:HbA1c reduction %, up to 1% if higher baseline HbA1c (>9%) -S/E: ? Pancreatitis, hepatotoxicity, Skin reactions
 -S/E: Pancreatitis, hepatotoxicity, Skin reactions.")
37
b. GLP1 agonists: Exenetide: synthetic exendin4, from saliva of Gila monster, 53% homology with natural GLP1. - augments insulin release (glucose- dependent ). - slows gastric emptying, -suppresses inappropriately elevated glucagon levels, and leads to weight loss - HbA1c reduction 1.1% -S/E : GI (nausea), acute pancreatitis,acute renal failure.
. - slows gastric emptying, -suppresses inappropriately elevated glucagon levels, and leads to weight loss. - HbA1c reduction 1.1% -S/E : GI (nausea), acute pancreatitis,acute renal failure.")
38
Drug therapy 4 Liraglutide :GLP-1 analog, binds to serum albumin resulting in slower degradation, -Once daily injection - HbA1c reduction of 1.5% -significant weight reduction - S/E: GI, pancreatitis, ? Thyroid C-cell hyperplasia/malignancy in animal studies.

39
6. Amylin analogues:AMYLIN is a 37-amino acid peptide that is stored in pancreatic beta cells and is co-secreted with insulin . Amylin is deficient in type 1 diabetes and relatively deficient in insulin-requiring type 2 diabetes -slowed gastric emptying, -regulation of postprandial glucagon - reduction of food intake

40
Drug therapy 5 PRAMLINTIDE : amylin analog
-approved for both type 1 and insulin- treated type 2 diabetes. -effects are glucose-dependent and are overridden as serum glucose levels fall. It does not cause hypoglycemia -HbA1c reduction < 1% S/E : nausea, increase hypoglycemia risk if insulin dose not reduced.

41
Insulins 1. Ultra-short acting : Aspart-Lispro-Glulisine
2. Short acting: Regular 3. Intermediate acting : NPH 4. intermediate—long : Insulin Detimir 5. Long acting : Insulin Glargine

42
Most therapies result in weight gain over time
UKPDS: up to 8 kg in 12 years ADOPT: up to 4.8 kg in 5 years 8 Years 1 2 3 4 5 96 92 88 100 7 Insulin (n=409) 6 5 Glibenclamide (n=277) Change in weight (kg) 4 Weight (kg) 3 2 Most therapies results in weight gain over time The influence of diabetes treatment on weight was evident in the UKPDS study (UKPDS 34): regardless of treatment, patients gained weight. Patients treated with insulin showed the largest weight increase, with an average gain of 4.0 kg more than conventional therapy at 10 years (UKPDS 33). The extent of weight gain observed in UKPDS in insulin-treated patients has been confirmed in subsequent studies. For example, in a 6-month study comparing bedtime insulin glargine with NPH insulin once daily (both agents added to existing oral therapy in a treat-to-target protocol), weight gain at the end of the trial period was 3.0 and 2.8 kg, respectively (Riddle et al, 2003). In the ADOPT study, rosiglitazone, metformin, and glibenclamide were evaluated as initial treatment for recently diagnosed type 2 diabetes in a double-blind, randomized, controlled clinical trial involving 4360 patients. The patients were treated for a median of 4.0 years. Rosiglitazone was associated with more weight gain and edema than either metformin or glibenclamide. Generally, weight gain is the consequence of an increase in calorie intake or a decrease in calorie utilisation. It can result from a number of specific factors: Poor glycaemic control increases metabolic rate and consequently, improving glycaemic control decreases metabolism. If calorie intake is not modified accordingly, then weight will increase. Improving metabolic control reduces glucosuria (excretion of glucose through the urine), thus fewer calories are lost in this manner. Normally, insulin suppresses food intake through its effect on CNS appetite control pathways. It has been suggested that this effect of insulin is lost in diabetes patients. Fear of hypoglycaemia may lead to increased snacking between meals, thus increasing calorie intake. Additionally, aside from modifications to calorie intake or utilisation, use of insulin can increase lean body mass through its anabolic nature. References UKPDS 34. Lancet 1998:352:854–65. Kahn et al (ADOPT). NEJM 2006;355(23):2427–43 1 Metformin (n=342) 3 6 9 12 Years from randomisation Conventional treatment (n=411); diet initially then sulphonylureas, insulin and/or metformin if FPG >15 mmol/L Rosiglitazone Metformin Glibenclamide UKPDS 34. Lancet 1998:352:854–65. n=at baseline; Kahn et al (ADOPT). NEJM 2006;355(23):2427–43
 Glibenclamide (n=277) Change in weight (kg) 4. Weight (kg) Most therapies results in weight gain over time. The influence of diabetes treatment on weight was evident in the UKPDS study (UKPDS 34): regardless of treatment, patients gained weight. Patients treated with insulin showed the largest weight increase, with an average gain of 4.0 kg more than conventional therapy at 10 years (UKPDS 33). The extent of weight gain observed in UKPDS in insulin-treated patients has been confirmed in subsequent studies. For example, in a 6-month study comparing bedtime insulin glargine with NPH insulin once daily (both agents added to existing oral therapy in a treat-to-target protocol), weight gain at the end of the trial period was 3.0 and 2.8 kg, respectively (Riddle et al, 2003). In the ADOPT study, rosiglitazone, metformin, and glibenclamide were evaluated as initial treatment for recently diagnosed type 2 diabetes in a double-blind, randomized, controlled clinical trial involving 4360 patients. The patients were treated for a median of 4.0 years. Rosiglitazone was associated with more weight gain and edema than either metformin or glibenclamide. Generally, weight gain is the consequence of an increase in calorie intake or a decrease in calorie utilisation. It can result from a number of specific factors: Poor glycaemic control increases metabolic rate and consequently, improving glycaemic control decreases metabolism. If calorie intake is not modified accordingly, then weight will increase. Improving metabolic control reduces glucosuria (excretion of glucose through the urine), thus fewer calories are lost in this manner. Normally, insulin suppresses food intake through its effect on CNS appetite control pathways. It has been suggested that this effect of insulin is lost in diabetes patients. Fear of hypoglycaemia may lead to increased snacking between meals, thus increasing calorie intake. Additionally, aside from modifications to calorie intake or utilisation, use of insulin can increase lean body mass through its anabolic nature. References. UKPDS 34. Lancet 1998:352:854–65. Kahn et al (ADOPT). NEJM 2006;355(23):2427– Metformin (n=342) Years from randomisation. Conventional treatment (n=411); diet initially then sulphonylureas, insulin and/or metformin if FPG >15 mmol/L. Rosiglitazone. Metformin. Glibenclamide. UKPDS 34. Lancet 1998:352:854–65. n=at baseline; Kahn et al (ADOPT). NEJM 2006;355(23):2427–43.")
43
Over time, glycaemic control deteriorates
Conventional* UKPDS ADOPT Rosiglitazone Glibenclamide Metformin Metformin Glibenclamide 9 Insulin 8 6 7.5 7 6.5 8.5 8 7.5 Median HbA1c (%) 7 Recommended treatment target <7.0%† 6.5 Over time, glycaemic control deteriorates UKPDS clearly showed the need for new diabetes treatments In UKPDS, the yearly median HbA1c in patients receiving conventional treatment increased steadily throughout the trial. In contrast, median HbA1c fell during the first year in patients receiving intensive treatment (glibenclamide, metformin or insulin) but gradually increased subsequently and only remained within the recommended treatment target for the first 3–6 years of treatment (depending on assigned treatment). During the remaining years of follow-up, median HbA1c continued to rise steadily above treatment targets. This failure of existing treatments, even when used intensively in highly motivated patients highlights the need for new treatments in the management of type 2 diabetes. UKPDS recruited 5102 patients with newly diagnosed type 2 diabetes; 4209 were randomised. The patients were treated for a median of 4.0 years. Conventional therapy aimed to maintain fasting plasma glucose (FPG) at < 15 mmol/l (270 mg/dl) using diet alone initially. However, sulphonylureas, insulin or metformin could be added if target FPG was not met. References UKPDS 34. Lancet 1998;352:854–865 UKPDS 33. Lancet 1998;352:837–853 ADOPT The more recent ADOPT study supports this. In the ADOPT study, rosiglitazone, metformin, and glibenclamide were evaluated as initial treatment for recently diagnosed type 2 diabetes in a double-blind, randomized, controlled clinical trial involving 4360 patients. The study showed that HbA1c increases with time, irrespective of OAD choice. Kahn et al (ADOPT). NEJM 2006;355(23):2427–43 6 6.2% – upper limit of normal range 2 4 6 8 10 1 2 3 4 5 Years from randomisation Time (years) *Diet initially then sulphonylureas, insulin and/or metformin if FPG>15 mmol/L; †ADA clinical practice recommendations. UKPDS 34, n=1704 UKPDS 34. Lancet 1998:352:854–65; Kahn et al (ADOPT). NEJM 2006;355(23):2427–43
 7. Recommended treatment target <7.0%† 6.5. Over time, glycaemic control deteriorates. UKPDS clearly showed the need for new diabetes treatments. In UKPDS, the yearly median HbA1c in patients receiving conventional treatment increased steadily throughout the trial. In contrast, median HbA1c fell during the first year in patients receiving intensive treatment (glibenclamide, metformin or insulin) but gradually increased subsequently and only remained within the recommended treatment target for the first 3–6 years of treatment (depending on assigned treatment). During the remaining years of follow-up, median HbA1c continued to rise steadily above treatment targets. This failure of existing treatments, even when used intensively in highly motivated patients highlights the need for new treatments in the management of type 2 diabetes. UKPDS recruited 5102 patients with newly diagnosed type 2 diabetes; 4209 were randomised. The patients were treated for a median of 4.0 years. Conventional therapy aimed to maintain fasting plasma glucose (FPG) at < 15 mmol/l (270 mg/dl) using diet alone initially. However, sulphonylureas, insulin or metformin could be added if target FPG was not met. References. UKPDS 34. Lancet 1998;352:854–865. UKPDS 33. Lancet 1998;352:837–853. ADOPT. The more recent ADOPT study supports this. In the ADOPT study, rosiglitazone, metformin, and glibenclamide were evaluated as initial treatment for recently diagnosed type 2 diabetes in a double-blind, randomized, controlled clinical trial involving 4360 patients. The study showed that HbA1c increases with time, irrespective of OAD choice. Kahn et al (ADOPT). NEJM 2006;355(23):2427– % – upper limit of normal range Years from randomisation. Time (years) *Diet initially then sulphonylureas, insulin and/or metformin if FPG>15 mmol/L; †ADA clinical practice recommendations. UKPDS 34, n=1704. UKPDS 34. Lancet 1998:352:854–65; Kahn et al (ADOPT). NEJM 2006;355(23):2427–43.")
44
THANK YOU

46
Thank You

Similar presentations