Download presentation
Presentation is loading. Please wait.

1
Option C: Cells & Energy

2
C.1 Proteins C.1.1: Explain the 4 levels of protein structure, indicating each level’s significance C.1.2: Outline the differences between fibrous & globular proteins, with reference to two examples of each type C.1.3: Explain the significance of polar and non-polar amino acids C.1.4: State six functions of proteins, giving a named example of each

3
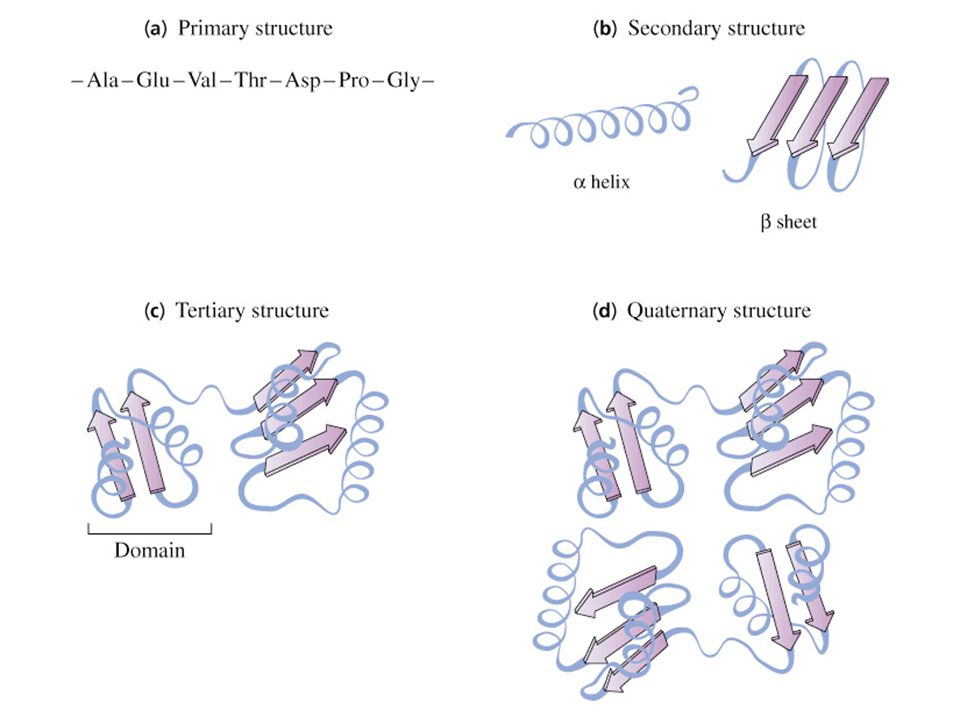
4 levels of Protein Structure
Primary The unique amino acid sequence Like the order of letters in a very long word Slight changes in primary structure greatly affect overall conformation and function

4
4 levels of Protein Structure
Secondary Coils and folds of the primary structure as a result of hydrogen bonding Electronegative O & N attract H E.g. – alpha helix, pleated sheet

5
4 levels of Protein Structure
Tertiary Contortions of molecule by bonding between R groups of amino acids Hydrophobic interactions important Core versus outer parts May be further reinforced by disulfide bonds

6
4 levels of Protein Structure
Quartnerary 2 or more polypeptide chains aggregated into functional unit Collagen – 3 proteins together, Hemoglobin 4 proteins together Shape of subunits together specifies function

8
Fibrous vs. Globular Proteins
Functional Quaternary proteins are either … Fibrous – long ropelike structures Collagen – 40% of protein in human body, from skin, bone, tendons & ligaments Keratin – hair, horns, skin Globular –spherical Hemoglobin – oxygen binding protein in blood Lysozyme – immune enzyme in saliva, tears, sweat that targets bacterial surface proteins

9
Polar vs Nonpolar Polarity of amino acids influences protein behavior
Membrane position (polar portions in or out of cells, nonpolar portions in membrane) Hydrophobic channel creation Specificity of enzyme active site – complements properties of the substrate
 Hydrophobic channel creation. Specificity of enzyme active site – complements properties of the substrate.")
10
Important Proteins Protein Function Keratin Casein Hemoglobin Actin
Insulin Lysozyme

11
Important Proteins Protein Function Keratin
Support in hair, horns and feathers Casein Storage of AA for babies in milk Hemoglobin Transport of O2 by blood Actin Movement of muscle fibers Insulin Hormone regulates sugar in blood Lysozyme Defense against foreign substances

12
C.2 Enzymes C.2.1: State that metabolic pathways consist of chains and cycles of enzyme catalyzed reactions C.2.2: Describe the induced fit model C.2.3: Explain that enzymes lower the activation energy of the chemical reactions which they catalyze. C.2.4: Explain the difference between competitive and non-competitive inhibition with reference to one example of each. C.2.5: Explain the role of allostery in the control of metabolic pathways by end-product inhibition

13
Chemical Reaction Types
Exergonic reaction ENERGY OUTWARD: proceeds with the net release of free energy Endergonic reaction ENERGY INWARD: proceeds with the net absorbtion of energy from the surroundings

14
Metabolism Metabolism = The totality of an organisms chemical processes. Managing the material and energy resources of the cell. Metabolic Pathways consist of chains and cycles of enzyme catalyzed reactions Catabolic pathways: break down molecules and release energy Anabolic pathways: build complex molecules and absorb energy

15
Reaction types: Exergonic & Endergonic

18
Models of enzyme function
LOCK & KEY MODEL Each enzyme fits exactly one substrate Complementary shapes like a lock and a key INDUCED FIT MODEL Extension of Lock and key model Some enzymes can bond multiple substrates Interaction between enzyme and substrate induces change to fit

20
The induced fit model accounts for the broad specificity of some enzymes

21
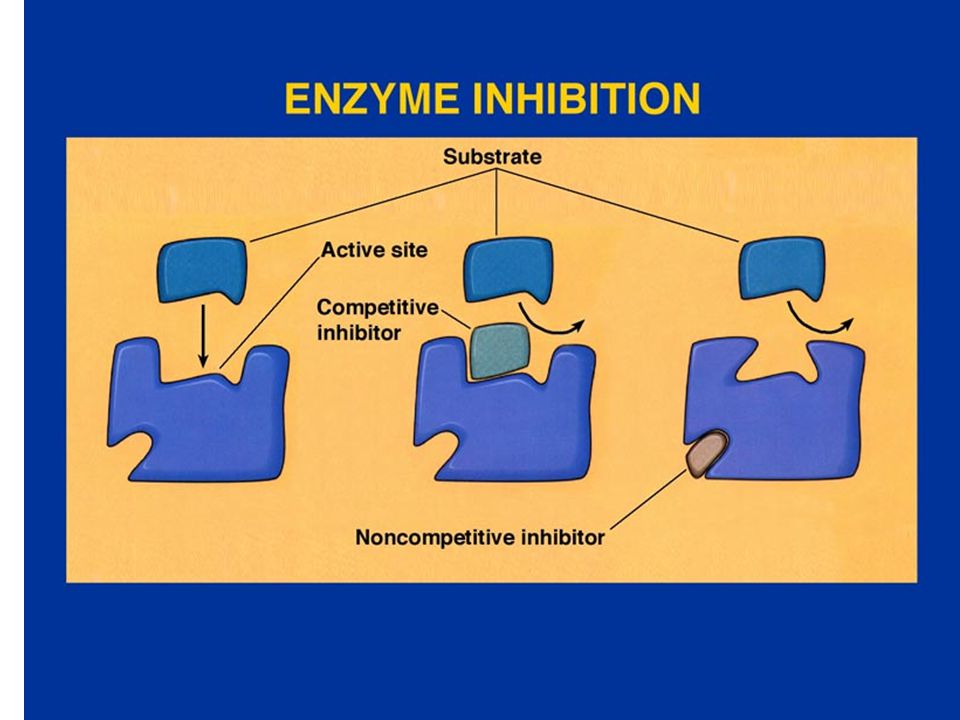
Competitive vs. non-competitve
Competitive – inhibiting molecule is structurally similar to substrate, binds to active site, prevents substrate bonding Inhibition of butanedioic acid dehydrogenase by propanedoic acid in the Krebs cycle Inhibition of folic acid synthesis in bacteria by sulfonamide protosil (an antibiotic) Non-competitive – inhibiting molecule binds to enzyme (not at A.S.) causing conformational change to active site Hg+2, Ag+, Cu+, inhibition of cytochrome oxidase by binding to –SH groups and breaking -S-S- linkages
 Non-competitive – inhibiting molecule binds to enzyme (not at A.S.) causing conformational change to active site. Hg+2, Ag+, Cu+, inhibition of cytochrome oxidase by binding to –SH groups and breaking -S-S- linkages.")
23
Allosteric Regulation
Form of non-competitive inhibition Inhibition is a natural mechanism of cell metabolic control Shape of allosteric enzymes can be altered by binding of end products at the allosteric site Metabolites or end products can serve in negative feedback by binding to allosteric site and decreasing enzyme function ATP inhibition of phosphofructokinase in glycolysis

25
Allosteric Reactions are and example of feedback inhibition

26
C.3 Respiration C.3.1: State that oxidation involves the loss of electrons from an element whereas reduction involves the gain of electrons, and that oxidation frequently involves gaining oxygen or losing hydrogen, while reduction involves losing oxygen or gaining hydrogen C.3.2: Outline the process of glycolysis including phosphorylation, lysis, oxidation, and ATP formation C.3.3: Draw the structure of a mitochondrion as seen in electron micrographs. C.3.4: Explain aerobic respiration including oxidative decarboxylation of pyruvate, the krebs cycle, NADH+ + H+, the electron transport chain, and the role of oxygen

27
C.3 Respiration C.3.5: Explain oxidative phosphorylation in terms of chemiosmosis C.3.6: Explain the relationship between the structure of the mitochondrion and its function. C.3.7: Describe the central role of acetyl CoA in carbohydrate and fat metabolism C.3.8: Analyze data relating to respiration

28
Overall Process Organic compounds + Oxygen
Carbon dioxide + Water + Energy For convenience we usually start with glucose, but can use lipids, proteins and other carbohydrates. C6H12O6 + 6 O CO2 + H2O + Energy Glucose is oxidized and oxygen is reduced

29
Oxidation-Reduction Always coupled
Chemical reactions which involve a partial or complete transfer of electrons from one reactant to another. Oxidation: partial or complete loss of e- from a substance; e- donor is the reducing agent. Reduction: partial or complete addition of e- to another substance; e- acceptor is an oxidizing agent.

30
Comparison of Oxidation and Reduction
Addition of oxygen atoms Removal of H atoms Loss of e- from a substance Reduction Removal of oxygen atoms Addition of H atoms Addition of e- to a substance

31
Overview of Cell Respiration

32
3. Cell Respiration: a)Glycolysis
Catalyzed by enzymes in the cytoplasm Glucose is partially oxidized and a small amount of ATP is produced Accomplished without the use of oxygen Is part of both aerobic and anaerobic respiration

33
Glycolysis overview

34
Energy investment phase: 2 phosphate groups from ATP are added to a molecule of glucose (hexose sugar) to form a hexose biphosphate. Lysis: The hexose biphosphate is split to form two molecules of triose phosphate. Oxidation: 2 molecules of NAD+ are reduced to 2NADH + 2H+; so the triose phosphate is oxidized. The energy is used to add another phosphate group to each triose. NADH can enter the electron transport chain in the mitochondria and be used to produce more ATP in the process called oxidative phosphorylation 4. ATP Formation: Two phosphate groups are removed from the two trioses and passed to ADP to form ATP. So 4 ATPs are generated for a net gain of 2 ATPs. ATP is produced by a process called substrate-level phosphorylation because an enzyme transfers a phosphate group from a substrate (organic molecule generated by the sequential breakdown of glucose) to ADP
 to ADP.")
35
The End of Glycolysis A 6 Carbon compound has been turned into 2 3 Carbon compounds called pyruvate (A.K.A. oxopropanoate). Glucose has been oxidized Net gain 2 ATP, 2NADH + 2H+ ATP made through substrate level phosphorlyation Glycolysis also yields 2 water molecules for each glucose.

36
Aerobic respiration Each pyruvate must be decarboxylated (CO2 removed)
Remaining 2 carbon molecule (acetyl group) reacts with reduced coenzyme A During in the process NADH + H+ are formed
 reacts with reduced coenzyme A. During in the process NADH + H+ are formed.")
37
The Link Reaction: oxidative decarboxylation

38
Summary of One Turn of the Krebs Cycle
1. Acetyl CoA (2C) enters the cycle & joins a 4C molecule. 2. In a series of steps, the remaining H and high energy electrons are removed from the Acetyl CoA. 3. Three NAD+ are converted into 3 NADH & 3H+. 4. One FAD is converted into 1 FADH2. 5. One ATP is made (by substrate phosphorylation). 6. Two CO2 are released. 7. At the end of the cycle, nothing remains of the original glucose molecule
 enters the cycle & joins a 4C molecule. 2. In a series of steps, the remaining H and high energy electrons are removed from the Acetyl CoA. 3. Three NAD+ are converted into 3 NADH & 3H+. 4. One FAD is converted into 1 FADH2. 5. One ATP is made (by substrate phosphorylation). 6. Two CO2 are released. 7. At the end of the cycle, nothing remains of the original glucose molecule.")
41
Krebs cycle results per glucose
2 molecules of pyruvate are oxidized 2 ATPs by substrate level phosphorylation 6 NADH and 2 FADH2 Starting material is regenerated Electron transport chain couples electron flow down the chain to ATP synthesis.

42
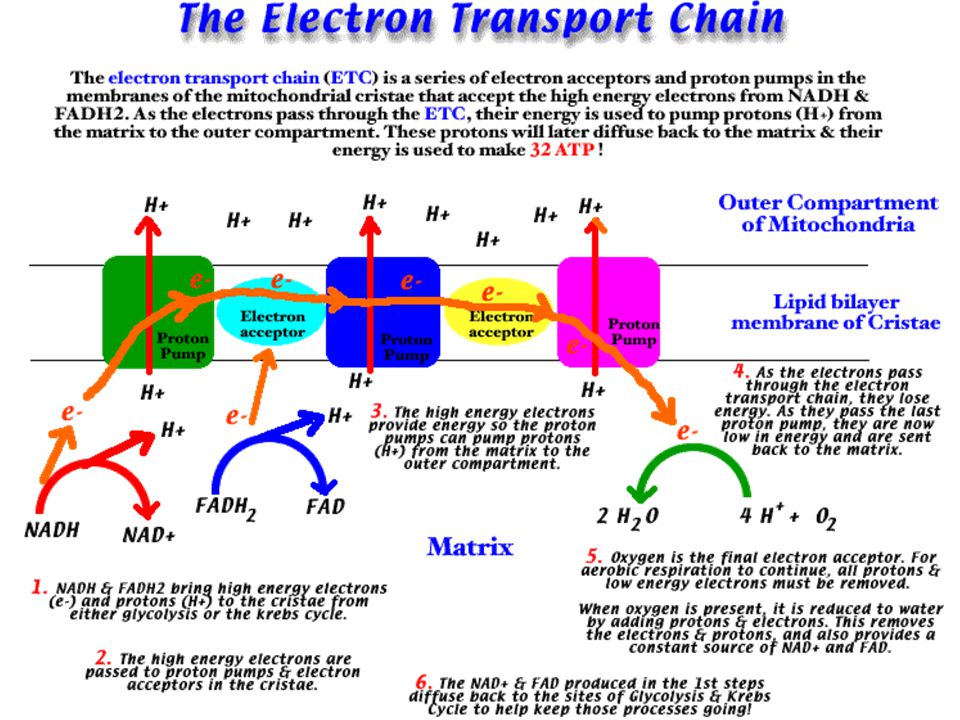
ETC / Oxidative Phosphorlyation
The purpose of the Electron Transport Chain is to receive the high energy electrons carried by the coenzymes NADH &FADH2 and use the energy from these electrons to pump protons out of the matrix. A high concentration of protons results. As the protons diffuse back to the matrix, their energy is used by the ATP synthase to create 32 ATP. Oxidative phosphorylation (electron transport) - The creation of ATP via chemiosmosis as a result of electron transport.
 - The creation of ATP via chemiosmosis as a result of electron transport.")
43
Electron transport a) Occurs at cristae (Inner membranes)
b) NADH & FADH2 deliver H+ and e- to cristae. c) Electrons "transport" along cristae through electron acceptors, provide energy to pump H+ from matrix to outer compartment. d) Concentration of H+ is now higher in outer compartment. H+ pass through ATP synthetases in cristae back to matrix. 32 ATP are made. This is known as chemiosmosis. e) Last step involves H+ & e- added to oxygen. This frees NAD+ to return to glycolysis & Krebs Cycle to pick up more H+ & e-.
 NADH & FADH2 deliver H+ and e- to cristae. c) Electrons transport along cristae through electron acceptors, provide energy to pump H+ from matrix to outer compartment. d) Concentration of H+ is now higher in outer compartment. H+ pass through ATP synthetases in cristae back to matrix. 32 ATP are made. This is known as chemiosmosis. e) Last step involves H+ & e- added to oxygen. This frees NAD+ to return to glycolysis & Krebs Cycle to pick up more H+ & e-.")
47
Chemiosmosis is the process where protons diffuse from the outer compartment (high concentration) through ATP Synthase in the Cristae to the Matrix (low H+ Concentration). The energy in the protons as they pass is used by ATP synthase to create 32 ATP.

48
XIV: Mitochondria and Chloroplasts
Main energy transformers of cells; transduce energy acquired from the surroundings into forms usable for cellular work. BOTH: a) enclosed by double membranes which are NOT part of endomembrane system b) contain ribosomes and some DNA that programs a small portion of their own protein synthesis c) are semiautonomous organelles that grow and reproduce within the cell (see Ch. 26 for a discussion of the origins of eukaryotic cells from symbiotic consortiums of prokaryotic cells; Dr. Lynn Margulis’ endosymbiotic theory.
 enclosed by double membranes which are NOT part of endomembrane system. b) contain ribosomes and some DNA that programs a small portion of their own protein synthesis. c) are semiautonomous organelles that grow and reproduce within the cell (see Ch. 26 for a discussion of the origins of eukaryotic cells from symbiotic consortiums of prokaryotic cells; Dr. Lynn Margulis’ endosymbiotic theory.")
49
Mitochondria Sites of cellular respiration (catabolic oxygen-requiring process that uses energy extracted from organic macromolecules to produce ATP). Found in nearly all eukaryotic cells; number directly correlates with cell’s metabolic activity.] 1 um in diameter; 1-10 um in length Can move, change shape and divide
. Found in nearly all eukaryotic cells; number directly correlates with cell’s metabolic activity.] 1 um in diameter; 1-10 um in length. Can move, change shape and divide.")
50
Mitochondrion

51
Mitochondria Structure
BE ABLE TO DRAW AND LABEL Enclosed by two membranes: smooth outer membrane and convoluted inner membrane which contains embedded enzymes involved in cellular respiration. Infoldings or cristae increase surface area Membranes divide mitochondrion into 2 internal compartments: a) intermembrane space: same solute composition of cytosol. b) mitochondrial matrix: contains enzymes that catalyze many steps of cell respiration (Krebs cycle)
 intermembrane space: same solute composition of cytosol. b) mitochondrial matrix: contains enzymes that catalyze many steps of cell respiration (Krebs cycle)")
52
The Role of acetyl CoA Acetyl CoA is an intermediate in carbohydrate metabolism In lipid metabolism, the oxidation of fatty acid chains results in the formation of carbon fragments with 2C each 2 carbon fragments are acetyl fragments They pass into Krebs cycle

53
Proteins and fats in cell respiration: Central role of Acetyl CoA

54
C.4 Photosynthesis C.4.1: Draw the structure of a chloroplast as seen in electron micrographs C.4.2: State that photosynthesis consists of light-dependent and light-independent reactions. C.4.3: Explain the light dependent reactions C.4.4: Explain phosphorylation in terms of chemiosmosis C.4.5: Explain the light independent reactions

55
C.4 Photosynthesis C.4.6: Explain the relationship between the structure of the chloroplast and its function C.4.7: Draw the action spectrum for photosynthesis C.4.8: Explain the relationship between the action spectrum and the absorption spectrum of photosynthetic pigments in green plants C.4.9: Explain the concept of limiting factors with reference to light intensity, temperature and concentration of carbondioxide. C.4.10: Analyze data relating to photosynthesis

56
Chloroplast

57
B. Chloroplasts BE ABLE TO DRAW AND LABEL
One of a group of plant and algal membrane-bound organelles Chloroplasts divided into 3 functional compartments by a system of membranes. 1. Intermembrane space: space between the double chloroplast membrane. 2. Stroma: viscous fluid outside the grana (stacks of thylakoids); light-independent chemical reactions take place here. Carbon dioxide converted to sugar. 3. Thylakoids: flattened membranous sacs inside chloroplast; chlorophyll is found in membranes; function in the light-dependent chemical reactions. 4. Thylakoid space: space inside the thylakoids.
; light-independent chemical reactions take place here. Carbon dioxide converted to sugar. 3. Thylakoids: flattened membranous sacs inside chloroplast; chlorophyll is found in membranes; function in the light-dependent chemical reactions. 4. Thylakoid space: space inside the thylakoids.")
58
Absorbance Peaks in: Red & Blue Minimum in Green
Figure Evidence that chloroplast pigments participate in photosynthesis: absorption and action spectra for photosynthesis in an alga Absorbance Peaks in: Red & Blue Minimum in Green

59
Photosynthesis consists of the light dependent and light independent reactions

60
2 step process Light Dependent Reactions = photo
Light Independent Reactions (Calvin cycle) = synthesis Light dependent reactions are in the thylakoid, light independent reactions in the stroma Transforming light energy into chemical energy of ATP and NADPH Creation of Sugars from inorganic compounds
 = synthesis. Light dependent reactions are in the thylakoid, light independent reactions in the stroma. Transforming light energy into chemical energy of ATP and NADPH. Creation of Sugars from inorganic compounds.")
61
Photosystems In thylakoid membrane chlorophyll organized with other molecules in photosystems “Antenna array” of Chlor. A, B, & carotenoid pigments, clustered around a reaction center Reaction center is a single Chlorophyl A associated with the “primary electron acceptor” (PEA) Chlorophyl A passes electrons to the PEA PEA traps excited electrons before they fall back to ground state
 Chlorophyl A passes electrons to the PEA. PEA traps excited electrons before they fall back to ground state.")
62
Figure 10.11 How a photosystem harvests light

63
Photosystems 2 types of photosystems in thylakoid membrane cooperate in light reactions Called Photosystem I & II – different PEA Photosystem I – P700 best absorbance at 700 nm wavelength (red) Photosystem II – P680 also in red Identical chlorophyll but different protein association
 Photosystem II – P680 also in red. Identical chlorophyll but different protein association.")
64
Electron flow Light drives synthesis of ATP and NADPH
Energy transformation based on flow of electrons Two routes of electron flow Noncyclic electron Flow = predominates during light reactions – ejected electrons don’t cycle back to ground state Cyclic electron Flow = uses Photosystem I not PS II – no production of NADPH or O2

65
Figure How noncyclic electron flow during the light reactions generates ATP and NADPH (Layer 5)
")
66
Light dependent reactions use solar power to produce ATP and NADPH to fuel sugar production in the Calvin cycle

67
Cyclic electron Flow Cyclic electron Flow = uses Photosystem I not PS II – no production of NADPH or O2 Short circuit back into electron transport chain Does produce ATP cyclic phosphorylation Light independent reaction consumes more ATP than NADPH, Cyclic electron flow makes up the difference in ATP required

69
Review of chemiosmosis
Mechanism of generating ATP Electron transport chain pumps protons across the membrane while electrons are shuttled through different carriers Protons pumped to the inside of thylakoids Protons accumulate, pH and charge increase move out to stroma through channels Movement through channels in ATP synthase drives production of ATP

70
Figure 10.15 Comparison of chemiosmosis in mitochondria and chloroplasts

71
Figure 10.16 The light reactions and chemiosmosis: the organization of the thylakoid membrane

72
The Light Independent Reactions: Synthesis of sugars
Takes place in the Stroma Carbon enters as CO2 and leaves as sugar ATP is the energy source NADPH provides reducing power for adding high energy electrons Direct product of Calvin cycle is glyceraldehyde-3-phosphate (G3P) 3 cycles to make this product Actually fixing three molecules of CO2
 3 cycles to make this product. Actually fixing three molecules of CO2.")
73
Figure 10.17 The Calvin cycle (Layer 3)
")
74
Calvin cycle summary For the synthesis of 1 molecule of sugar
Require the input of 9 ATP and 6 NADPH Light reactions regenerate ATP, NADPH G3P can be used to produce other sugars

75
Figure 10.20 A review of photosynthesis

76
Limiting Factors Certain factors in the environment can effect how photosynthesis occurs Main limiting factors are Temperature, Light intensity, and CO2 concentration Other factors include nutrient availability, such as nitrogen, phosphorous and iron Different factors limit plant growth in different areas

77
Effects of Light Intensity & Temperature on Photosynthesis

78
As light intensity increases the rate of photosynthesis increases and
Plateau once photosynthetic machinery is operating at peak capacity Photoinhibition: sunburn for plants, occurs when too much light overloads photosynthetic machinery For a given light intensity, Higher temperature Increased rate of photosynthesis

79
A = at low light intensities light is a limiting factor and temperature has no effect
B = at higher light intensities, temperature is a limiting factor, warmer higher rate of photosynthesis

80
Effects of Carbon Dioxide on Photosynthetic Rate

Similar presentations