Download presentation
Presentation is loading. Please wait.

1
Helping the Worlds Farmers Adapt to Climate Change Strata Conference Oct 2012 Siraj Khaliq, CTO, The Climate Corporation

2
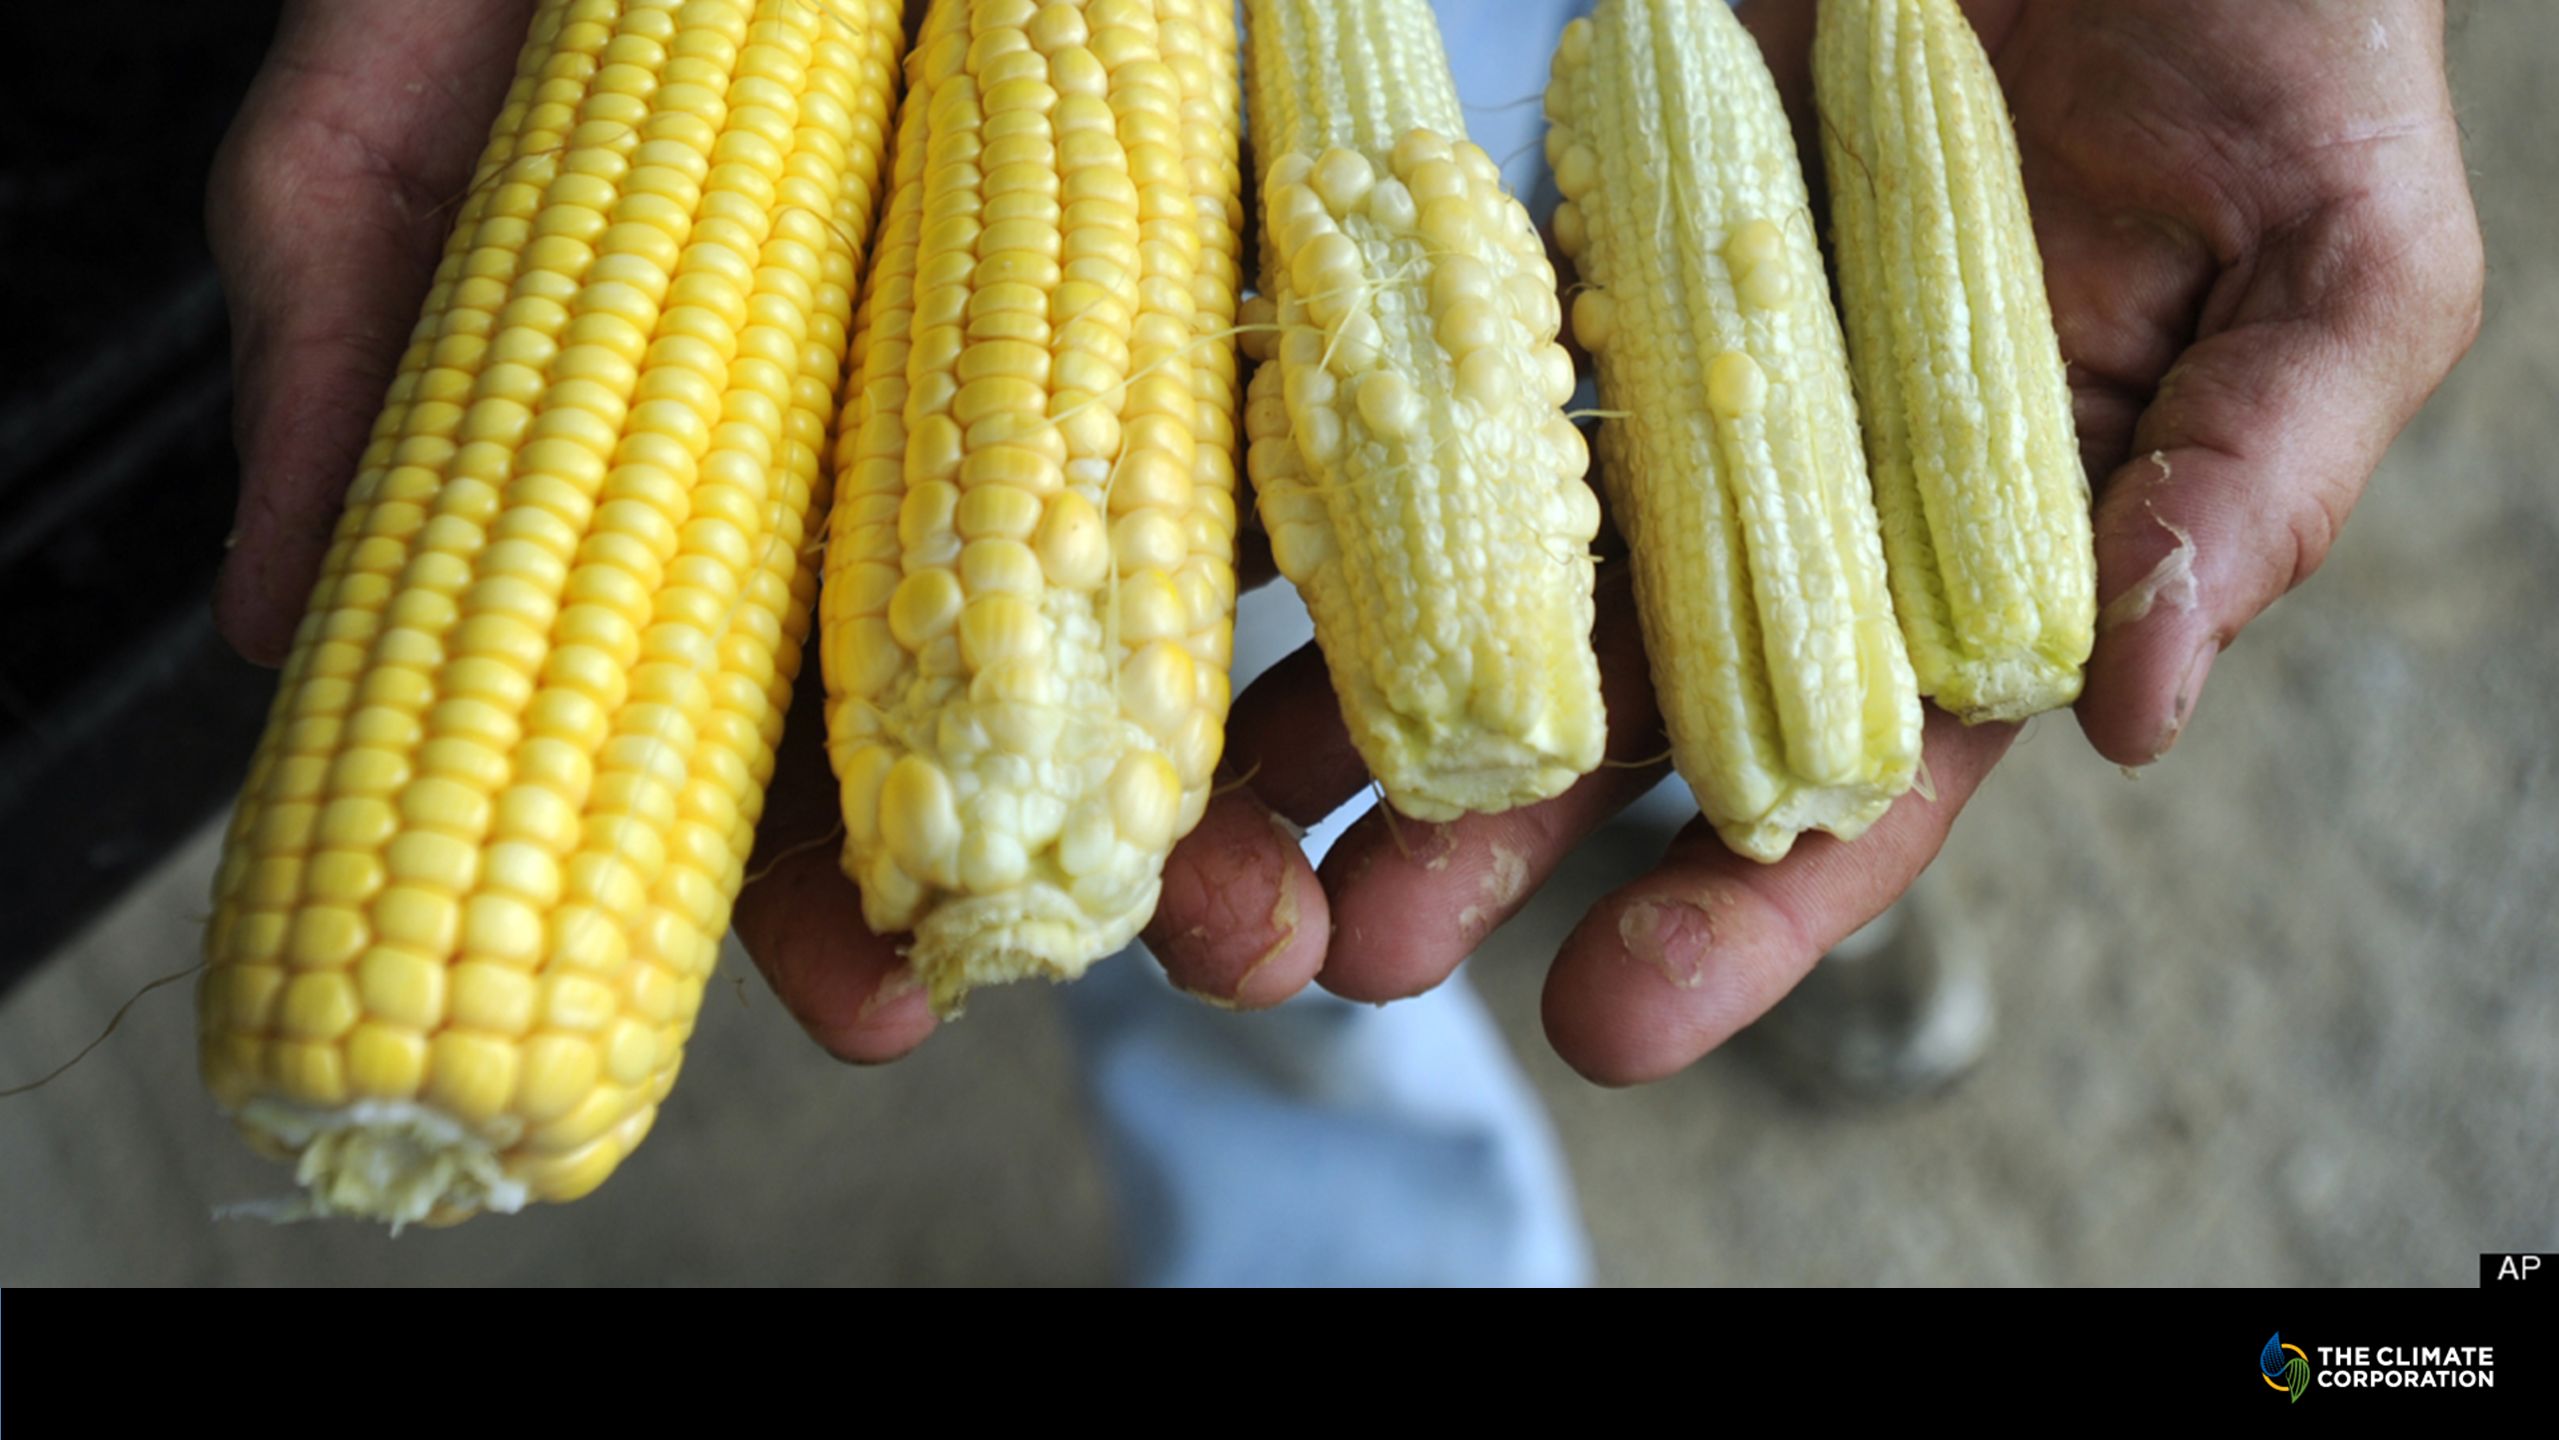
Fritchton, IN – late summer, 2012

3
Louisville, IL

4
Wichita, KA

10
Click to edit Master title style Click to edit Master text styles –Second level Third level –Fourth level »Fifth level 1956 2012 1988 Worst US Droughts in the Last Fifty Years

11
Click to edit Master title style -16% 2012 Estimated Corn Yield (USDA)
")
12
Click to edit Master title style +6% World food prices month-on-month change in July 2012 (UNFAO)
")
13
Large capital outlays at start of season (April) Seed, equipment, pesticide, and land Revenue comes in at harvest 1-2 years of revenue shortfall could be catastrophic Futures help with price volatility, not weather Farm Economics
 Seed, equipment, pesticide, and land Revenue comes in at harvest 1-2 years of revenue shortfall could be catastrophic Futures help with price volatility, not weather Farm Economics")
14
Farmer Rich Vernon talks to NPR's David Schaper (audio) A real-life example
 A real-life example")
17
This is set to continue

18
Click to edit Master title style

20
To help all the world's people & businesses manage and adapt to climate change Our Mission

21
Evaluating Markets

22
Click to edit Master title style $4.2 Trillion 2012 Estimated Corn Yield (USDA)
")
23
Total Weather Insurance (TWI)
")
24
TWI Demo

25
HOW?

26
OutcomeWeather DataPolicy

27
Modeled Outcomes Weather Simulations Structure

28
How does weather impact crop yield?

29
Structure Varies based on many inputs: Temperature Precipitation Soil type Topography Farming practices Crop varietal

30
Structure Agronomically deduced candidates Model at large scale Every farm in the US (20M)
")
31
Structure

32
Modeled Outcomes Weather Simulations Structure

33
What weather do we expect? Weather Simulations

34
1M locations (2.5mi x 2.5mi grid) 10k scenarios/location going 2 years out 2 measurements 60Tb of data per simulation set every couple of weeks
 10k scenarios/location going 2 years out 2 measurements 60Tb of data per simulation set every couple of weeks")
35
Weather Simulations

36
2.5 x 2.5 Square Miles

37
Weather Simulations Expensive computation Parallelizing hard due to correlations Would take 80+ years on one fast modern server-class machine We need to generate these within days

38
Soil Moisture Modeling What's the soil moisture at farm X?

39
Soil Moisture Modeling soil type, weather, topography, crop

40
Evolution of Our Technology

41
Java frontend Pricing Server (Rserve) MySQL 2007 400 stations All data in MySQL Pricing servers (Rserve) Java-based webapp
 MySQL stations All data in MySQL Pricing servers (Rserve) Java-based webapp")
42
Java frontend Pricing Server (Rserve) MySQL 2008 2000 stations Weather data now on disk Versioning hard Java-R bridge messy Disk
 MySQL stations Weather data now on disk Versioning hard Java-R bridge messy Disk")
43
Java frontend Pricing Server (java) Simulation Service Weather data Service Sim gen (hadoop) SimpleDB / S3 MySQL 2009-2010 22,000 locations Rserve replaced by java Simulations & S3/SimpleDB Model gen in Hadoop Moved fully to EC2
 Simulation Service Weather data Service Sim gen (hadoop) SimpleDB / S3 MySQL ,000 locations Rserve replaced by java Simulations & S3/SimpleDB Model gen in Hadoop Moved fully to EC2")
44
Rails frontend Pricing Server (java) Marty (HBase) Geo data store Sim gen (cascalog) S3 MySQL 2011 – today 1,000,000 locations Own big geo-data store Many more hadoop jobs Eliminated SimpleDB Soil moisture dataset gen (cascalog) Structures gen (cascalog) Other hadoop jobs
 Marty (HBase) Geo data store Sim gen (cascalog) S3 MySQL 2011 – today 1,000,000 locations Own big geo-data store Many more hadoop jobs Eliminated SimpleDB Soil moisture dataset gen (cascalog) Structures gen (cascalog) Other hadoop jobs")
45
MapReduce at TCC Python (Hadoop streaming) Some native java Most are higher-level frameworks
 Some native java Most are higher-level frameworks")
46
Big Wins Cascalog/Clojure EC2 Spot Instances NoSQL

47
Big Win #1 - Cascalog (defn weather-map-q "Creates a Cascalog query to extract individual measurement values of ObservationSet data and produces tuples of [date JSON-encoded map], in which each JSON-encoded map is keyed by station-id" [stations interval measurement sources start end nostra] (<- [?date ?json-aggregated-values] ; from hfs-textline (stations ?station-id) (fetch-obs-for-station [interval measurement sources start end nostra] ?station-id :> ?obs) (extract-values-by-date ?obs :> ?date ?value) (aggregate-values ?value :> ?aggregated-values) (json/generate-string ?aggregated-values :> ?json-aggregated-values)))
![Big Win #1 - Cascalog (defn weather-map-q Creates a Cascalog query to extract individual measurement values of ObservationSet data and produces tuples of [date JSON-encoded map], in which each JSON-encoded map is keyed by station-id [stations interval measurement sources start end nostra] (<- [ date json-aggregated-values] ; from hfs-textline (stations station-id) (fetch-obs-for-station [interval measurement sources start end nostra] station-id :> obs) (extract-values-by-date obs :> date value) (aggregate-values value :> aggregated-values) (json/generate-string aggregated-values :> json-aggregated-values)))](http://images.slideplayer.com/1/242328/slides/slide_47.jpg "Big Win #1 - Cascalog (defn weather-map-q Creates a Cascalog query to extract individual measurement values of ObservationSet data and produces tuples of [date JSON-encoded map], in which each JSON-encoded map is keyed by station-id [stations interval measurement sources start end nostra] (<- [ date json-aggregated-values] ; from hfs-textline (stations station-id) (fetch-obs-for-station [interval measurement sources start end nostra] station-id :> obs) (extract-values-by-date obs :> date value) (aggregate-values value :> aggregated-values) (json/generate-string aggregated-values :> json-aggregated-values)))")
48
Big Win #1 - Cascalog Easily composable workflows Can unit test Hadoop flows Quick iteration

49
Big Win #2 – EC2 Spot Instances Good fit to our compute approach Can be very cheap Good availability

50
MapReduce at TCC

51
Big Win #3: NoSQL Datasets must be: Repeatably Generated Versioned Indexed

52
Big Win #3 – NoSQL Why not SQL? Time-series data, not relational Large size and ad hoc structure Specific query patterns 10s of Terabytes in size

53
NoSQL at TCC - Marty Own big geo-data store Built on HBase Billions of records

54
Learning #1 – Embrace Hadoop Defines problem clearly Focus on problem more than architecture Great tools and community support

55
Learning #2 – Be Careful Fail-fast code Test, test, test Run at small scale first

56
Learning #3 – Architecture Matters Eliminate single points of failure Consider memory usage and I/O Write simple flows with checkpointing Monitoring is invaluable

57
TCC Today 150 employees Half engineering 20 PhDs Reputation for hard science problems … by standing on the shoulders of giants

58
Open Source at TCC github.com/TheClimateCorporation Lemur (EMR / Clojure) Repoman (coming soon) Marty (coming)
 Repoman (coming soon) Marty (coming)")
59
??

60
Click to edit Master title style

Similar presentations