Download presentation
Presentation is loading. Please wait.

1
Section 8.6

2
You probably know that a lighter tree climber can crawl farther out on a branch than a heavier climber can, before the branch is in danger of breaking. What do you think the graph of (length, mass) data will look like when mass is added to a length of pole until it breaks? Is the relationship linear, like line A, or does it resemble one of the curves, B or C?
 data will look like when mass is added to a length of pole until it breaks. Is the relationship linear, like line A, or does it resemble one of the curves, B or C .")
3
Procedural Note 1. Lay a piece of linguine on a table so that its length is perpendicular to one side of the table and the end extends over the edge of the table. 2. Tie the string to the film canister so that you can hang it from the end of the linguine. (You may need to use tape to hold the string in place.) 3. Measure the length of the linguine between the edge of the table and the string. Record this information in a table of (length, mass) data. 4. Place mass units into the container one at a time until the linguine breaks. Record the maximum number of weights that the length of linguine was able to support.
 3. Measure the length of the linguine between the edge of the table and the string. Record this information in a table of (length, mass) data. 4. Place mass units into the container one at a time until the linguine breaks. Record the maximum number of weights that the length of linguine was able to support..")
4
Step 1:Work with a partner. Follow the Procedure Note to record at least five data points, and then compile your results with those of other group members. Step 2: Make a graph of your data with length as the independent variable, x, and mass as the dependent variable, y. Does the relationship appear to be linear? If not, describe the appearance of the graph. The relationship between length and mass is an inverse variation. The parent function for an inverse variation curve, f(x)=1/x, is the simplest rational function. Step 3: Your data should fit a dilated version of the parent function f (x) = 1/x. Write an equation that is a good fit for the plotted data.
=1/x, is the simplest rational function. Step 3: Your data should fit a dilated version of the parent function f (x) = 1/x. Write an equation that is a good fit for the plotted data..")
5
Graph the function f(x) =1/x on your calculator and observe some of its special characteristics. The graph is made up of two branches. One part occurs where x is negative and the other where x is positive. There is no value for this function when x =0. What happens when you try to evaluate f(0)?
 .")
6
This graph is a hyperbola. Its like the hyperbolas you studied in Lesson 8.4, but it has been rotated 45°. It has vertices (1, 1) and (-1, 1), and its asymptotes are the x- and y-axes.
 and (-1, 1), and its asymptotes are the x- and y-axes..")
7
To understand the behavior of the graph close to the axes, make a table with values of x very close to zero and very far from zero and examine the corresponding y-values. Consider these values of the function f (x) =1/x.
 =1/x..")
8
The behavior of the y-values as x gets closer to zero shows that the y-axis is a vertical asymptote for this function.

9
As x approaches the extreme values at the left and right ends of the x-axis, the curve approaches the x-axis. The horizontal line y = 0, then, is a horizontal asymptote. This asymptote is called an end behavior model of the function. In general, the end behavior of a function is its behavior for x-values that are large in absolute value.

11
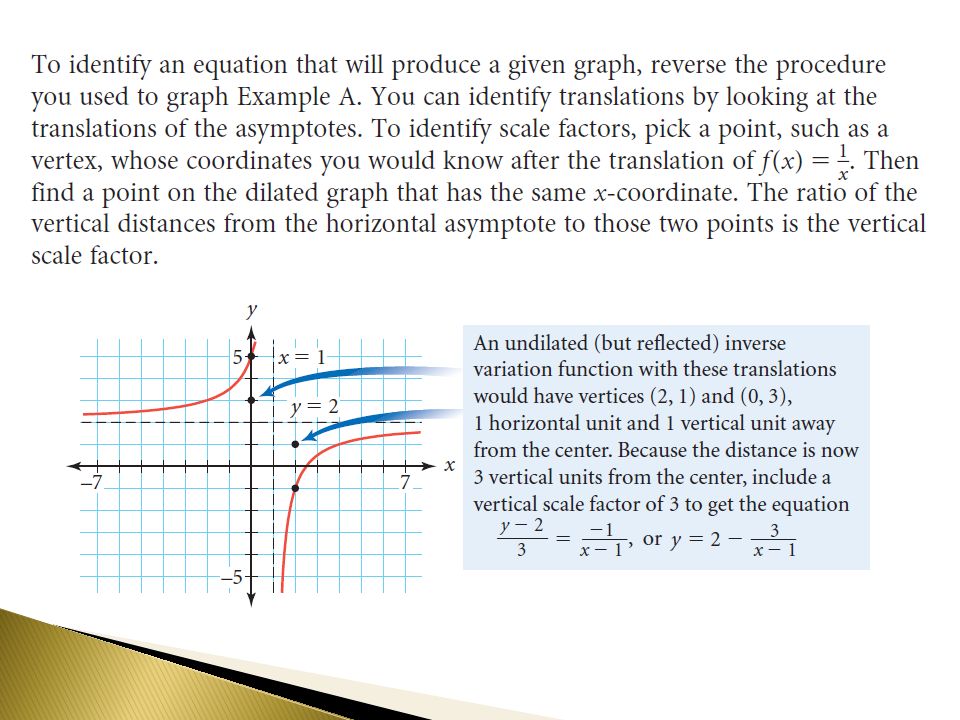
Example A You can change the form of the equation so that the transformations are more obvious. Because the numerator and denominator both have degree 1, you can use division to rewrite the expression.

16
Example B

17
To find when the solution is 60% acid, substitute 0.6 for P and solve the equation.

Similar presentations


 = x2 -1>")


 Graph y =. State the domain and range. 6 x 2 + 1 SOLUTION The degree of the numerator, 0, is less than the.>")


