Download presentation
Presentation is loading. Please wait.

1
Experimental methods in genome analysis

2
Genomic sequences are boring GATCAATGATGATAGGAATTGAAAGTGTCTTAATTACAATCCCTGTGCAATTATTAATAACTTTTTTGTT CACCTGTTCCCAGAGGAAACCTCAAGCGGATCTAAAGGAGGTATCTCCTCAAAAGCATCCTCTAATGTCA GAAGCAAGTGAGCACTGGGAAGAATACTTGAGAAAGTGGCATGCTTACGAAACTGCTAAGGTGCACCCCA GGGAGGTTGCAAAACCTGCATCTAAAGGAAAGCCCAGGCTTCCAAAGGCTTCTCCTAAGGCAACCTCCAA ACCCAAGCACAGGCATAGGAAAGCACAAATCAAGACCCCGGAGACCCTCGGGCCAAATACAAATTCCAAT AACAACATAGAAGATGATCAGGATGTCCATTCCGAACAGCACCCTTCCCAAAAGGATCTCCAGCAGCTTA AGAAAAAGCCCCGGATCGTCCTACCTTGGTGGTGTGTTTATGTTGCATGGTTTTTGGTTTTTGCTACTTC TAGCATATCCTCATTCTTCATTGTATTTTATGGACTGACTTACGGCTATGACAAGTCAATAGAATGGCTC TTTGCATCTTTTTGTTCATTCTGTCAGTCAGTTCTTCTGGTGCAGCCATCTAAAATTATACTCCTGTCAG GCTTCAGAACGAATAAACCCAAGTATTGCAAAAACCTTTCATGGTCAACCAAGTATAAATATACTGAGAT CAGGTTGGATGGAATGCGTATGCATCCAGAAGAAATGCAGAGGATACATGACCAGATCGTCCGAATCCGA GGCACGAGGATGTACCAACCCCTTACAGAAGATGAAATCAGAATATTCAAAAGAAAGAAGAGGATCAAGA GAAGAGCACTCCTGTTTCTGAGTTACATTCTAACTCACTTTATCTTTCTAGCCCTTCTGTTGATCCTTAT CGTCTTACTACGTCACACTGACTGCTTTTACTATAACCAGTTTATTCGTGATCGGTTCTCTATGGATCTT GCTACTGTGACTAAGCTGGAAGACATCTATAGATGGCTAAACAGCGTGCTGTTGCCTTTGTTACACAATG ACCTGAATCCAACATTTCTTCCTGAAAGCTCGTCTAAAATCCTTGGCCTTCCATTGATGAGGCAAGTGAG AGCAAAATCTAGTGAAAAAATGTGTCTACCTGCCGAAAAGTTTGTGCAAAACAGCATCAGAAGAGAAATT CATTGTCACCCCAAATATGGCATTGACCCAGAAGACACAAAAAACTATTCTGGCTTTTGGAATGAAGTTG ATAAGCAGGCTATAGATGAGAGTACCAATGGATTTACTTATAAGCCTCAAGGAACGCAATGGCTATATTA TTCCTATGGACTACTACACACCTATGGATCTGGAGGATATGCACTCTATTTTTTTCCAGAACAGCAGCGG TTTAATTCCACACTGAGGCTCAAAGAACTTCAAGAAAGCAATTGGCTGGATGAGAAGACATGGGCTGTGG TTTTGGAATTAACAACTTTTAATCCAGATATAAATCTGTTCTGTAGCATTTCGGTCATATTTGAAGTCTC TCAGTTAGGAGTTGTCAACACAAGCATATCTCTGCACTCTTTTTCACTTGCTGATTTTGACAGAAAAGCT TCAGCAGAAATCTACTTGTATGTGGCCATTCTCATTTTTTTCTTAGCCTACGTTGTTGATGAGGGTTGTA TCATTATGCAAGAAAGAGCCTCCTATGTGAGAAGTGTGTATAATTTGCTCAACTTTGCTTTAAAGTGCAT ATTTACTGTGTTGATTGTGCTCTTTCTCAGGAAACATTTCCTGGCCACTGGCATAATTCGGTTTTACTTG TCGAACCCAGAAGACTTCATTCCCTTTCATGCAGTTTCTCAGGTAGATCACATTATGAGGATAATTTTGG GTTTCCTGTTATTTCTGACAATTTTGAAGACCCTCAGGTATTCCAGATTCTTCTACGATGTGCGCCTGGC TCAGAGGGCCATCCAGGCTGCCCTCCCTGGCATCTGCCACATGGCATTTGTTGTGTCCGTGTATTTCTTC GTATACATGGCTTTTGGTTACCTGGTGTTTGGTCAGCATGAATGGAACTACAGTAACTTGATTCATTCCA CTCAGACAGTATTTTCCTATTGTGTCTCAGCTTTCCAGAACACTGAATTTTCCAATAACAGGATTCTGGG GGTCCTGTTCCTCTCATCTTTCATGCTGGTGATGATCTGCGTCTTGATCAACTTATTTCAGGCTGTAATT

3
Making sense of genomic seqs Look for repeats HMM analysis Compare genomes to each other Compare to other kind of experimental data –Which kinds of data can you think of?

4
Other kinds of data 1.mRNA (EST) 2.RNA sequences & structures 3.Protein sequences 4.Protein structures 5.SNPs, polymorphisms 6.Gene expression (microarray) 7.Protein expression (2D protein gels) 8.Protein interaction 9.Metabolic pathways 10.Regulatory pathways
 2.RNA sequences & structures 3.Protein sequences 4.Protein structures 5.SNPs, polymorphisms 6.Gene expression (microarray) 7.Protein expression (2D protein gels) 8.Protein interaction 9.Metabolic pathways 10.Regulatory pathways")
6
Transcript databases RefSeq contains full length sequences of mRNAs, carefully reviewed –Currently 5.000 human sequences dbEST contains 5’ and 3’ reads of random cDNAs –Currently 3.7 mio. human seqs

7
ESTs UniGene: Merge (cluster) any two ESTs when >100 bp are identical 3.7 mio -> 104.214 clusters
 any two ESTs when >100 bp are identical 3.7 mio -> clusters")
8
ESTs UniGene: total # clusters 104.214 Cluster size Number of clusters 1 37503 2 14605 3-4 15912 5-8 10798 9-16 5978 17-32 4143 33-64 3658 65-128 4117 129-256 4109 257-512 2317 513-1024 743 1025-2048 227 2049-4096 68 4097-8192 29 8193-16384 6 16385-32768 1

9
Some statistics Copies# different mRNA # of mRNAs per per cell species abundance level _________________________________________ 54000 20.000 503250162.500 200 2500500.000 1000 250250.000 _____________________________ Total10.000932.500

10
More statistics 1.0005.00010.00050.000250.0001.000.000 50.532.655.2223.5273.8399.53 505.2223.5241.593.15100 20016.3165.7888.29100 100065.899.53100 Abundance level Size of EST database

11
Solutions Sequence ESTs from many cell types, rare transcripts might be abundant in other tissues. Use subtraction / normalization procedures prior to sequencing

12
Transcripts: what can we learn? Comparing genome sequences to transcripts allows: –Confirmation of gene predictions –Experimental identification of Exons/Introns, 5’ UTRs, 3’ UTRs –Alternative splicing Asses the relative abundance of transcripts.

13
Protein databases SwissProt: Carfully curated / annotated database of experimentally determined protein sequences: 115.105 entries PIR: Protein Identification Ressource: 283.175 entries. Translated nucleotide databases: nr, trEMBL, RefSeqP m. m.

14
Gene ontology Gene Ontology controlled vocabulary that can be applied to all organisms The three organizing principles of GO are molecular function, biological process and cellular component

16
Combining EST frequencies with GO EST frequncies from blood-fed vs. non-blood-fed mosquitos grouped by function

17
Proteomics

18
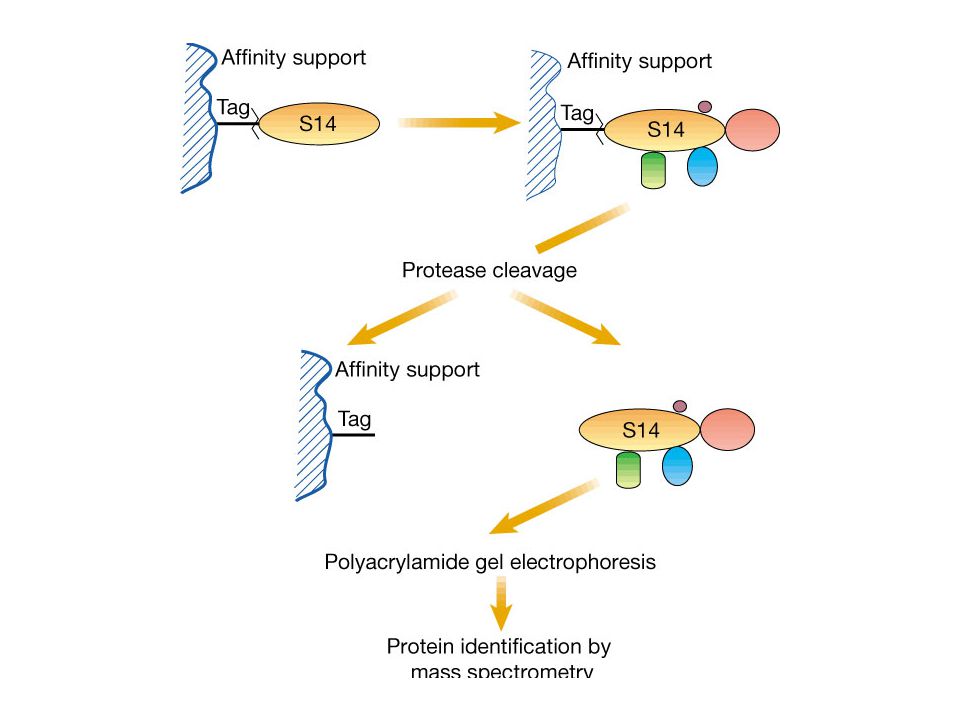
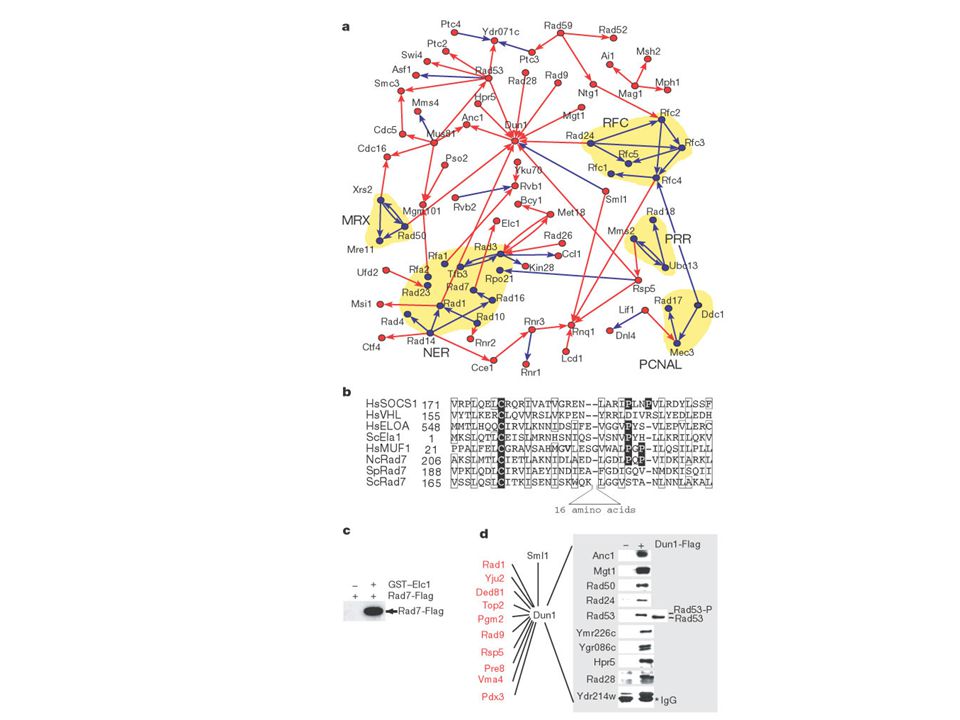
What for? Disease targets Gene finding Secondary modifications Measuring expression levels Protein-protein interactions

19
Whats new? Mass spectrometry was invented turn of century (Thomson) Noble price to Aston 1930s MALDI-TOF (Henzel et al, 1993) Nano-electro-spray (Wilm, Mann 1996s) coupled to tandem mass spectrometer Noble price 2002 to John B. Fenn and Koichi Tanaka
 Noble price to Aston 1930s MALDI-TOF (Henzel et al, 1993) Nano-electro-spray (Wilm, Mann 1996s) coupled to tandem mass spectrometer Noble price 2002 to John B. Fenn and Koichi Tanaka.")
20
M + e- => M+· + 2e-

22
MALDImatrix assisted laser desorption ionization TOFtime-of-flight

23
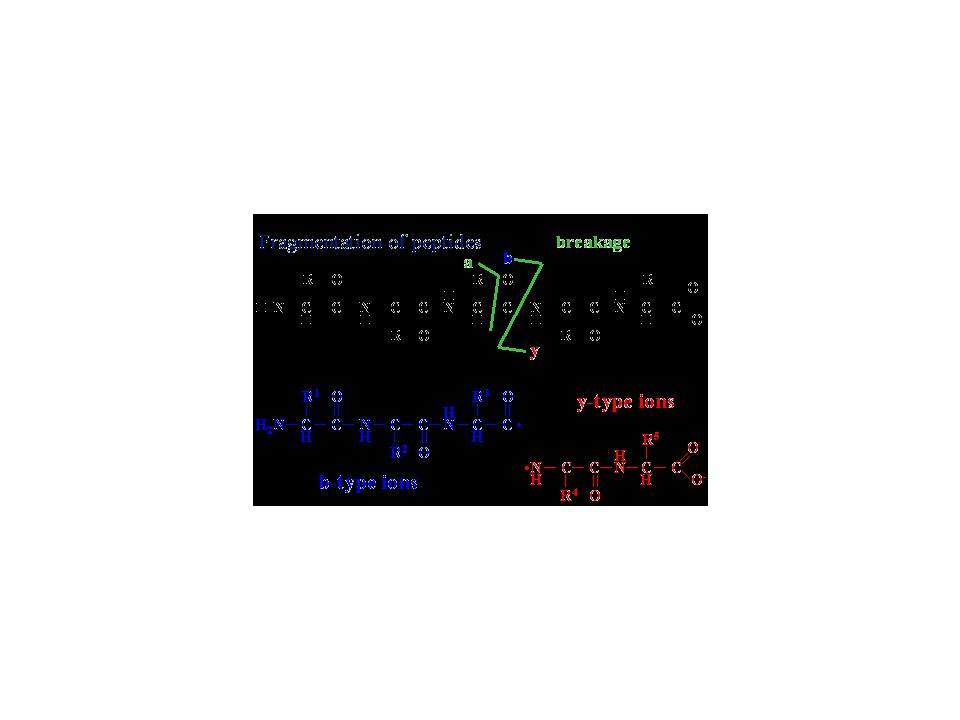
Nanoelectrospray ionization – tandem mass spectrometry (MS-MS)
")
25
Positive ESI-MS m/z spectrum of the protein hen egg white lysozyme. The sample was analysed in a solution of 1:1 (v/v) acetonitrile : 0.1% aqueous formic acid and the m/z spectrum shows a Gaussian-type distribution of multiply charged ions ranging from m/z 1101.5 to 2044.6. Each peak represents the intact protein molecule carrying a different number of charges (protons). The peak width is greater than that of the singly charged ions seen in the leucine enkephalin spectrum, as the isotopes associated with these multiply charged ions are not clearly resolved as they were in the case of the singly charged ions. The individual peaks in the multiply charged series become closer together at lower m/z values and, because the molecular weight is the same for all of the peaks, those with more charges appear at lower m/z values than do those with fewer charges (M. Mann, C. K. Meng, J. B. Fenn, Anal. Chem., 1989, 61, 1702). The m/z values can be expressed as follows:m/z = (MW + nH+) n where m/z = the mass-to-charge ratio marked on the abscissa of the spectrum; MW = the molecular weight of the sample n = the integer number of charges on the ions H = the mass of a proton = 1.008 Da. If the number of charges on an ion is known, then it is simply a matter of reading the m/z value from the spectrum and solving the above equation to determine the molecular weight of the sample. Usually the number of charges is not known, but can be calculated if the assumption is made that any two adjacent members in the series of multiply charged ions differ by one charge. For example, if the ions appearing at m/z 1431.6 in the lysozyme spectrum have “n” charges, then the ions at m/z 1301.4 will have “n+1” charges, and the above equation can be written again for these two ions: 1431.6 = (MW + nH+)and 1301.4 = (MW + (n+1)H+) n(n+1) These simultaneous equations can be rearranged to exclude the MW term: n(1431.6) –nH+=(n+1)1301.4 – (n+1)H+ and so:n(1431.6)=n(1301.4) +1301.4 – H+ therefore: n(1431.6-1301.4)=1301.4 – H+ and:n=(1301.4 - H+) (1431.6 – 1301.4) hence the number of charges on the ions at m/z 1431.6 = 1300.4 = 10. 130.2 Putting the value of n back into the equation:1431.6 = (MW + nH+) n gives1431.6 x 10=MW + (10 x 1.008) and soMW=14,316 – 10.08 thereforeMW=14,305.9 Da The observed molecular weight is in good agreement with the theoretical molecular weight of hen egg lysozyme (based on average atomic masses) of 14305.1438 Da. This may seem long-winded but fortunately the molecular weight of the sample can be calculated automatically, or at least semi- automatically, by the processing software associated with the mass spectrometer. This is of great help for multi-component mixture analysis where the m/z spectrum may well contain several overlapping series of multiply charged ions, with each component exhibiting completely different charge states. Using electrospray or nanospray ionisation, a mass accuracy of within 0.01% of the molecular weight should be achievable, which in this case represents +/- 1.4 Da.
 acetonitrile : 0.1% aqueous formic acid and the m/z spectrum shows a Gaussian-type distribution of multiply charged ions ranging from m/z to Each peak represents the intact protein molecule carrying a different number of charges (protons). The peak width is greater than that of the singly charged ions seen in the leucine enkephalin spectrum, as the isotopes associated with these multiply charged ions are not clearly resolved as they were in the case of the singly charged ions. The individual peaks in the multiply charged series become closer together at lower m/z values and, because the molecular weight is the same for all of the peaks, those with more charges appear at lower m/z values than do those with fewer charges (M. Mann, C. K. Meng, J. B. Fenn, Anal. Chem., 1989, 61, 1702). The m/z values can be expressed as follows:m/z = (MW + nH+) n where m/z = the mass-to-charge ratio marked on the abscissa of the spectrum; MW = the molecular weight of the sample n = the integer number of charges on the ions H = the mass of a proton = Da. If the number of charges on an ion is known, then it is simply a matter of reading the m/z value from the spectrum and solving the above equation to determine the molecular weight of the sample. Usually the number of charges is not known, but can be calculated if the assumption is made that any two adjacent members in the series of multiply charged ions differ by one charge. For example, if the ions appearing at m/z in the lysozyme spectrum have n charges, then the ions at m/z will have n+1 charges, and the above equation can be written again for these two ions: = (MW + nH+)and = (MW + (n+1)H+) n(n+1) These simultaneous equations can be rearranged to exclude the MW term: n(1431.6) –nH+=(n+1) – (n+1)H+ and so:n(1431.6)=n(1301.4) – H+ therefore: n( )= – H+ and:n=( H+) ( – ) hence the number of charges on the ions at m/z = = Putting the value of n back into the equation: = (MW + nH+) n gives x 10=MW + (10 x 1.008) and soMW=14,316 – thereforeMW=14,305.9 Da The observed molecular weight is in good agreement with the theoretical molecular weight of hen egg lysozyme (based on average atomic masses) of Da. This may seem long-winded but fortunately the molecular weight of the sample can be calculated automatically, or at least semi- automatically, by the processing software associated with the mass spectrometer. This is of great help for multi-component mixture analysis where the m/z spectrum may well contain several overlapping series of multiply charged ions, with each component exhibiting completely different charge states. Using electrospray or nanospray ionisation, a mass accuracy of within 0.01% of the molecular weight should be achievable, which in this case represents +/- 1.4 Da..")
26
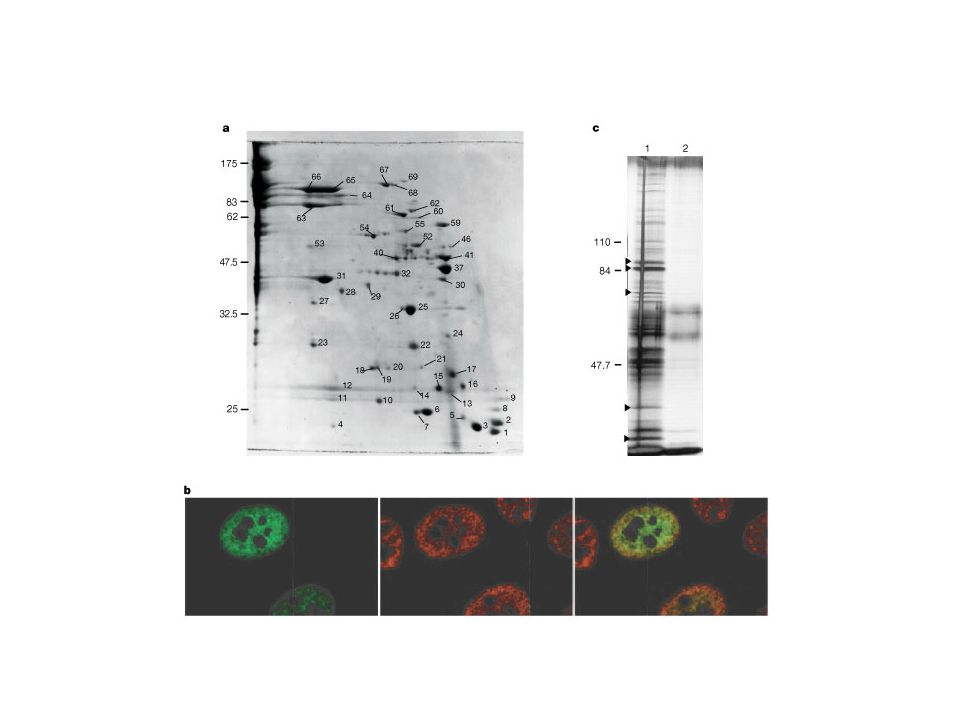
2D-gel electrophoresis

35
Conclusions on helper data 1.mRNA (EST) 2.RNA sequences & structures 3.Protein sequences 4.Protein structures 5.SNPs, polymorphisms 6.Gene expression (microarray) 7.Protein expression (2D protein gels) 8.Protein interaction 9.Metabolic pathways 10.Regulatory pathways
 2.RNA sequences & structures 3.Protein sequences 4.Protein structures 5.SNPs, polymorphisms 6.Gene expression (microarray) 7.Protein expression (2D protein gels) 8.Protein interaction 9.Metabolic pathways 10.Regulatory pathways")
Similar presentations


 proteome: complete.>")


 and Matrix Assisted Laser Desorption Ionization(MALDI) by Matt Fisher.>")


 Eyler Technology Center 1600 Art Unit 1646 (703) 308-6564>")

 Data Kay Hofmann – Protein Evolution Group Week 5: Proteomics.>")


 DNA Microarray, 2d gel, MSMS, yeast 2-hybrid.>")

