Download presentation
Presentation is loading. Please wait.

1
CT Scanning: Dosimetry and Artefacts
Dr. Craig Moore Medical Physicist & Radiation Protection Adviser Radiation Physics Service CHH Oncology

2
Operator Controlled Variables and their effects on Image Quality and Patient Dose
&

3
Imaging Performance Spatial Resolution Z-sensitivity Significance
Factors affecting resolution Z-sensitivity Factors affecting z-sensitivity

5
Modulation Transfer Function (MTF):
Details contrast in image relative to contrast in object MTF50, MTF10, MTF2, MTF0 are often quoted MTF2 approximates to the limit of visual resolution

7
In-plane Spatial Resolution
Maximum that can be achieved is about 20 lp/cm (but usually less) Typical matrix size is 512 x 512 In the scan plane limited by pixel size Pixel size = FOV/matrix i.e. if FOV = 40cm and matrix = 512 then pixel size = 0.8 mm Pixel size determines limit of resolution but there are other factors that affect resolution on a scanner
 Typical matrix size is 512 x 512. In the scan plane limited by pixel size. Pixel size = FOV/matrix. i.e. if FOV = 40cm and matrix = 512 then pixel size = 0.8 mm. Pixel size determines limit of resolution but there are other factors that affect resolution on a scanner.")
8
In-plane Spatial Resolution
Other factors affecting resolution: Filter used for back-projection Size of focal spot, geometry of the scanner and size of detectors Sampling frequency (number of times the x-ray beam is sampled as it rotates around the patient) Spatial resolution the same for axial and helical scanning
 Spatial resolution the same for axial and helical scanning.")
9
z-plane Resolution Spatial resolution in the z-direction (parallel to patient) dependent on pitch The greater the pitch the lower the resolution

10
Summary of spatial resolution
In-plane spatial resolution and z-resolution are usually thought of as different parameters In fact, z-resolution is an extension of spatial resolution in third dimension Multi-slice scanning is moving CT away from slice based medium to a truly 3D modality Structural features are 3D, so resolution should be equal in all dimensions

11
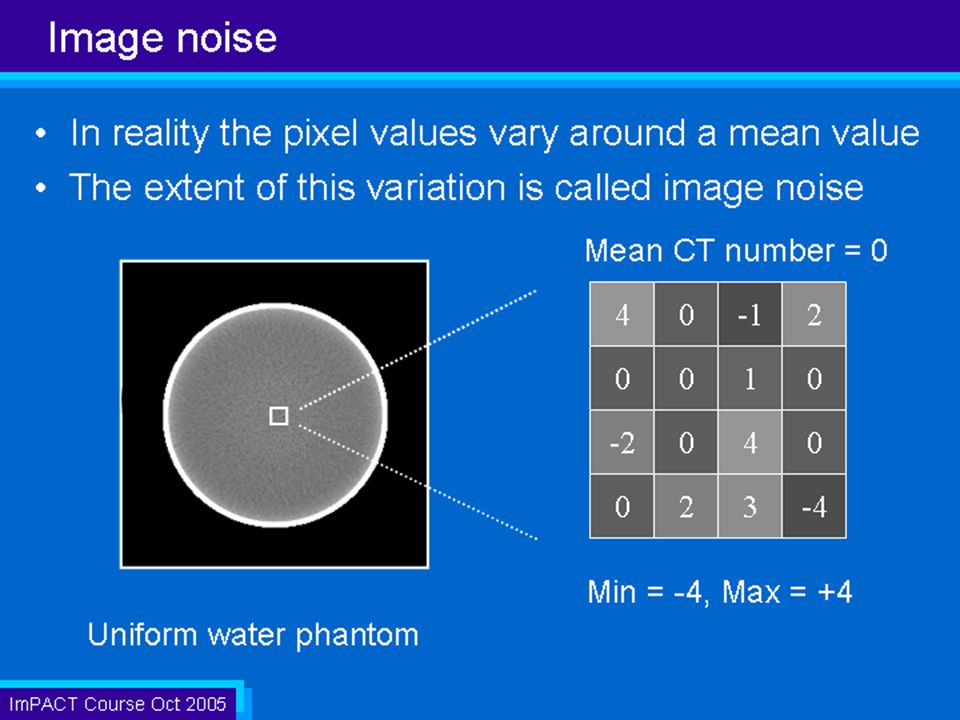
Image Noise

15
Sources of noise (1) Quantum Noise: Randomness of photon detection
This type of noise is the most dominant in CT

16
FOV

20
Sources of Noise (2) Structure noise:
Affected by back-projection filters

21
Sources of Noise (3) Electronic noise
– small compared to other sources

22
Image Contrast & Noise Contrast is equivalent to the difference in CT number between an object and its surrounding tissue When viewing objects which have CT numbers close to background noise can mask detail Increased noise Increased contrast Pixel number

23
Low Contrast Resolution:
Measure of how well a system can differentiate between an object and its background having similar attenuation coefficients Low Medium High

24
Low contrast exams account for approximately 90% of CT scans
Low contrast resolution is important when small contrast differences are crucial for early detection of disease Low contrast exams account for approximately 90% of CT scans Affected by all parameters that influence noise Minimum detectable contrast is <0.5% Low contrast of a few HU

26
Principles of CT Dosimetry

27
Dose in CT One of the highest dose techniques used in medical imaging
Within the UK it has been shown to contribute to 40% of the total dose attributable to medical exposure But only 4% of the total number of exams

28
Radiation Units Absorbed dose in CT Radiation risk in CT
CT Dose Index (CTDI) (mGy) Radiation risk in CT Dose Length Product (DLP) (mGy cm) Effective dose (mSv)
 (mGy) Radiation risk in CT. Dose Length Product (DLP) (mGy cm) Effective dose (mSv)")
29
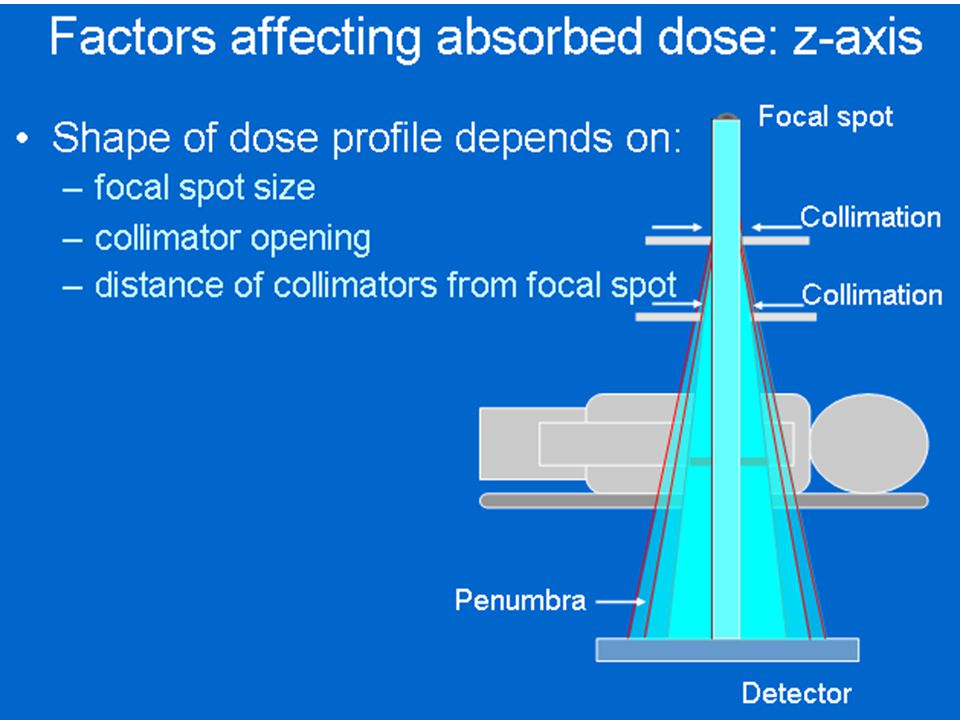
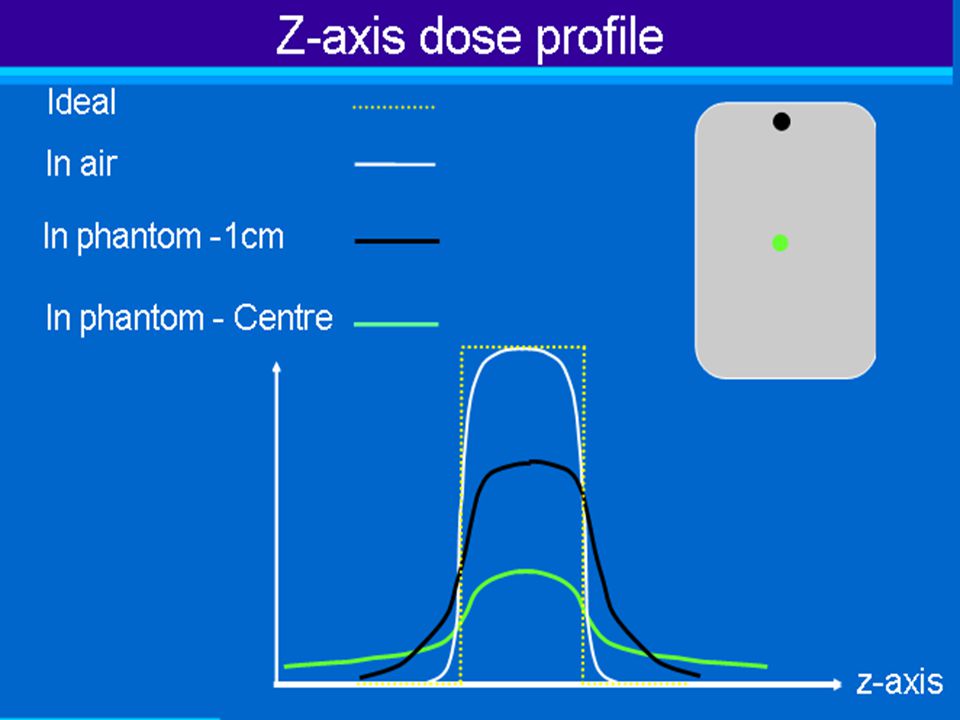
Dose Distribution in CT
Absorbed dose not a single value Dose values vary with position in patient in scan plane and along z axis

30
Dose Distribution Depends on More uniform for Periphery:centre
Filtration Beam shaping Scanner geometry Size of patient More uniform for Higher filtration Optimised beam shaping Smaller patient Periphery:centre Body 2:1 Head 1:1

31
CT Dose Index (CTDI) Measure of dose in the scan plane from a single rotation CTDI defined as: Dose at position z, Dz is integrated over the complete dose profile and divided by slice thickness T

32
Dose Profile along z patient

35
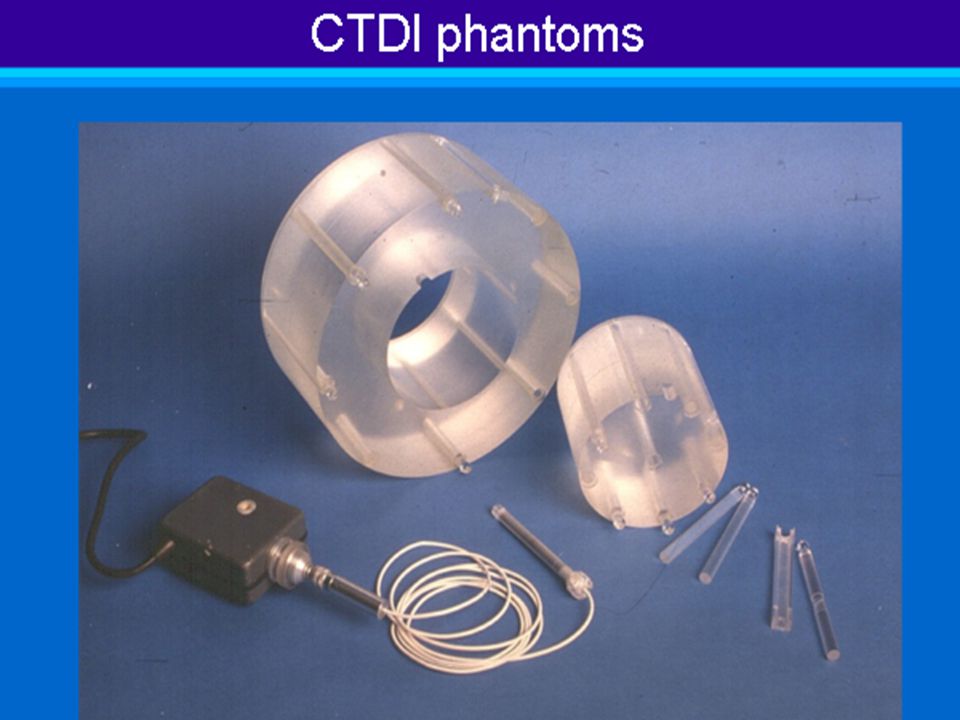
Measurement of CTDI Routinely measured with air filled pencil ion chambers Use PMMA phantoms to simulate patient Single rotation with chamber: At the centre At the edges Calculate CTDIcentre and CTDIedge

37
Complete cross section of dose

38
HIGHER DOSE ‘MEDIUM’ DOSE LOWER DOSE

39
Pitch typically between 1 and 2

41
HIGHER DOSE HIGHER DOSE LOW DOSE (mA typically 100 to 200)
")
42
HIGH DOSE LOW DOSE MUST INCREASE mA and/or s kV typically between 80 and 140 kV

43
For the same pitch

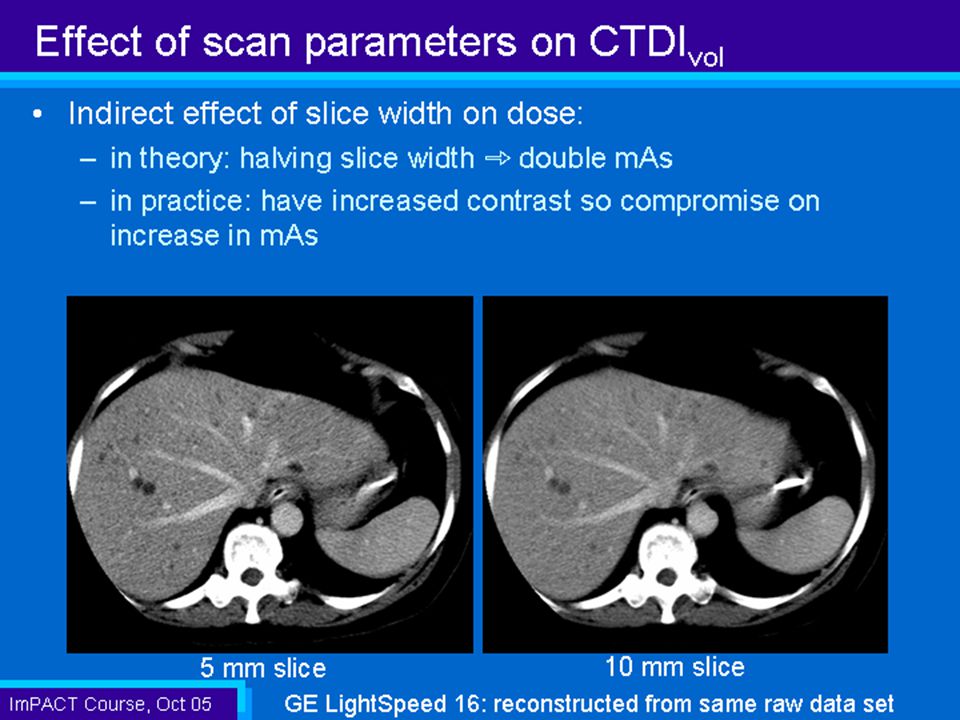
48
Effective Dose To estimate the stochastic risk to the patient, must consider scan length (DLP) and anatomical location of scan Effective dose used This is the equivalent whole body dose

49
x 7

50
Effective Dose (mSv) CT is one of (if not THE), highest dose x-ray modalities used in the hospital Head – 2 mSv Chest – 8 mSv Abdomen and pelvis – 10 mSv CT KUB – mSv Planar chest – mSv CT chest is 600 times the dose of planar chest Planar IVU has effective dose 1.5 – 3 mSv CT KUB is up to 10 times the dose of planar IVU

58
MUST BE CAREFUL TO OPTIMISE DOSE – HAVE SPECIFIC INFANT PROTOCOLS

63
Overview of dose reduction methods
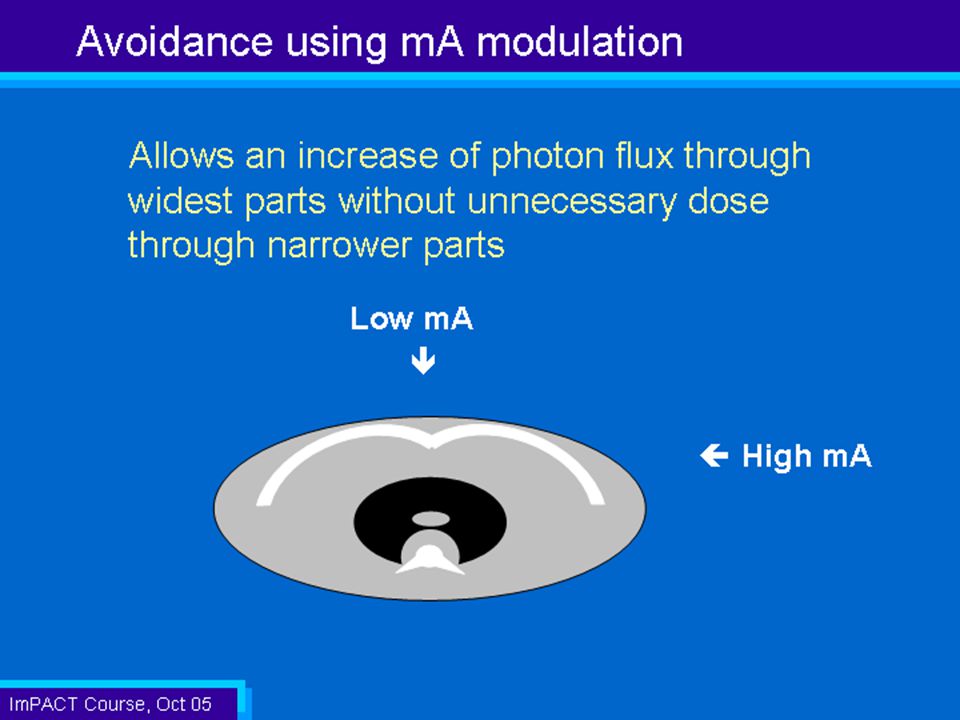
X ray beam filtration Harden the beam so to reduce low energy photons Shape the beam to the relevant anatomical region X ray beam collimation The beam should be limited to the minimum dimensions required Tube potential, current and time Tube current modulation and AECs Tube current is chosen to maintain predetermined level of noise Size or Weight Based Technique Charts CT image never appears overexposed Standardise kVp, mA and scan time Detector efficiency No detector is 100% efficient at converting photon into signal Modern scanner have 90% efficiencies or above Noise reduction algorithms Smooth noise without reducing fine detail

64
Contrast and Special Uses of CT
CT is being used increasingly for interventional work Special sequences can allow 3D images at 5 frames per second for biopsy needle placement Alternatively needle can be moved between scans in a ‘step and shoot’ method Contrast given to enhance the visibility of certain structures (i.e. increase the CNR) Should be given with caution or avoided altogether in patients with poor kidney function eGFR 30 – 60 with caution Below 30 significant risk Doctor must be available on-call in case of anaphylactic reaction (treatment of which includes intramuscular adrenaline, coticosteroids and antihistamines) Modern scanners can scan the heart in less than 0.5s is one rotation, thus avoiding motion artefacts of the beating heart
 Should be given with caution or avoided altogether in patients with poor kidney function. eGFR 30 – 60 with caution. Below 30 significant risk. Doctor must be available on-call in case of anaphylactic reaction (treatment of which includes intramuscular adrenaline, coticosteroids and antihistamines) Modern scanners can scan the heart in less than 0.5s is one rotation, thus avoiding motion artefacts of the beating heart.")
65
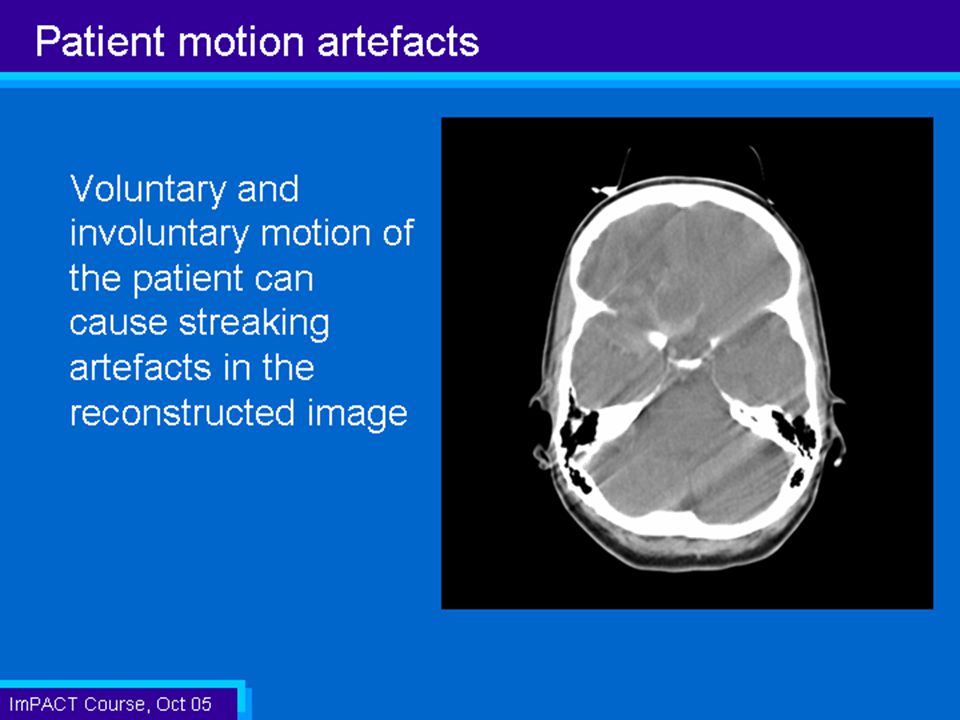
Image Artefacts What are artefacts?
Systematic discrepancies between the CT numbers in the reconstructed image and the true attenuation coefficients of the object Non-random, or structured image noise

66
Non-random, or structured, image noise
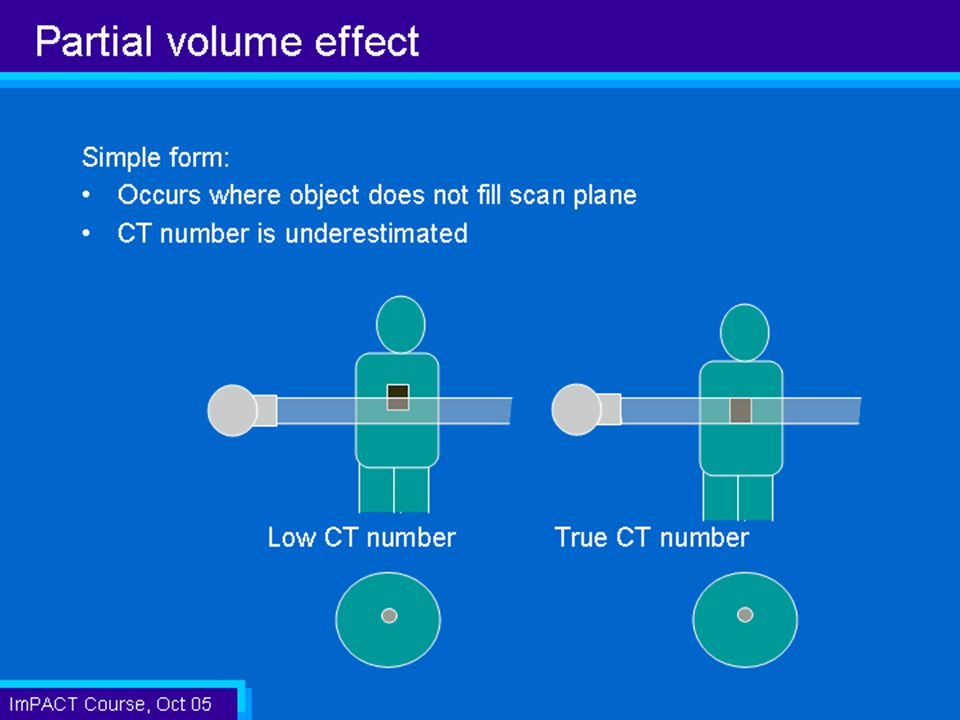
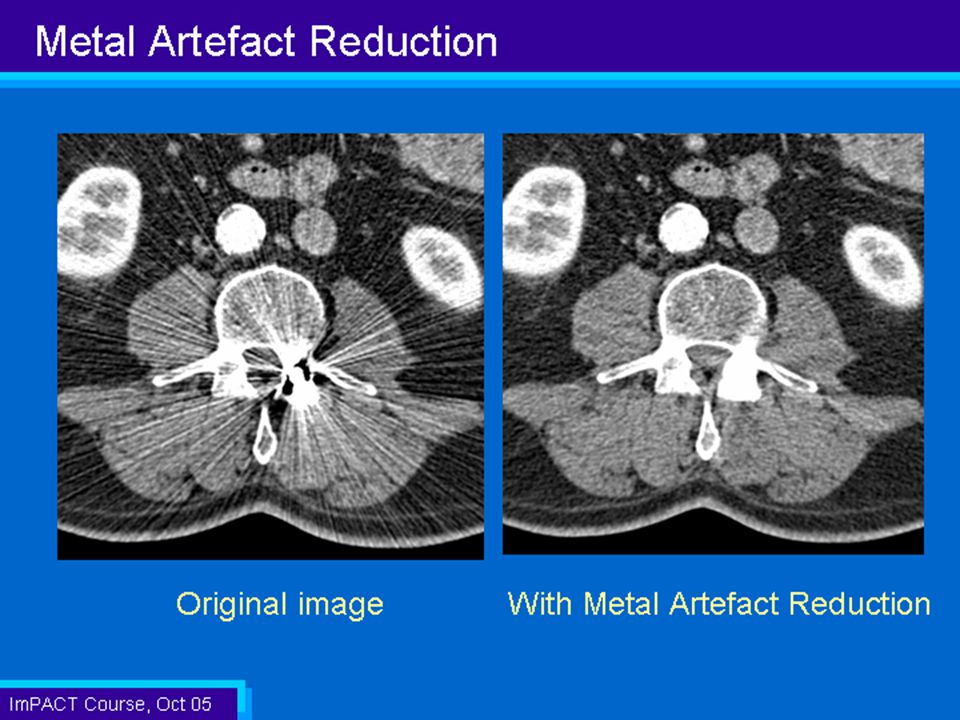
Artefact Origins Physics based Beam hardening Partial volume effects Photon starvation Undersampling Patient based Presence of metal Motion Scanner based Detector sensitivity Mechanical instability Non-random, or structured, image noise

67
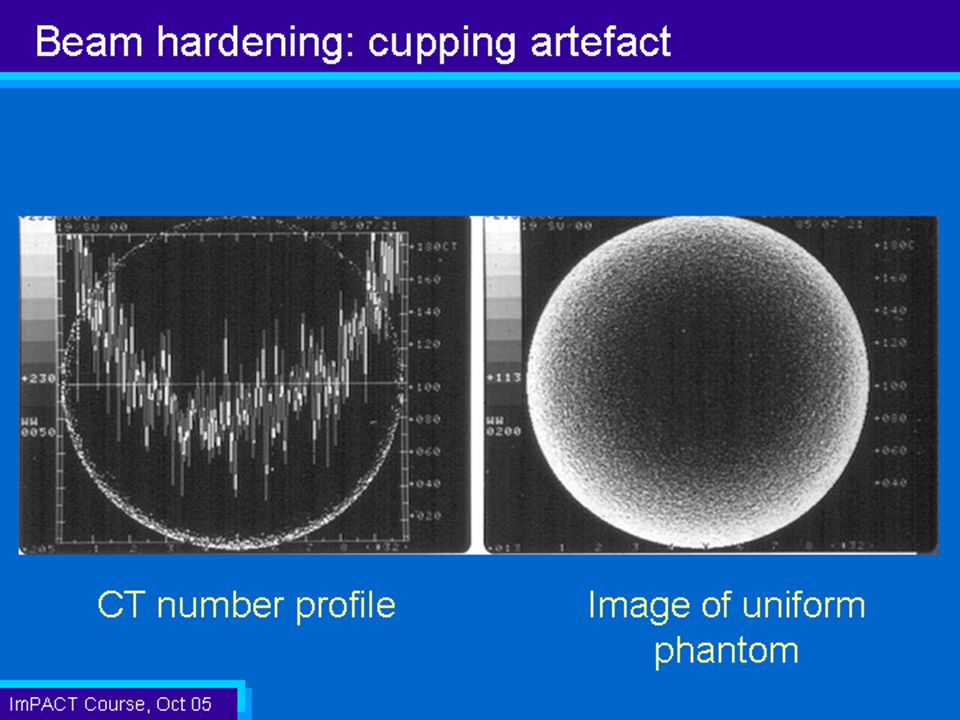
Beam Hardening Artefacts
As beam passes through patient, low energy photons are filtered and the beam becomes harder This causes the attenuation coefficient and CT number for a given tissue to decrease along the beam path. Reconstruction process assumes a monoenegetic beam CT numbers are lower in the centre than they should be Cupping Streaks

69
Avoiding beam hardening artefacts
Adequate beam filtration Flat filter Bow tie filter Correction factors built in to calibrate Beam hardening correction software Avoidance of bony regions when possible Patient positioning and gantry tilt

72
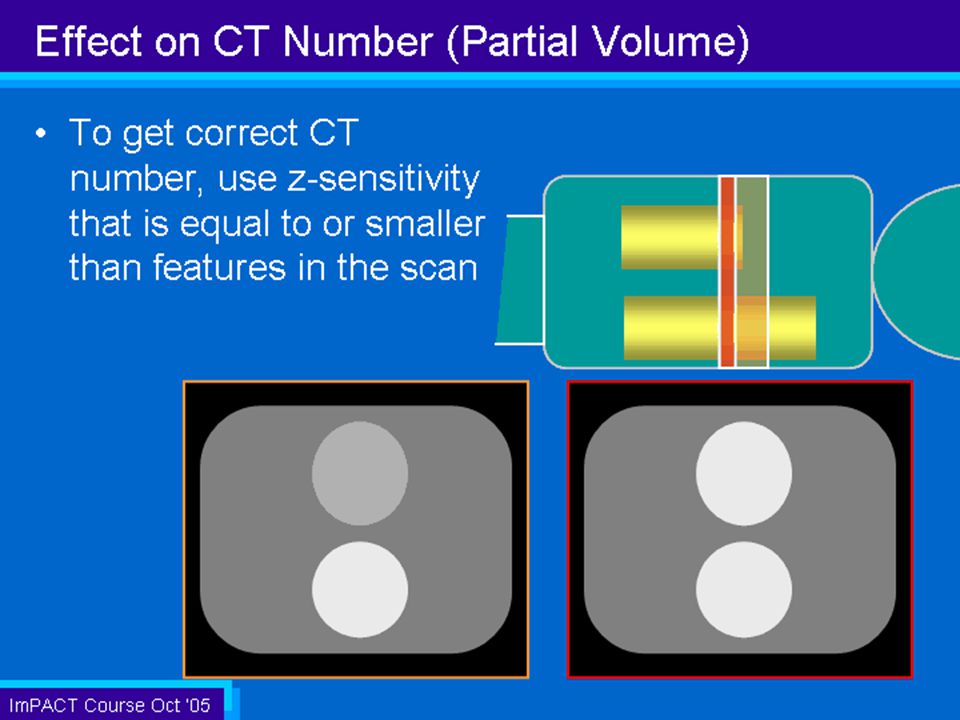
Objects smaller than a voxel its density will be averaged across the whole voxel so it will appear bigger and less dense

80
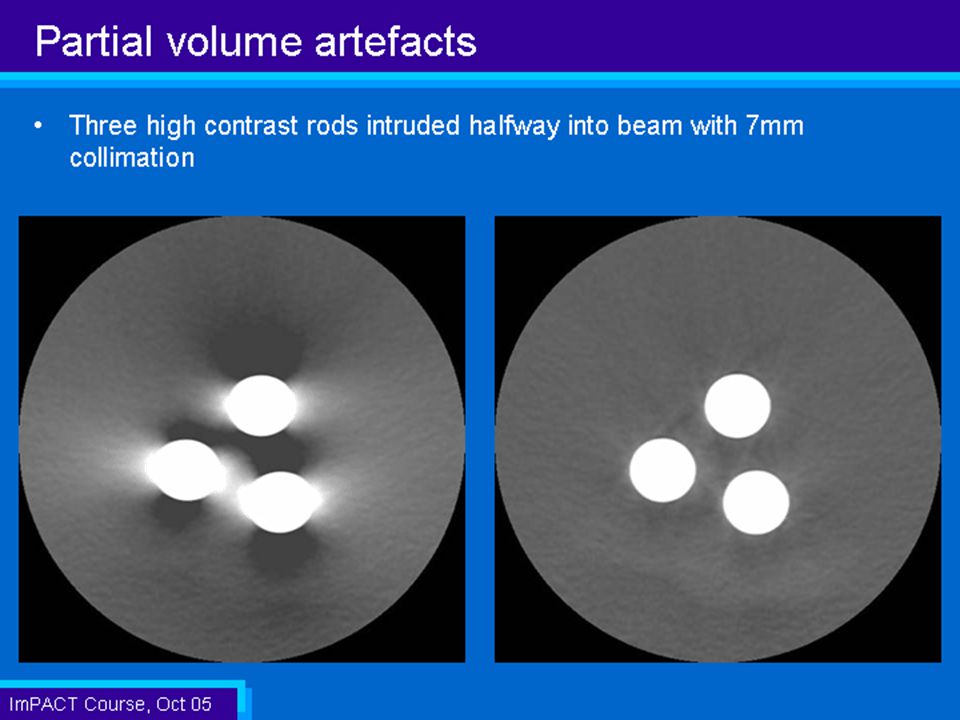
Can still be a significant problem in images even with software correction

86
Mechanical Instability
X-ray tube rotor wobble rotates at ~10,000 rpm high temperatures high frequency rotor wobble causes beam deviations streak artefacts result With rotor wobble Without rotor wobble

90
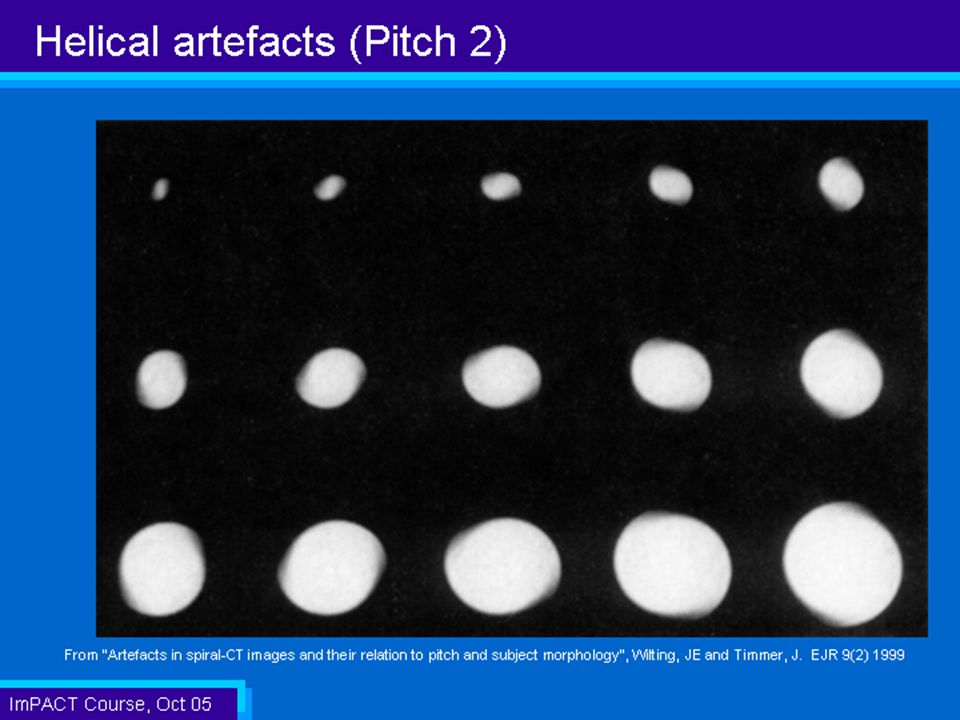
Artefacts in Helical Scanning
In general, the same as in conventional scanning Additional artefacts occur due to interpolation Worse at higher pitches Due to changing structure in z-direction (e.g. skull)
")
92
Helical artefact of spherical phantom at pitch 2
Bilateral subdural haemorrhage or helical artefact?

93
Minimization Reduce effects of variation along z-axis
Pitch of 1 rather than higher pitch 180° rather than 360° interpolation Thin slices

98
Conclusions Artefacts originate from a range of sources and can degrade the diagnostic quality of an image Some can be partially corrected for in software Good scanner design, careful positioning of patient and optimum selection of scan parameters can minimise the artefacts present in an image

99
CT Summary CT scanner generate images in transaxial slices
CT number represents average linear attenuation coefficient in the voxel Contrast in the displayed image is enhanced by windowing The scanner gantry carries the X-ray tube and generator and a curved bank of detectors The image is reconstructed by filtered back projection Slip ring technology allows the gantry to rotate continuously In helical scanning, the patient is moved through the gantry while the gantry rotates Helical pitch is defined as ratio of table movement per rotation to slice thickness Multislice scanners have several rows of detectors that collect data simultaneously Multislice scanning can produce 3D images In-plane resolution is at best 20 lp/cm Quantum noise is the main limit ti low contrast resolution Dose is generally higher for CT than other X-ray modalities

Similar presentations