Download presentation
Presentation is loading. Please wait.

1
AIR POLLUTION AND METEOROLOGY
Dr.K. Subramaniam, Senior Lecturer (Environmental Health and Safety ) ATTENTION/MOTIVATION: The following are two old weather proverbs: The smoke from chimneys straight ascends, Then spreading back to earth it bends. When the ditch and pond offend the nose, Then look for rain and stormy blows. Meteorology is the study and forecasting of weather changes resulting from large-scale atmospheric circulation. Meteorological principles and a knowledge of circulation patterns are major factors in effective air pollution control. Since we have no control over the weather, emission rates must be controlled so that pollution problems are less likely to develop during adverse weather periods.
 ATTENTION/MOTIVATION: The following are two old weather proverbs: The smoke from chimneys straight ascends, Then spreading back to earth it bends. When the ditch and pond offend the nose, Then look for rain and stormy blows. Meteorology is the study and forecasting of weather changes resulting from large-scale atmospheric circulation. Meteorological principles and a knowledge of circulation patterns are major factors in effective air pollution control. Since we have no control over the weather, emission rates must be controlled so that pollution problems are less likely to develop during adverse weather periods.")
2
METEOROLOGY OF AIR POLLUTION
Transport and dispersion Removal mechanisms

3
Important Aspects of Air Pollution Meteorology
Atmospheric Turbulence Scales of Atmospheric/Turbulent Motion Plume Behavior Planetary Boundary Layer (PBL) Effects on Dispersion Applications OVERVIEW: This lecture is the start for the following air pollution lectures since it’s the basis for the meteorological effects of pollutants in the atmosphere. The following lectures pertain to air quality compliance, sources & effects of air pollution, air emissions inventory, Clean Air Act monitoring requirements, and air pollution control technologies. During this lecture, we will discuss the following: Atmospheric Pollutants Turbulence/Atmospheric Stability Planetary Boundary Layer Plumes and Dispersion Behavior Circulation Patterns
 Effects on Dispersion. Applications. OVERVIEW: This lecture is the start for the following air pollution lectures since it’s the basis for the meteorological effects of pollutants in the atmosphere. The following lectures pertain to air quality compliance, sources & effects of air pollution, air emissions inventory, Clean Air Act monitoring requirements, and air pollution control technologies. During this lecture, we will discuss the following: Atmospheric Pollutants. Turbulence/Atmospheric Stability. Planetary Boundary Layer. Plumes and Dispersion Behavior. Circulation Patterns.")
4
Meteorological Parameters that Influence Air Pollution
Turbulence Wind Speed and Direction Temperature Stability Mixing Height

5
Atmospheric Turbulence
Responsible for dispersion/transport of pollutants Refers to the apparently chaotic nature of fluid motions (in this case, atmospheric motions) Irregular, almost random fluctuations of such parameters as: velocity temperature scalar concentrations (pollutants) Atmospheric turbulence is responsible for dispersion and transport of pollutants in a chaotic motion. This chaotic motion affects parameters such as velocity, temperature, and pollutant concentrations.
 Irregular, almost random fluctuations of such parameters as: velocity. temperature. scalar concentrations (pollutants) Atmospheric turbulence is responsible for dispersion and transport of pollutants in a chaotic motion. This chaotic motion affects parameters such as velocity, temperature, and pollutant concentrations.")
6
Atmospheric Turbulence Sources
Mechanical Forcing Buoyant or Thermal Forcing

7
Atmospheric Turbulence (Sources)
Mechanical Forcing: Air flowing over irregular surface Change in horizontal wind speed with height Factors Influencing Mechanical Forcing: Speed of local winds Roughness of terrain over which wind is blowing Two major sources of atmospheric turbulence are Mechanical Forcing and Buoyant Forcing. Mechanical Forcing involves air flowing over an irregular surface causing changes in horizontal wind speed with respect to height. Factors affecting this type of forcing are the speed of the local winds and the roughness of the terrain in which the wind is blowing over.

10
Adiabatic Lapse Rate It is the temperature profile of what would happen to a parcel of air that is raised or lowered vertically, and allowed to cool or heat from expansion or contraction with no exchange of energy or heat.

11
Atmospheric Turbulence (Sources)
Buoyant Forcing (Thermal): Air rises or sinks based on temperature; heated air becomes less dense & rises on its own; cooled air becomes more dense & sinks Factors Affecting Buoyant Forcing “Stability” of the atmosphere Vertical temperature profile of the atmosphere Lapse Rate; specifically the Dry Adiabatic Lapse Rate which is: 1oC/100m = 10oC/km = 5.4oF/1000 ft Next is Buoyant Forcing, in which air rises or sinks depending on the air temperature. Heated air becomes less dense and rises on its own. Cooled air becomes more dense and sinks. However, what happens when no heat is added or extracted to a parcel of air? When a parcel of air rises, it expands, and the temperature decreases. Likewise, when air sinks, it compresses, and the temperature increases. This phenomenon occurs without adding or withdrawing energy from the parcel. When a parcel of air, either dry or containing water vapor, rises or sinks without the addition or extraction of heat, that process is said to be a dry adiabatic process. The dry Adiabatic Lapse Rate is 1oC/100m = 10oC/km = 5.4oF/1000 ft. This means that a parcel of dry air lifted 100 meters will cool 1 degree Celsius. The stability of the atmosphere is basically determined by comparing the lapse rate of a parcel air (dry adiabatic process) to the lapse rate of the surrounding air (environment). If the lapse rate of the surrounding air is greater than the lapse rate of the parcel of air, then the stability condition is unstable. If the lapse rate of the surrounding air is equal to the lapse rate of the parcel of air, then the stability condition is neutral. Finally, if the lapse rate of the surrounding air is less than the lapse rate of the parcel of air, then the stability condition is stable. Let’s look at some examples.
: Air rises or sinks based on temperature; heated air becomes less dense & rises on its own; cooled air becomes more dense & sinks. Factors Affecting Buoyant Forcing. Stability of the atmosphere. Vertical temperature profile of the atmosphere. Lapse Rate; specifically the Dry Adiabatic Lapse Rate which is: 1oC/100m = 10oC/km = 5.4oF/1000 ft. Next is Buoyant Forcing, in which air rises or sinks depending on the air temperature. Heated air becomes less dense and rises on its own. Cooled air becomes more dense and sinks. However, what happens when no heat is added or extracted to a parcel of air When a parcel of air rises, it expands, and the temperature decreases. Likewise, when air sinks, it compresses, and the temperature increases. This phenomenon occurs without adding or withdrawing energy from the parcel. When a parcel of air, either dry or containing water vapor, rises or sinks without the addition or extraction of heat, that process is said to be a dry adiabatic process. The dry Adiabatic Lapse Rate is 1oC/100m = 10oC/km = 5.4oF/1000 ft. This means that a parcel of dry air lifted 100 meters will cool 1 degree Celsius. The stability of the atmosphere is basically determined by comparing the lapse rate of a parcel air (dry adiabatic process) to the lapse rate of the surrounding air (environment). If the lapse rate of the surrounding air is greater than the lapse rate of the parcel of air, then the stability condition is unstable. If the lapse rate of the surrounding air is equal to the lapse rate of the parcel of air, then the stability condition is neutral. Finally, if the lapse rate of the surrounding air is less than the lapse rate of the parcel of air, then the stability condition is stable. Let’s look at some examples.")
12
Atmospheric Turbulence (Buoyant Forcing)
Cooler Air Warmer Air DRY ADIABATIC PROCESS Ground When a parcel of air rises, it expands, and the temperature decreases. When air sinks, it compresses, and the temperature increases. When this process occurs with out the addition or withdrawal of heat from the parcel, this process is called dry adiabatic.

13
Atmospheric Turbulence (Buoyant Forcing)
Cooler Air Warmer Air Unstable Conditions - Turbulence is produced Ground Displaced warmer air will now rise on its own (Thermals; Thunderstorm updrafts) When a parcel of air is lifted and continues to rise after the lifting force disappears, the atmosphere is unstable. In an unstable layer, the lapse rate of a rising parcel is less than the lapse rate of the environment. Though the parcel cools as it rises, its temperature remains warmer than the surrounding air during its ascent through an unstable layer. Because the parcel is warmer than the environment, the parcel has positive buoyancy and continues to rise on its own.
 When a parcel of air is lifted and continues to rise after the lifting force disappears, the atmosphere is unstable. In an unstable layer, the lapse rate of a rising parcel is less than the lapse rate of the environment. Though the parcel cools as it rises, its temperature remains warmer than the surrounding air during its ascent through an unstable layer. Because the parcel is warmer than the environment, the parcel has positive buoyancy and continues to rise on its own.")
14
Atmospheric Turbulence (Buoyant Forcing)
Warmer Air Cooler Air Stable Conditions - Turbulence is suppressed Ground Displaced cooler air will sink back to starting point In a stable atmosphere, if you lift a parcel of air, the temperature of rising air will decrease fast enough that its temperature will be colder than the temperature of the environment. If the force pushing the parcel disappears, the parcel would sink back down to its original position. Even though a parcel of air is being forced up, it has negative buoyancy meaning it wants to sink to its original position where it was in equilibrium with the environment.

15
Atmospheric Turbulence (Buoyant Forcing)
Neutral Atmospheric Conditions Environment Air Parcel Ground In a neutral atmosphere, the two lapse rates are equal. If a parcel of air is lifted through a neutral layer, the temperature and pressure of the parcel will be identical to the temperature and pressure of the surrounding air at every height and is always in equilibrium with the environment. Thus, the parcel is not buoyant.

16
Planetary Boundary Layer (PBL)
Top of the atmospheric boundary layer can be defined as the lowest level in the atmosphere at which the ground surface no longer influences the meteorological parameters through turbulence transfer of mass During day this corresponds to Mixing height (up to 3 km in height) Processes include: Roughness of terrain Obstructed flow Heat and energy transfer PBL is that layer of air (up to 3 km in height) which is influenced by friction from the earth's surface and the processes that occur there such as: roughness of terrain, obstructed flow, and heat and energy transfer.
 Processes include: Roughness of terrain. Obstructed flow. Heat and energy transfer. PBL is that layer of air (up to 3 km in height) which is influenced by friction from the earth s surface and the processes that occur there such as: roughness of terrain, obstructed flow, and heat and energy transfer.")
17
The effect of boundary layer stability on plume behavior
In a well-mixed turbulent boundary layer on a hot day (forced by buoyancy), the turbulent eddies may be large and intense enough to advert the whole plume down to the ground. This can result in extremely high plume concentrations in the vicinity of the source.
, the turbulent eddies may be large and intense enough to advert the whole plume down to the ground. This can result in extremely high plume concentrations in the vicinity of the source.")
18
The effect of boundary layer stability on plume behavior
This is the kind of form assumed for a Gaussian plume, when the boundary layer is well-mixed and turbulent eddies are smaller than the plume scale. The plume forms a cone downstream.

19
The effect of boundary layer stability on plume behavior
In a stable boundary layer, the plume spreads out horizontally at its level of neutral buoyancy. Vertical motion is weak, so there is little upward spread, but the plume forms a `fan' when viewed from above. The plume is not well-mixed in the vertical, which implies relatively slow dilution, but there are not likely to be high plume concentrations at the ground. Unfortunately, this kind of plume may be the precursor to a `fumigation' event if the inversion is subsequently mixed to ground level.

20
The effect of boundary layer stability on plume behavior
At early evening, if a surface inversion is developing, vertical motion may be inhibited below the plume while remaining active above: the plume is diluted but does not reach the ground. This is a favorable situation.

21
The effect of boundary layer stability on plume behavior
There is a strong inversion restricting mixing above, and the plume is mixed throughout the boundary layer. This can occur quite rapidly. For example, after sunrise when the nocturnal inversion is being eroded from below by buoyant eddies, plume-level air of high concentration may be brought down to the surface over a wide area.

22
Effects of PBL Height on Stack Pollutant Dispersion
PBL below stack top: little or no concentration of pollutants at the surface Horizontal Winds PBL Top PBL In this example, horizontal winds are prevalent in the free atmosphere. There’s little energy dissipation due to the lack of friction and turbulence only occurs in convective clouds and near jet streams. As a result, there really is no concentration of pollutants at the earth’s surface where we would be most affected.

23
Effects of PBL Height on Stack Pollutant Dispersion
PBL Top Buoyant Turbulence PBL In this example, turbulence occurs due to the warmer air being more buoyant that cooler air, allowing it to rise and mix with the surrounding air. In this example, there would be an increase in concentration of pollutants below the PBL line, but not much at the surface. PBL well above stack top: decreased concentrations of pollutants at the surface

24
Effects of PBL Height on Stack Pollutant Dispersion
PBL just above stack top: increased concentrations of pollutants at the surface PBL Top PBL Buoyant Turbulence This example clearly demonstrates the increased concentration of pollutants at the surface due to the PBL just above the stack. Turbulence increases dramatically as well as the increase in energy dissipation due to friction with the earth’s surface. You can now see the direct impact the PBL has on pollutant concentrations based on the height of the PBL.

25
Temperature Profile in Atmosphere
1. INVERSIONS 2. ATMOSPHERIC STABILITY

26
Effects of Stability on Stack Pollutant Dispersion
Unstable Conditions: leads to greater dispersion of pollutants PBL Top PBL Environmental lapse rate Dry adiabatic lapse rate height Tempt Let’s discuss stability again, but with respect to stack pollutant dispersion. The stability of the atmosphere often dictates the behavior of a plume in terms of the height it will rise and to what degree it will mix into the environment. For example, a plume released in an unstable atmosphere will display a looping pattern. This pattern occurs when updrafts from warming air at the surface carry a segment of the plume upward while compensating downdrafts force the adjacent section downward.

27
Effects of Stability on Stack Pollutant Dispersion
Stable conditions: lead to less dispersion of pollutants PBL Top PBL A stable atmosphere, commonly marked by an inversion on clear nights, yields a fanning pattern. A plume released into a stable atmosphere will not rise or mix unless it encounters turbulence. Dry adiabatic lapse rate Environmental lapse rate Height Temp

28
Effects of Stability (Ground Source Pollutant Dispersion)
Buoyant Turbulence Here’s another example of a Looping pattern, but the source is at the surface. XXX Unstable Conditions: Lead to lower concentration of pollutants at surface

29
Effects of Stability (Ground Source Pollutant Dispersion)
Stable Conditions: Leads to greater concentration of pollutants at surface Another example of a Fanning pattern at the surface. Due to this pattern, it will yield greater concentrations at the surface than the Looping pattern. XXX

30
WIND SPEED AND DIRECTION
Mesoscale circulation Large scale circulation

31
Mesoscale Circulations Affecting Dispersion
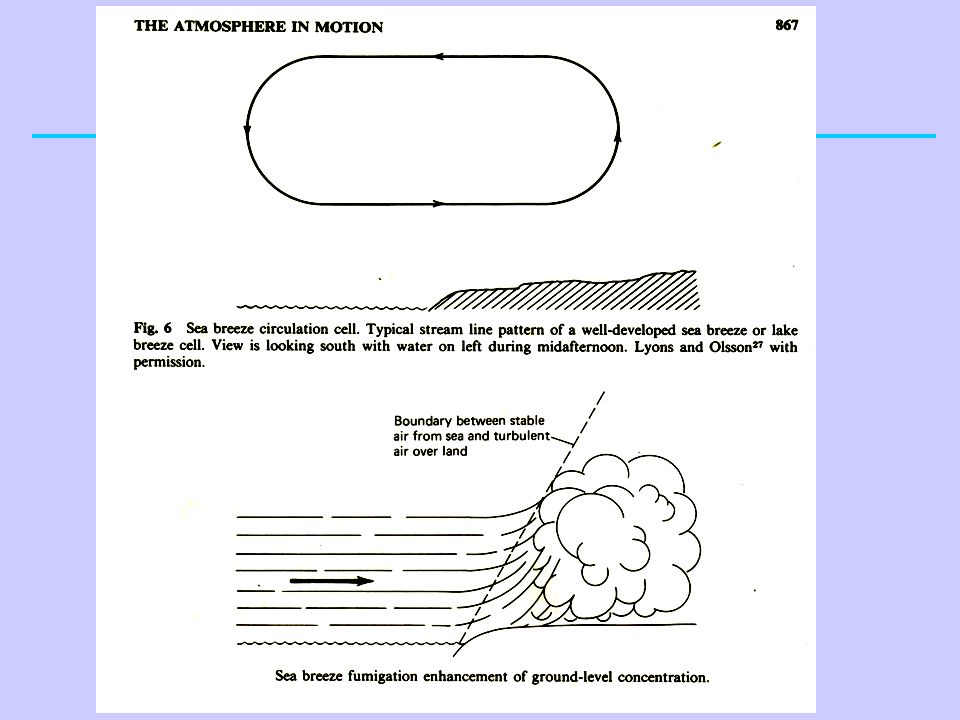
Land-Sea Breeze: Daytime (Sea Breeze) Upper Level Return Flow Air Warmed over Land Expands (Becomes Less Dense) Air Cooled over Water Contracts (Becomes More Dense) Sea Breeze (arises due to density differences) Remember that Mesoscale phenomena have an approximate size between 1km and 100 km and a time span between a few minutes to a day. This scale includes weather such as sea breezes and mountain- valley breezes. Air flow in this scale is influenced by differential heating or cooling over an area and by differences in terrain which can accentuate this process. The sea and land breeze circulations are good examples of thermal circulations. The sea-breeze forms during the day, the land breeze at night. The sea breeze forms due to the differential heating of the air over a region where a large body of water and land meet. Let's look at a situation that might occur at the beach. Land surfaces generally absorb and emit radiation more efficiently than water surfaces. Therefore, the air above the land will heat and expand more rapidly than the air over the water. A relative high pressure area will form aloft over the land, and a relative low pressure area will form over the water. The pressure gradient will force air movement toward the low pressure area, and a thermally driven circulation will form. The breeze that forms along the surface blowing in from the water (called an onshore breeze) brings in cool air. This is why, during mid-day at the beach, the air is often much cooler than it is just a few miles inland. This air is also very moist, and can form clouds and even storms where it rises over the low pressure area. This separation zone between the warm inland air and the cool sea breeze air is known as a sea breeze front. This front can bring significant precipitation under the right circumstances. For example, in Florida, sea breeze fronts move in from the west and from the east, then converge over central Florida. This convergence pushes more air upward, producing strong thunderstorms. At night, however, the opposite effect takes place, called the land breeze. Because the land also cools more rapidly than the water, a similar situation occurs late at night, but in the opposite direction. Here, the cooled air over the land contracts, forming a low pressure aloft over land and a relative high pressure aloft over the water. The resulting circulation is known as a land breeze, because the wind now blows offshore. Warmer Land Cooler Water Reverses at Night as Water Remains Warmer than Land to Make Land Breeze
 Upper Level Return Flow. Air Warmed over Land Expands. (Becomes Less Dense) Air Cooled over Water Contracts. (Becomes More Dense) Sea Breeze (arises due to density differences) Remember that Mesoscale phenomena have an approximate size between 1km and 100 km and a time span between a few minutes to a day. This scale includes weather such as sea breezes and mountain- valley breezes. Air flow in this scale is influenced by differential heating or cooling over an area and by differences in terrain which can accentuate this process. The sea and land breeze circulations are good examples of thermal circulations. The sea-breeze forms during the day, the land breeze at night. The sea breeze forms due to the differential heating of the air over a region where a large body of water and land meet. Let s look at a situation that might occur at the beach. Land surfaces generally absorb and emit radiation more efficiently than water surfaces. Therefore, the air above the land will heat and expand more rapidly than the air over the water. A relative high pressure area will form aloft over the land, and a relative low pressure area will form over the water. The pressure gradient will force air movement toward the low pressure area, and a thermally driven circulation will form. The breeze that forms along the surface blowing in from the water (called an onshore breeze) brings in cool air. This is why, during mid-day at the beach, the air is often much cooler than it is just a few miles inland. This air is also very moist, and can form clouds and even storms where it rises over the low pressure area. This separation zone between the warm inland air and the cool sea breeze air is known as a sea breeze front. This front can bring significant precipitation under the right circumstances. For example, in Florida, sea breeze fronts move in from the west and from the east, then converge over central Florida. This convergence pushes more air upward, producing strong thunderstorms. At night, however, the opposite effect takes place, called the land breeze. Because the land also cools more rapidly than the water, a similar situation occurs late at night, but in the opposite direction. Here, the cooled air over the land contracts, forming a low pressure aloft over land and a relative high pressure aloft over the water. The resulting circulation is known as a land breeze, because the wind now blows offshore. Warmer Land. Cooler Water. Reverses at Night as Water Remains Warmer than Land to Make Land Breeze.")
32
Mesoscale Circulations Affecting Dispersion
1. Mountain/Valley Winds Day: Night: Warm Mtn Cool Mtn A similar pattern occurs along mountain slopes. The valley air warms rapidly and rises along the mountain slope to form the valley breeze. At night, the surface air quickly cools and slides down the mountain slope, forming the mountain breeze. Although this is due to the terrain of the mountains, it is, technically speaking, thermally driven. These, like the sea and lake breezes, are examples of mesoscale thermal circulations. 2. Urban/Heat Island (Night) PBL Top CITY
 PBL Top. CITY.")
33
Large Scale Circulation
Transboundary air pollution Acid deposition Ozone transport

34
Applications of Air Pollution Meteorology
Atmospheric Dispersion Modeling Study of Accidental Release of Hazardous Substances Including Radioactive Nuclides Applications of air quality meteorology can be used for dispersion modeling, i.e., predicting the path of the pollutant concentration and for calculations of ground sources, such as hazardous waste spills. Let’s first look at dispersion modeling. Applications of air quality meteorology can be used for dispersion modeling, ie, predicting the path of the pollutant concentration and for calculations of ground sources, such as hazardous waste spills. Let’s first look at dispersion modeling.

35
Air Pollution Meteorology
Meteorology very important factor in developing strategies for air pollution control State of the lower troposphere (PBL) plays large role in dispersion of pollutants and plumes: Mechanical Turbulence Buoyant Turbulence Circulation Conclusion/Remotivation: Okay, we have gone over the basis for air pollution by discussing some of the general concepts of air quality meteorology. We have discussed the effects of atmospheric conditions such as turbulence, planetary boundary layer, stability, and circulation and their effects on pollutant concentrations. In addition, we discussed the applications of air quality meteorology as it relates to BEEs. Again, this is the first lecture of air pollution and the rest of the lectures will involve emissions inventories, measurements, and air pollution control. If you would like further information on this subject, go to the following website:
 plays large role in dispersion of pollutants and plumes: Mechanical Turbulence. Buoyant Turbulence. Circulation. Conclusion/Remotivation: Okay, we have gone over the basis for air pollution by discussing some of the general concepts of air quality meteorology. We have discussed the effects of atmospheric conditions such as turbulence, planetary boundary layer, stability, and circulation and their effects on pollutant concentrations. In addition, we discussed the applications of air quality meteorology as it relates to BEEs. Again, this is the first lecture of air pollution and the rest of the lectures will involve emissions inventories, measurements, and air pollution control. If you would like further information on this subject, go to the following website:")
36
Wind Speed and Direction
The average ground level wind speed is about 4.5 m/s. “Calm” wind is less than 0.5m/s Wind speed almost always increases with height. ground friction slows lower level winds

37
A Wind Rose

38
A Wind Rose

39
Wind Speed With Height Deacon’s power law: u2 / u1 = (z2 / z1)p where:
u1 is the wind speed at elevation z1 u2 is the wind speed at elevation z2 and p is an exponent that depends on stability and ground characteristics Note: Wind speed measured by the NWS is usually obtained at z = 10 meters (z1)
")
41
Impact of Fixed Geographic Features
TERRAIN EFFECTS Sea breeze Valley wind Drainage wind Flow patterns due to topographical features

44
Temperature Gradient Air temperature is not uniform with altitude at a given location. Reasons: heating by the ground heating by the sun cloud cover evaporative cooling over the oceans expansion of gases due to air movement

46
Stability and Lapse Rate
The lapse rate determines how readily parcels of air move upward or downward. In stable atmospheres = vertical movement is opposed by the temperature gradient In unstable atmospheres = vertical movement is enhanced In neutral atmospheres = neither

47
Stability Classes A = very unstable B = moderately unstable
C = slightly unstable D = neutral E = slightly stable F = stable

48
Why is stability important?
Stability affects plume rise. Plume rise can be calculated using information about the stack gases and meteorology. Stability can effect the dispersion and appearance of plumes being emitted from stacks.

49
Inversions An inversion is a situation of increasing temperature with height. Pre-dawn mornings have an inversion that reached up to about 1000 ft (100m). Atmospheres within an inversion are extremely stable, with damped vertical mixing.
. Atmospheres within an inversion are extremely stable, with damped vertical mixing.")
50
Surface Temperature Inversions:
Are very common Are easy to recognize Affect the dispersal of very small spray droplets suspended in the air Do not increase the amount of off-site movement Can increase the potential for offsite affects & the distance at which affects can be observed

51
Atmospheric Stability
Indicator of atmospheric turbulence Depends on static stability, thermal and mechanical turbulence Unstable : Lapse rate > dry adiabatic lapse rate Neutral : Lapse rate = dry adiabatic lapse rate Stable : Lapse rate < dry adiabatic lapse rate Turner method: solar angle, cloud cover and wind speed

52
IMPORTANCE OF METEOROLOGY
Dispersion Transport Wind speed and direction Temperature Stability Mixing height

53
Any questions?

54
Thank you…

Similar presentations


 From the earth's surface to 11-12 km above, temperature decreases with.>")


 Boundary Layer is.>")


 order 6C/km in free atmosphere d - dry adiabatic.>")

: global sea breeze HOT COLD Explains: Intertropical Convergence Zone (ITCZ) Wet tropics, dry poles Problem: does not account.>")

