Download presentation
Presentation is loading. Please wait.

1
Open Source Analytics Visualization and Predictive Modeling of Big Data with R Michael E. Driscoll, Ph.D. July 22, 2009 OSCON

6
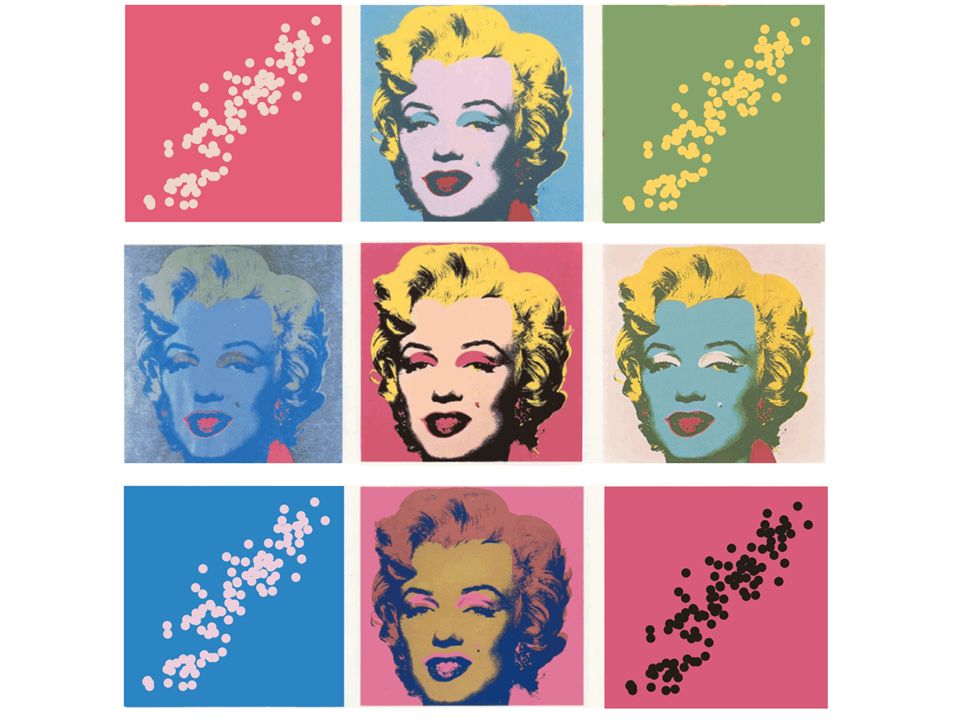
(from Jessica Hagys thisisindexed.com) Hard-working Middle Class Hypothesis
 Hard-working Middle Class Hypothesis")
7
gdp <- read.csv('gdp.csv') hours <- read.csv('hours.csv') gdp.hours <- merge(hours,gdp) gdp.hours$freetime <- 4380 - gdp.hours$hours attach(gdp.hours) plot(freetime ~ gdp) m <- lm (freetime ~ gdp,data=gdp.hours) abline(m,col=3,lw=2) pm <- loess(freetime ~ gdp) lines(spline(gdp,fitted(pm))) Munge & Model OECD Data
 hours <- read.csv( hours.csv ) gdp.hours <- merge(hours,gdp) gdp.hours$freetime < gdp.hours$hours attach(gdp.hours) plot(freetime ~ gdp) m <- lm (freetime ~ gdp,data=gdp.hours) abline(m,col=3,lw=2) pm <- loess(freetime ~ gdp) lines(spline(gdp,fitted(pm))) Munge & Model OECD Data")
8
Visualize the Analysis: is it True?

9
modeling Big Data

10
100 thousand gene measures

12
1 million transactions during this presentation

13
If You Liked ____, Youll Love ___ !

14
1 billion clicks during this presentation

16
1 million pitches thrown since 2007

17
A Tale of Two Pitchers Hamels Webb

18
xyplot(x ~ y, data=pitch)
")
19
xyplot(x ~ y, groups=type, data=pitch)
")
20
xyplot(x ~ y | type, data=pitch)
")
21
xyplot(x ~ y | type, data=pitch, fill.color = pitch$color, panel = function(x,y, fill.color, …, subscripts) { fill <- fill.color[subscripts] panel.xyplot(x,y, fill= fill, …) })
![xyplot(x ~ y | type, data=pitch, fill.color = pitch$color, panel = function(x,y, fill.color, …, subscripts) { fill <- fill.color[subscripts] panel.xyplot(x,y, fill= fill, …) })](http://images.slideplayer.com/1/234806/slides/slide_21.jpg "xyplot(x ~ y | type, data=pitch, fill.color = pitch$color, panel = function(x,y, fill.color, …, subscripts) { fill <- fill.color[subscripts] panel.xyplot(x,y, fill= fill, …) })")
22
xyplot(x ~ y | type, data=pitch, fill.color = pitch$color, panel = function(x,y, fill.color, …, subscripts) { fill <- fill.color[subscripts] panel.xyplot(x, y, fill= fill, …) })
![xyplot(x ~ y | type, data=pitch, fill.color = pitch$color, panel = function(x,y, fill.color, …, subscripts) { fill <- fill.color[subscripts] panel.xyplot(x, y, fill= fill, …) })](http://images.slideplayer.com/1/234806/slides/slide_22.jpg "xyplot(x ~ y | type, data=pitch, fill.color = pitch$color, panel = function(x,y, fill.color, …, subscripts) { fill <- fill.color[subscripts] panel.xyplot(x, y, fill= fill, …) })")
23
visualizing Big Data

25
ggplot2 = grammar of graphics

27
qplot(carat, price, data = diamonds)
")
28
qplot(log(carat), log(price), data = diamonds) qplot(carat, price, log=xy, data = diamonds) OR
, log(price), data = diamonds) qplot(carat, price, log=xy, data = diamonds) OR")
29
qplot(log(carat), log(price), data = diamonds, alpha = I(1/20))
, log(price), data = diamonds, alpha = I(1/20))")
30
qplot(log(carat), log(price), data = diamonds, alpha=I(1/20)) + facet_grid(. ~ color)
, log(price), data = diamonds, alpha=I(1/20)) + facet_grid(. ~ color)")
32
R on the cloud

33
Data Desktop

34
CodingClicking vs

35
Linux Apache MySQL R http://labs.dataspora.com/gameday

38
Final thoughts

Similar presentations


 Language learning Grammar Vocabulary Language skills Phonology.>")


 In accordance with.>")


