Download presentation
Presentation is loading. Please wait.

1
Danielle Scheurer, MD, MSCR Chief Quality Officer
Quality Improvement and Patient Safety: Part 1: What is a quality chasm and why do we care??? Part II: Making Mistakes; the why’s and what if’s Part III-IV: You and I Can Do QI Danielle Scheurer, MD, MSCR Chief Quality Officer

2
Learning objectives: Understand what quality and QI are
Understand why and how QI evolved Understand why QI is important MUSC and DOM QI structure

3
What is quality? Meeting the needs and exceeding the expectations of those we serve Delivering all and only the care that the patient and family needs

4
What is improvement? Reducing variation in care processes
Shifting and tightening of the bell curve A change in the design of care Ultimate goal is outcome improvement

5
Quality Improvement After Quality Quality Quality After Before
Improvement and standardization in processes reduces variation (narrows the curve) and raises quality of care for all (shifts entire curve toward better care). This radical change is what defines Quality Improvement. After After Before Quality Assurance Quality Bell Curve: Patient Population worse Quality better Tail Improvement (and standardization of process) reduces variation Quality Improvement better worse better Quality Quality worse Quality better
 and raises quality of care for all (shifts entire curve toward better care). This radical change is what defines Quality Improvement. After. After. Before. Quality Assurance. Quality. Bell Curve: Patient Population. worse. Quality. better. Tail. Improvement (and standardization of process) reduces variation. Quality Improvement. better. worse. better. Quality. Quality. worse. Quality. better.")
6
What put quality on the “front burner”
Libby Zion: 1984 Lewis Blackman: 2000 Josie King: 2001 Young Healthy Smart parents 97,999 low profile cases

7
What put quality on the “front burner”
To Err Is Human 1999 IOM Report 98,000 deaths in US hospitals a year due to preventable medical errors Due to “faulty systems, processes, and conditions that lead people to make mistakes” Crossing the quality chasm 2001 IOM report Defined 6 dimensions of healthcare quality Suggestions for improvement

8
Institute of Medicine Annual deaths in the US from:
Medical errors: 44,000 – 98,000 Motor vehicle accidents: 43,458 Breast cancer: ,297 AIDS: ,526

9
Institute of Medicine The American health system needs fundamental change “The nation’s health care system lacks… the capabilities to ensure that services are safe, effective, patient-centered, timely, efficient and equitable…Between the health care we have and the care we could have lies not just a gap but a chasm.”

10
Dimensions of Healthcare Quality
Safe: Avoid patient injuries from the care that is intended to help them Effective: Match care to science; avoid overuse of ineffective care and underuse of effective care Patient-centered: Honor the individual and respect choice Timely: Reduce waiting for both patients and providers Efficient: Reduce waste Equitable: Close racial and ethnic gaps

11
Quality Improvement: Bridges the Implementation Gap
Scientific understanding Progress Time Implementation Gap Patient care

12
Why is it important? Making mistakes: It happens
Transposition error rate (mixing drug doses) Commission error rate (misreading a label) Calculation error rate Omission error rate (failure to turn off a switch) Error rates under stress or danger .0006 .003 .03 .01 .25 Most serious medical errors are committed by competent caring people doing what other competent caring people would do….. Don Berwick
 Commission error rate (misreading a label) Calculation error rate. Omission error rate (failure to turn off a switch) Error rates under stress or danger Most serious medical errors are committed by competent caring people doing what other competent caring people would do….. Don Berwick.")
13
Why is QI important? Patients: Better care, fewer errors
Regulation and accreditation Reputation Financial Life long learning (ACGME and MOC) Academic activity Front-line clinicians Empowerment to change Jobs more rewarding Less daily frustration
 Academic activity. Front-line clinicians. Empowerment to change. Jobs more rewarding. Less daily frustration.")
14
Quality and the ACGME System based practice: Residents must demonstrate and awareness of and responsiveness to the larger context and system of health care, as well as the ability to call effectively on other resources in the system to provide optimal health care

15
System based practice: Expectations
Work effectively in various health care delivery settings and systems relevant to their clinical specialty Coordinate patient care within the health care system relevant to their clinical specialty Incorporate considerations of cost awareness and risk-benefit analysis in patient care and/or population- based care as appropriate Advocate for quality patient care and optimal patient care systems Work in interprofessional teams to enhance patient safety and improve patient care quality Participate in identifying system errors and in implementing potential systems solutions

16
Quality and the ACGME Practice based learning and improvement: Residents must demonstrate the ability to investigate and evaluate their care of patients, to appraise and assimilate scientific evidence, and to continuously improve patient care based on constant self-evaluation and life-long learning. Residents are expected to develop skills and habits to be able to meet the following goals:

17
Practice based learning and improvement
Identify strengths, deficiencies, and limits in one’s knowledge and expertise Let learning and improvement goals Identify and perform appropriate learning activities Systematically analyze practice, using quality improvement methods, and implement changes within the goal of practice improvement Incorporate formative evaluation feedback into daily practice Locate, appraise, and assimilate evidence from scientific studies related to their patients’ health problems Use information technology to optimize learning Participate in the education of patients, families, students, residents, and other health professionals

18
Quality in Life Long Learning
American Board of Internal Medicine “Maintenance of Certification” requires evidence of participation in quality / process improvement Subspecialty certification requires QI

19
Career No longer “soft science” Peer reviewed publications
Considered “translational research” Subject to IRB for dissemination

21
QI and ACGME Medicine Peds, Optho, Neuro, Derm, Radiology, Anesthesia
……

22
Resources Curriculum Early project development Data resources
Statistical help

23
PI Project at MUSC

24
Quality Improvement at MUSC
IMPROVE structure for QI Lean and Six Sigma management philosophies, along with strong leadership and willingness to innovate, to improve quality

25
Quality Philosophy: Lean
Management philosophy derived from Toyota Production System which focused on the elimination of waste Waste is anything that adds to a process without adding value “non-value added”

26
What is “Waste”: 8 types Waiting: Patients, doctors, staff
Overproduction: 3 admits in 20 minutes to the same person Rework: Medication reconciliation Motion: Looking for charts Processing: Several people doing the same steps to discharge a patient Intellect: Doing things “below your pay grade” Inventory: Wasted “stuff” laying around Transportation: Patients, materials

27
Quality Philosophy: Six Sigma
Management philosophy that seeks to reduce variation and defects by applying a highly structured, systematic approach to operational success Asthmatics should all get beta-agonists Sickle cells admits should all get IVF Initially developed by Motorola

28
IMPROVE Identify the problem Measure the impact Problem analysis
Remedy the critical issues Operationalize the solutions Validate the improvement Evaluate over time

29
Identify the problem What is the problem? Who identified it?
When was it identified? When and where is it occurring? Pick something that matters to you, and state WHY it matters (how does it fit into the domains of quality) Who else cares about the problem (who are the stakeholders?)
 Who else cares about the problem (who are the stakeholders )")
30
Measure the impact How is the data collected (survey, administrative data, chart review)? Is it valid/accurate? Is it a manual process or automated? Is there a clear definition of the outcome (or can it be interpreted different ways)? Who is going to measure? Can you sample?
 Who is going to measure Can you sample")
31
Problem Analysis: What is causing the problem?
Time of day, day of week Department specific / system wide Inefficient staffing (numbers or skill set) Poor communication Inadequate process or policy Lack of controls to keep the problem from occurring Poor individual performance (usually not the only issue) Pick an appropriate process analysis tool to further analyze the problem/process
 Poor communication. Inadequate process or policy. Lack of controls to keep the problem from occurring. Poor individual performance (usually not the only issue) Pick an appropriate process analysis tool to further analyze the problem/process.")
32
Remedy the critical issues
Pick a remedy based on the process analysis What will the group try to improve? What are the barriers? What evidence is there that it will have an impact (has someone tried and succeeded or failed)? How “reliable” is the intervention? Do you need more than one intervention to make it nearly impossible to recur?
 How reliable is the intervention Do you need more than one intervention to make it nearly impossible to recur")
33
Remedies (in order of reliability)
Education Reminders Checklists Order sets Protocols Pathways Templates “Hard stop” order entry

34
Operationalize How are you going to make it work?
How will the barriers be removed? What assistance is required from senior leadership? What is the plan to roll out and implement solutions?

35
Validate How will we know we made a difference?
What are you measuring? How often are you measuring it? Is the measure meaningful? Are you measuring “unintended consequences”?

36
Evaluate How to sustain the improvement?
Who is responsible for monitoring and measuring over time? What is the plan to react if the measures slip? How will future staff be made aware of the new process?

37
What is a Safety Culture?
Not focused individual blame Safe system to disclose (potential) issues without repercussion System approach to proactive error reduction Workers are involved in the work process and process re-design Workers are empowered to make change
 issues without repercussion. System approach to proactive error reduction. Workers are involved in the work process and process re-design. Workers are empowered to make change.")
38
How to create a safety culture
No blame problem analyses Anonymous safety reporting (eg PSN) Providing feedback to front line staff of events and reporting Frontline provider engagement in changing the system
 Providing feedback to front line staff of events and reporting. Frontline provider engagement in changing the system.")
39
Making mistakes The why’s and what if’s
Danielle Scheurer, MD, MSCR Chief Quality Officer

40
Learning objectives: Understand basic definitions in patient safety (errors, adverse events, negligence) Understand fundamentals of “safety culture” and “system approach” to safety Understand most common types of healthcare errors and how to mitigate Understand the role of disclosure, apology, and renumeration in safety events

41
What is an Error? Failure of a planned action to be completed as intended OR the use of a wrong plan to achieve an aim - To Err is Human, Institute of Medicine 2000

42
Types of errors: Latent
System defects that make active errors more likely to happen Ex: Poor design of IT data display making it easy for clinicians to misunderstand Nursing understanding of heparin protocols Inadequate staffing making people “rush” or routinely “multi-task” Difficult to measure; may exist for years before effect is seen

43
Types of errors: Active
Occur at the frontline provider level Usually easier to measure; negative outcome almost immediately apparent Nurse hangs the wrong medication Doctor orders medication intended for another patient PICC line inserted into the wrong patient Doctor amputates the wrong leg

44
Active versus latent errors
A “safety culture” system: Proactively looks for latent errors all the time Retroactively looks for latent errors when an active error has occurred

45
What is an Adverse Event?
An injury that is caused by medical management rather than the patient’s underlying condition Preventable adverse event = adverse event due to error

46
Errors Adverse Events Negligence Near Misses
Preventable Adverse Events Adverse Events

47
The points of intersection
Not all errors result in an adverse event (“near miss”) Ex: double dose lasix with no effect to the patient Not all adverse events are the result of an error Ex: hyperglycemia from steroids Of errors/adverse events that are preventable, only a small portion are due to “negligent” active error
 Ex: double dose lasix with no effect to the patient. Not all adverse events are the result of an error Ex: hyperglycemia from steroids. Of errors/adverse events that are preventable, only a small portion are due to negligent active error.")
48
Patient Safety Freedom from accidental injury
Involves the establishment of systems to decrease all errors, and intercepting them when they occur

49
What is a Safety Culture?
Not focused individual blame Safe system to disclose (potential) errors without repercussion System approach to proactive error reduction Workers are involved in the work process
 errors without repercussion. System approach to proactive error reduction. Workers are involved in the work process.")
50
How to create a safety culture
No blame M&M conferences or RCAs Simulating possible adverse events (eg FMEA) Anonymous safety reporting system (eg PSN) Providing feedback to front line staff of events and reporting
 Anonymous safety reporting system (eg PSN) Providing feedback to front line staff of events and reporting.")
51
System Approach to Error: Fundamentals
Analyze the system for contributing factors that allow errors to occur (majority of errors due to faulty systems) Individual blaming will not prevent future errors from occurring Individuals for the most part are trying to do their best; they do not come to work with the intent to harm
 Individual blaming will not prevent future errors from occurring. Individuals for the most part are trying to do their best; they do not come to work with the intent to harm.")
52
Making mistakes: It happens
Transposition error rate (mixing drug doses) Commission error rate (misreading a label) Calculation error rate Omission error rate (forget) Error rates under stress or danger .0006 .003 .03 .01 10X
 Commission error rate (misreading a label) Calculation error rate. Omission error rate (forget) Error rates under stress or danger X.")
53
A system approach “We cannot change the human condition, but we can change the conditions under which humans work” Reason; BMJ 2000;320:

54
Human Factors Engineering
“The study of the interrelationships between humans, the tools they use and the environment in which they live and work”

56
Factors that contribute to error
Environment: Distractions, interruptions, noise, ergonomics, clutter, lighting Forgot to enter order due to multiple pages/competing priorities Lost handwritten sign out sheet and forgot to check a lab Discharge paperwork incomplete due to inability to find all needed papers

57
Factors that contribute to error
Human: Stress, fatigue, emotions (boredom, frustration) communications Feel asleep and did not check a lab Failure to clarify sign out questions due to discomfort with confrontation Transcription error in filling out discharge med list due to stress or fatigue
 communications. Feel asleep and did not check a lab. Failure to clarify sign out questions due to discomfort with confrontation. Transcription error in filling out discharge med list due to stress or fatigue.")
58
Factors that contribute to error
Patient: language, compliance, fear, disease acuity, knowledge deficit Patient neglects to mention a pertinent review of symptoms due to fear or embarrassment of what it would mean Patient neglects to take meds correctly due to finances, lack of understanding, low literacy Patient does not understand instructions due to language barrier

59
Factors that contribute to error
Equipment: design, variability, quality, labeling, training, availability Patient gets wrong heparin dose due to poor nurse training on how to program smart pump, multiple heparin doses in drug library, or no availability of a pump Patient gets wrong chemotherapy dose due to confusing labeling during packaging Hand hygiene does not occur due to unavailability of purell/soap

60
Factors that contribute to error
Systems: staff level, staff experience, supervision, handoffs, workflow CLA-BSI occurs due to low staffing and single provider putting in line without checklist or help with sterile procedure Med rec not completed because it is out of workflow (does not connect to CPOE or inpatient documentation) Patient not seen upon transfer out of ICU due to inadequate communication from ICU to floor team
 Patient not seen upon transfer out of ICU due to inadequate communication from ICU to floor team.")
61
Layers of defense to reduce errors

62
Most common types of errors in healthcare
Medication errors Procedural errors Communication errors Diagnostic errors

63
Medication Errors ADE: pADE: Near miss: Caught before given
Increases LOS by 8-12 days Increases cost $16,000 to $24,000 Most commonly due to wrong dose (not time, route, drug, or allergy errors) pADE: Most commonly occurs at physician ordering stage (not administration or dispensing) Near miss: Caught before given
 pADE: Most commonly occurs at physician ordering stage (not administration or dispensing) Near miss: Caught before given.")
64
Mitigating Medication Errors
Order stage: CPOE with decision aids for dose, route, interval, indication Prep stage: Double check with pharmacy for drug/dose appropriateness Remove open floor stocks of high risk medications (heparin, insulin)
")
65
Mitigating Medication Errors
Administration stage: Bar coding to match patient with medication dose, time, and route Teach back technique with the patient/family during medication administration

66
Procedural errors Wrong patient Wrong site Wrong/Bad equipment

67
Mitigating procedural errors
Procedural “time- out” with checklists Team training Culture of safety with frontline empowerment Teach back technique with the patient for procedural marking (prior to sedation)
")
68
Mitigating procedural errors
Procedural simulation training Consistent equipment stocking

69
Communication errors Illegible handwriting Inadequate handoffs
Poor or no communication among or between teams Poor, no, or inappropriate communication to the patients

70
Mitigating communication errors
Template EMR documentation Multi-disciplinary team training and rounding Standardize template, time, and place for handoffs (without noise, distraction)
")
71
Mitigating communication errors
Use read back techniques for critical information Use SBAR technique (or other) to communicate new patient findings
 to communicate new patient findings.")
72
Diagnostic errors Delayed or missed diagnosis which affects patient outcome or leads to additional complications / procedures Account for about 1/3 of errors Associated with proportionally higher morbidity than other errors Can be due to heuristics, most commonly Pattern recognition Algorithmic thinking

73
Pattern recognition: What do you see?
You use pattern recognition to make decisions all the time…not the 7 steps above

74
Pattern Recognition: A heuristic (shortcut)
You see it, you know it Relies on experience Requires a well defined prototype Is quick and “easy” and used commonly Prone to representative error and premature closure

75
Algorithmic Thinking SIADH Solute loss (eg vomiting)
Hyponatremia Hypovolemic Normovolemic Hypervolemic Algorithmic thinking is often oversimplistics. Both this and pattern recognition are heuristics. SIADH Solute loss (eg vomiting) Cirrhosis, CHF, nephrotic syndrome
 Cirrhosis, CHF, nephrotic syndrome.")
76
Avoiding diagnostic error
Slow down Take a diagnostic time out Always make a differential diagnosis Ask what does not fit, and could it be more than one diagnosis

77
Avoiding diagnostic error
Always consider the worst it could be Focus on the history and physical exam Listen to the patient Reduce reliance on testing

78
Avoiding diagnostic errors
Understand Bayesian theory Use a mathematical approach to decision making Use pre and post-test probability to know the value of diagnostic testing

79
Avoiding diagnostic errors
Acknowledge how the patient makes you feel Emotions (good and bad) can affect how you test and treat the patient
 can affect how you test and treat the patient.")
80
Medical negligence Failure to meet the standard of practice of an average qualified physician practicing the specialty in question Physician practicing in a system not grossly “latent error prone” that breaches standard practice

81
Disclosure: part of patient safety
Errors and near misses have to be transparent To providers To patients To the system Disclosure with compensation reduces claims, lawsuits, and legal costs Kachalia A. Ann Intern Med 2010;153:213.

82
What physician think

83
What Patients Want Jargon-free statement that error occurred
Description of the error Why it happened Implications of the error for their health and how to deal with the consequences 7. Gallagher TH, Waterman AD, Ebers AG, Fraser VJ, Levinson W. Patients' and physicians' attitudes regarding the disclosure of medical errors. JAMA. 2003;289: Gallagher TH, et al. JAMA. 2003:289:

84
What Patients Want Outline of steps that will be taken to prevent future errors An apology from the health care worker 7. Gallagher TH, Waterman AD, Ebers AG, Fraser VJ, Levinson W. Patients' and physicians' attitudes regarding the disclosure of medical errors. JAMA. 2003;289: Gallagher TH, et al. JAMA. 2003:289:

85
Why an apology?

86
Barriers to Disclosure for Physicians
Fear of litigation Unlikely to apologize due to concern about consequences of admitting fault Discomfort with discussing such issues Physician may choose words carefully to avoid explicitly stating that an error occurred Concern that information may harm patient Belief that disclosure may impact patient’s trust in the physician 7. Gallagher TH, Waterman AD, Ebers AG, Fraser VJ, Levinson W. Patients' and physicians' attitudes regarding the disclosure of medical errors. JAMA. 2003;289: 8. Robinson AR, Hohmann KB, Rifkin JI, et al. Physician and public opinions on quality of health care and the problem of medical errors. Arch Intern Med. 2002;162: 9. Wu AW, Folkman S, McPhee SJ, Lo B. Do house officers learn from their mistakes? JAMA. 1991;265: Gallagher TH, et al. JAMA. 2003:289:1001-7; Robinson AR, et al. Arch Intern Med. 2002:162: ; Wu AW, et al. JAMA. 1991;265:

87
Errors happen: 3 part plan
RECOGNIZE the mistake MITIGATE harm associated with error DISCLOSE the error

88
MUSC approach to apology: DO
Take care of the patient Call Risk management Call your attending Be open and honest

89
Disclosure process: If there is a change in plan of care: Attending must disclose If there is not a change in plan of care: Attending must be informed, but resident can disclose Always call risk management first

90
How to disclose Apologize
DO DO NOT Apologize Explain outcome, current condition, treatments Provide support and empathy Offer family meeting Be accessible Give contact info Use terms negligence or accident Blame or discuss fault Admit or speculate about liability Discuss peer review or root cause analysis

91
How to document Objective clinical information Medical response
DO NOT Objective clinical information Medical response Follow up plans If late entry, mark “late entry” with date of time of event and entry Alter prior documentation Mention risk management, occurrence reporting, sentinel event

92
Steps for Risk Patient follow up plan after analysis of what happened
Financial plan Attending follow up

95
Quality Improvement: Part 3-4 You and I Can do QI Project Design and Publication
Danielle Scheurer, MD, MSCR, SFHM Medical Director of Quality Medical University of South Carolina

96
Learning objectives: Understand the fundamentals of forming a team and team meetings Give an example of a goal and an aim Give examples of types of measurement Identify some ways to evaluate a process Understand benefits of PDSA

97
Team Members Champion: Respected, able to surmount barriers, external voice of the project (mentor, attending)
")
98
Team Members Team Facilitator: QI expert, helps with design and operations (optional but nice) Process owner: Schedules meetings, sets the agenda, records activity, reports findings. “Owns” the success of the project.

99
Team Meetings All members and opinions are equal
Team members will speak freely and in turn, no side bar conversations, one at a time Cells phones and pagers on silent alert Discuss/analyze/attack problems, not people Everyone gets their homework done Silence (or absence) equals agreement Meetings start / end on time Get creative on meeting times, use conference calling
 equals agreement. Meetings start / end on time. Get creative on meeting times, use conference calling.")
100
IMPROVE Identify the problem Measure the problem Problem analysis
Remedy the critical issues Operationalize the solutions Validate the improvement Evaluate over time

101
Identify the problem What is the problem? Who identified it?
When was it identified? When and where is it occurring? Pick something that matters to you, and state WHY it matters (how does it fit into the domains of quality) Who else cares about the problem (who are the stakeholders?)
 Who else cares about the problem (who are the stakeholders )")
102
Measure How to get data Is it valid/accurate?
(survey, administrative data, chart review)? Is it valid/accurate? Is it a manual process or automated? Is there a clear definition of the outcome (or can it be interpreted different ways)? Who is going to measure? Can you sample?
 Is it valid/accurate Is it a manual process or automated Is there a clear definition of the outcome (or can it be interpreted different ways) Who is going to measure Can you sample")
103
Problem Analysis: What is causing the problem?
Time of day, day of week Department specific / system wide Inefficient staffing (numbers or skill set) Poor communication Inadequate process or policy Lack of controls to keep the problem from occurring Poor individual performance (usually not the only issue) Pick an appropriate process analysis tool to further analyze the problem/process
 Poor communication. Inadequate process or policy. Lack of controls to keep the problem from occurring. Poor individual performance (usually not the only issue) Pick an appropriate process analysis tool to further analyze the problem/process.")
104
Set Goal Goals are general statements of what you are trying to achieve Reduce CA-UTI

105
Set Aims Aims are SMART Specific: Reduce CA-UTI on 8E
Measurable: Current 8/1000 catheter days Achievable: Reduce to 5/1000 catheter days Realistic: Depends on HOW to achieve it Time delimited: In 6 months

106
Examples of Aims > 75% of CHF patients on 8E will be discharged with instructions within 6 mo Decrease all cause mortality rates in COPD from 10% to 5% by Jan 2012 Reduce unplanned extubations by 50% within 3 months of intervention

107
Types of Measurement Process measures: The process of delivering care
HbA1c for diabetics Completion of an order set for asthmatics Outcome measures: The actual end point Death Readmission rates Balancing measures: What are the other (sometimes adverse or unintended) consequences of our intervention Time to complete work Longer length of stay
 consequences of our intervention. Time to complete work. Longer length of stay.")
108
Measurement: How will we know that a change is an improvement?
Pick measures that are related to aims Develop operational definitions Determine patient eligibility, denominator, numerator Keep measures simple and practical

109
Examples of Measures Mean time from initiation of discharge process to patient walking into elevator (in minutes) [Process measure] % PNA patients readmitted with 30 days [Outcome measure] PNA length of stay [balancing measure]

110
Principles of measurement
Seek usefulness, not perfection (your goal is improvement, not measurement) Integrate measurement into the daily routine (instead of waiting 2 months for administrative data) Use qualitative and quantitative data (ask nurses how it is going?) Use sampling (make your measurement easy, not hard) Plot data over time (to observe trends and patterns) Use balancing measures (measure anticipated unintended consequences, such as time or cost) Measure both process and outcome measures (% use of a discharge order set, and % discharged on intended medication)
 Integrate measurement into the daily routine (instead of waiting 2 months for administrative data) Use qualitative and quantitative data (ask nurses how it is going ) Use sampling (make your measurement easy, not hard) Plot data over time (to observe trends and patterns) Use balancing measures (measure anticipated unintended consequences, such as time or cost) Measure both process and outcome measures (% use of a discharge order set, and % discharged on intended medication)")
111
Measuring processes: Basic 2 types of data analysis tools
Cause and effect diagrams Process maps Swim Lane Maps Decision flow diagrams Spaghetti diagrams Cycle time charts Basic 2 types of data analysis tools Pareto chart Run chart

112
Process evaluation: Processes are complicated, involving multiple steps and decision branch points If a process is flawed, inefficient, or resulting in an undesirable outcome, the process should be systematically evaluated How to evaluate a process: Cause and effect diagrams Process map Swim Lane map Decision Flow Diagram Spaghetti diagrams Cycle time charts

113
Cause and Effect Diagram Fishbone “Ishikawa” diagram
Graphically displays possible factors leading to an event or process Used to organize ideas during brainstorming sessions Helps to logically and systematically evaluate a process, and decide which steps are flawed, inefficient, or need repair

114
Example: Adverse Drug Events (ADE)
Cause-and-Effect Diagram Example: Adverse Drug Events (ADE) Drug Administration Errors Ordering Errors Nurse Physician Physician Pharmacy Pharmacist Nurse/Clerk Rate Transcribing Dilution Spelling Place outcome here Dosage Route Time Route Nurse Scheduling Order Missed Wrong Drug Dose ADE Age Unforeseen Weight Psychiatric Gender Drug/Drug Expected Renal Cognitive Electrolyte Drug/Food Pharmacokinetics Past Allergic Reaction Compliance Hepatic Drug/Lab Absorption Pharmacodyamics Race Patient Errors Physiologic Factors Pharmocologic Factors Pharmacist Patient Patient Physician Dietician
 Drug Administration. Errors. Ordering Errors. Nurse. Physician. Physician. Pharmacy. Pharmacist. Nurse/Clerk. Rate. Transcribing. Dilution. Spelling. Place outcome here. Dosage. Route. Time. Route. Nurse. Scheduling. Order Missed. Wrong Drug. Dose. ADE. Age. Unforeseen. Weight. Psychiatric. Gender. Drug/Drug. Expected. Renal. Cognitive. Electrolyte. Drug/Food. Pharmacokinetics. Past Allergic Reaction. Compliance. Hepatic. Drug/Lab. Absorption. Pharmacodyamics. Race. Patient Errors. Physiologic. Factors. Pharmocologic. Factors. Pharmacist. Patient. Patient. Physician. Dietician.")
115
“Macro” Process Map Displays the number of steps needed to successfully implement a process Graphically displays the “current state” at a “high level” Each step is displayed, which can later be broken down into smaller steps “micro level” The process, and each point, can be further investigated based on where the failures are occurring

116
Macro Process Map Patient needs a procedure INR checked and elevated
FFP ordered and given

117
Swim Lane Map Shows simultaneous workflows of different disciplines
Can see the interaction of disciplines Helps to facilitate better communication among disciplines in complicated processes

119
Decision Flow Diagram Displays the steps of a process with decision branch points Creates transparency of a process regardless of complexity Can identify areas of improvement How the process is supposed to work How the process is actually working Variability in the process Circle (input/output), diamond (decision branch), square (task to do)
, diamond (decision branch), square (task to do)")
120
Decision Flow Diagram Lamp not working Stop Y Plugged in? N Plug it in
Bulb burned out? Y Put in new bulb Working? Y N Buy new lamp Stop

122
Spaghetti diagram Graphically displays motion (and usually waste) of a process (or set of processes) Can be effective for using before-after an intervention, although less “rigorous” an outcome measure Can be used in conjunction with time motion studies, pedometer readings, etc

123
Outpatient clinic

124
Cycle times Graphic depiction of what processes are occurring, in what order, and how long each “batch” is taking Anytime the “batch” times are uneven, there is waste built in the process Efficient processes have “load balancing” Can be used to identify waste within a process, then used to design a solution, which can be re-measured

125
ED process: cycle times

126
Get more granular; see if you can load balance work

127
Once you have collected data: Data Analysis
Data can be displayed (and analyzed) in a number of ways, the most common (and simple) of which are: Pareto Chart (Bar graph) Run Chart
 in a number of ways, the most common (and simple) of which are: Pareto Chart (Bar graph) Run Chart.")
128
Pareto Chart (Bar graph)
Graphically displays relative frequency of events Used to focus choices, by designating the weight of each category Can help teams prioritize which processes to focus on first Based on this graphic depiction of the causes of an adverse event, might focus on the top 3 contributing causes first

129
Pareto Chart Causes Causes Contributing to Adverse Drug Events
10 20 30 40 50 60 70 80 90 100 Causes % Contributing Causes

130
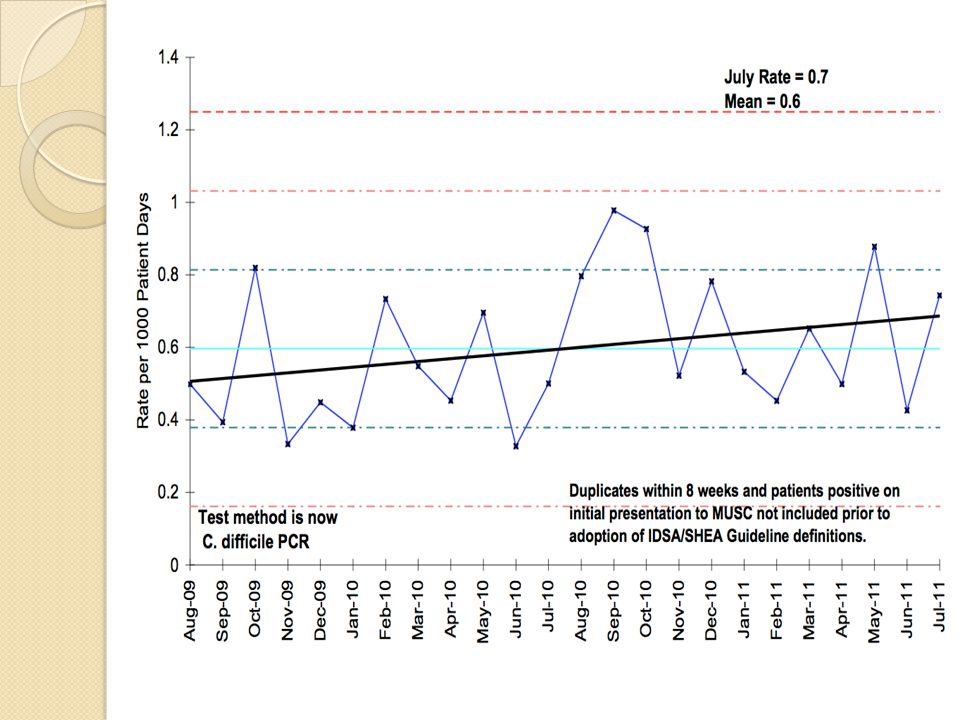
Run Charts Graphically displays information over time
The horizontal axis usually has a mean performance The vertical axis has interventions placed to determine if the interventions are affecting the outcome

131
Run Chart

132
Now it is time to implement the change
Start on a small scale (a clinic, a unit, a doctor) Improve incrementally Learn through action Test your changes Assess their effect Re-work the changes and do it again and again and again… PDSA cycles: PLAN, DO, STUDY, ACT
 Improve incrementally. Learn through action. Test your changes. Assess their effect. Re-work the changes and do it again and again and again… PDSA cycles: PLAN, DO, STUDY, ACT.")
133
Value of PDSA cycles Allows “failures” without impacting large scale performance (“fail fast”) Adapts to changing environments Evaluates costs and unintended consequences of the change Empowers front line users to experience the change on a small scale Minimizes resistance for larger implementation

134
Bottom line with PDSA Common sense approach to change and improvement
It is not complicated Manageable big ideas tested on a small scale Cycles happen quickly allows for successive cycles and sustainable change Guides the test of a change to determine if the change is an improvement

135
Changes that result in Improvement
D A P S D A P What happens is that the hunches, ideas, and theories that you started out with roll out over time to become changes that result in sustainable improvement as shown in this slide. S D A P S D Big Idea Time Source: D. Berwick

136
IMPROVE: Next week Identify the problem Measure the impact
Problem analysis Remedy the critical issues Operationalize the solutions Validate the improvement Evaluate over time

137
Remedy the critical issues
Pick a remedy based on the process analysis What will the group try to improve? What are the barriers? What evidence is there that it will have an impact (has someone tried and succeeded or failed)? How “reliable” is the intervention? Do you need more than one intervention to make it nearly impossible to recur?
 How reliable is the intervention Do you need more than one intervention to make it nearly impossible to recur")
138
Operationalize How are you going to make it work?
How will the barriers be removed? What assistance is required from senior leadership? What is the plan to roll out and implement solutions?

139
Validate How will we know we made a difference?
What are you measuring? How often are you measuring it? Is the measure meaningful? Are you measuring “unintended consequences”?

140
Evaluate How to sustain the improvement?
Who will monitor / measure over time? What is the plan if the measures slip? How will future staff be made aware of the new process?

141
Remedies At least one needs to be “highly reliable”
Usually need several to be effective and sustainable Admission / Discharge orders Order entry “hard stops” Decision aids / Protocols Educational material Pre-populated documentation in EMR Standing orders / Default pathways

142
Remedies (in order of reliability)
Education Reminders Checklists Order sets Protocols Pathways Templates “Hard stop” order entry

143
What is “Reliability” Failure free operation over time
You get the results you intended to get Inverse of the system’s failure rate

144
Making Systems Safer: Way to Redesign Systems
Elimination Standardization Constraints and forcing functions Redundancy Differentiation Confirmation Simplification Reminders Detection Mitigation User-centered design

145
Organizational Reliability
Aviation and nuclear power: Failure rate is 1 in 1,000,000 (“Six Sigma”) Medical processes: we routinely “fail” Hand hygiene: 8 in 10 Patient understanding of medication: 1 in 3 VTE prophylaxis in inpatients: 9 in 10
 Medical processes: we routinely fail Hand hygiene: 8 in 10. Patient understanding of medication: 1 in 3. VTE prophylaxis in inpatients: 9 in 10.")
146
What is “High Reliability”
High reliability system Known to be complex and dangerous, but safe with infrequent error rates Has a preoccupation with failure Defers decisions to expertise (not seniority) Routinely (and proactively) evaluates what could go wrong, instead of what did go wrong Seeks to standardize processes; doing the “right” thing is easier than doing the “wrong” thing DOES NOT rely on vigilance or memory alone
 Routinely (and proactively) evaluates what could go wrong, instead of what did go wrong. Seeks to standardize processes; doing the right thing is easier than doing the wrong thing. DOES NOT rely on vigilance or memory alone.")
147
Not Highly Reliable

148
Highly Reliable

149
Why do we care? Ways to think about designing interventions that will be EFFECTIVE SUSTAINABLE

150
Elimination Eliminate some choices on purpose
Reduce # procedural trays available Combine with simulation to ensure understanding and competency Reduce # medications available Combine with CPOE and formulary aids

151
Elimination Remove high risk medications from floor stock (concentrated KCl, insulin vials) Do not allow verbal orders Remove razors from all procedural areas

152
Standardization Prescription writing
0.1 mg but not 1.0 mg Approved abbreviations only (no “QD”) Spell out units: “micrograms”, not “µg” Metric units only (kg, cm, Celsius) Standardize all thermometers, bed weight, order sets, patient instructions
 Spell out units: micrograms , not µg Metric units only (kg, cm, Celsius) Standardize all thermometers, bed weight, order sets, patient instructions.")
153
Standardization Standardize equipment Standardize documentation Pumps
Ventilators Keyboard Standardize documentation Flow sheets Progress notes Discharge summaries

154
5S Standardization Workplace organization methodology
Sort: Keep essential items, discard others Straighten: Everything has it’s place Sweep/Shine: Visual cue for mess Standardize: All units identical Sustain: Avoid entropy Creates safer environments

156
Constraints / Forcing Functions
CPOE Orders with pre-printed boxes checked Metric system for orders Scan armband to allow medication release Not allowing blood release from blood bank until 2 blood types verified

157
Redundancy 2 nurse verification for chemotherapy
Pharmacist verifies admission medications from physician medication history Pharmacist “signs off” on all new medication orders

158
Redundancy 2 patient identifiers before blood drawn
Critical lab read back technique Patient weight on every order page Team contacted twice for ICU transfers

159
Differentiation

160
Confirmation Allowing for question time during sign out
Read-back of verbal orders “I’m clear, you’re clear, we are all clear” during codes Procedural time out

161
Simplification 1-2 medications from each category available for ordering (ACE, BB) Reduce number of places information is stored (vitals signs, allergies) Universal influenza vaccination for all inpatients
 Universal influenza vaccination for all inpatients.")
162
Simplification Make things predictable and easy to find (oxygen tubing, a central line kit, LP tray) Have central line kits with only necessary equipment included Reduce med rec from a 2 to a 1 step process

163
Reminders: Avoid relying on memory
Checklists: first developed in mid 1930’s by the Army Air Corps in response to increasing complexity of flying an airplane. Resulted in the adoption of the B-17, which helped to turn the course of WWII Adopted as a way to reduce central line associated infections, VAP, wrong site surgery, etc, etc, etc

164
Detection Create a system so that errors are detectable in real time
Bar coding / scanning meds, makes it easy to recognize you are about to give the wrong med to the wrong patient

165
Detection Hard stop in CPOE for allergy and drug interactions
Sponge count at the end of surgeries Xrays at the end of all trauma cases

166
Mitigation When something goes wrong, make the impact as innocuous as possible Standard reporting for events Immediate RCA to reduce harm associated with error and recurrence Give medication antidote if available

167
User-centered designs
Creating a work space that enables us To make safe and sound decisions To implement those decisions into a seamless care plan

168
Not user centered

174
QI/PS Resources IHI (http://www.ihi.org/IHI/Topics/PatientSafety)
AHRQ ( AHRQ 2009 quality report ( JC ( NPSF ( CDC ( IOM ( SHM ( HRSA ( SQUIRE guidelines/resources ( AHA HRET ( American Society of Quality ( tools/overview/overview.html) QI/PS Journals International Journal for Quality in Health Care International Journal of health care quality assurance Joint Commission journal on quality and patient safety Journal of health care quality
 QI/PS Journals. International Journal for Quality in Health Care. International Journal of health care quality assurance. Joint Commission journal on quality and patient safety. Journal of health care quality.")
175
Enhanced Reading Davidoff F, Batalden P, Stevens D, Ogrinc G, Mooney S for the SQUIRE development group. Publication guidelines for quality improvement studies in health care: evolution of the SQUIRE project. JGIM 2008;23:2125. Nolan and Berwick. All-or-none measurement raises the bar on performance. JAMA 2006;295:1168.

176
Enhanced Reading ovementMethods/HowToImprove es/1999/To-Err-is- Human/To%20Err%20is%20Human% %20%20report%20brief.pdf IHI open school QI 101: Fundamentals of improvement PS 101: Introduction to patient safety

177
Writing an abstract for a scientific meeting:

178
Learning objectives Recognize the differences between abstracts for manuscripts and for meetings Compare Traditional vs QI abstracts Understand key steps in writing a good abstract Identify specific strengths & common problems in abstracts submitted for presentation at scientific meetings.

179
Outline Why write a great abstract? Review the anatomy of an abstract
Review common errors in abstract writing Small groups to critique previously presented abstracts Large groups to discuss findings and address specific comments

180
Why Write “Abstracts for Scientific Meetings”
Chaotic ideas find form and substance through drafting Promotes original thought Sets goals for project completion

181
The Project Life Cycle Project Idea
Preliminary Data Abstract for Scientific Meeting Peer-Reviewed Publication Advance Science Obtain Funding and Career Advancement

182
Purpose of an Abstract for a Scientific Meeting
Flash compared to detail Limit data presented but also present most important data What data supports your conclusions directly?

183
Guidelines for Abstract Writing

184
Title Concise Direct No abbreviations

185
Introduction Why this study?
Concisely state the goals and rationale (i.e., describe why the work was done in 1 or 2 sentences) 10% to 15% of total length
 10% to 15% of total length.")
186
Methods What was done? 30% to 35% of total length
Describe the population studied, techniques used, and how the data were analyzed Definitions 30% to 35% of total length

187
Results What was found? Summarize only the important findings Tables & graphs can be used in abstracts written for meetings as a means to emphasize the results A table or graph is not a substitute for results but rather a means by which to efficiency display the results 35% to 40% of total length

188
Discussion The Answer!! 10% to 20% of total length
Most important things learned OK to state implications of findings but don’t extrapolate too much Keep conclusions within scope of data investigated 10% to 20% of total length

189
QI vs. Traditional Manuscripts
Completely defined process Generalizability Methods section Describe design Details about all of process Results section Present summary measures Adjust for variability Tables and Figures Discuss: Interpret data and describe impact QI Manuscript Evolving process Local context Methods section Describe context/personnel Detail about initial process Results section Describe process changes Show all the data/variability “Run” and SPC charts Discuss: implications of outcome data and changes in process Davidoff F, Batalden P, Qual Saf Health Care 2005

190
The Writing Process: Drafts
Create an outline or free-writing under headings A first draft will likely be disappointing You can’t revise until you’ve written

191
The Writing Process: Drafts
Obtain feedback from peers Encourage them to provide an honest and constructive critique “I want this to be a good abstract so please don’t worry about me being offended” More is better Solicit feedback from multiple people from diverse disciplines Different reviewers focus on different areas & content (e.g., research design, statistical analysis, or writing style)
")
192
The Writing Process: Drafts
Provide feedback to peers when asked Participate in group feedback sessions- you get to hear a variety of viewpoints The more abstracts you review, the easier it is to write your own

193
Writing Styles & Hints No jargon
Only use standard, well-accepted abbreviations and symbols Shorter is better, always I have made this letter longer than usual because I lack the time to make it shorter (Blaise Pascal, Provincial Letters, XVI. 1657)
")
194
Common Problems Lack of sentence clarity (i.e., the message is not clear) Question omitted Question vaguely stated Answer is not stated (only implications stated)
")
195
Common Problems Poor organization No clear ordering of sections
Mixing content (e.g., giving results in the methods section)
")
196
Common Problems Lack of coherence Too many abbreviations
Use of “respectively” Cure was achieved in patients with aa, bb, cc, dd, and ee in 0.5%, 0.5%, 0.6%, 0.7%, and 0.8%, respectively Better to use a table

197
Common Problems Excessive detail Reporting data for minor results
Providing details for well-known techniques Providing exact data rather than odds ratio or percent change Duplicating data Including references

198
Common Problems Failure to consider non-specialist readers
Underdeveloped rationale Overly technical language

199
Common Problems Make sure the entire abstract develops and concludes the main point YOU want to express Abstracts evolve as you write them Critically review the introduction statements after finishing conclusions

200
The Project Life Cycle Project Idea
Preliminary Data Abstract for Scientific Meeting Peer-Reviewed Publication Advance Science Obtain Funding and Career Advancement

201
Publication Rate Carroll AE, et al. Pediatrics 2003;112:

202
It Takes Time, Be persistent
Carroll AE, et al. Pediatrics 2003;112:

Similar presentations