Download presentation
Presentation is loading. Please wait.

1
Data Analysis 33 The amount of Omega 3 fish oil in capsules labeled 1,000 mg is measured for four manufacturers’ products yielding the following box plots.

2
Which of the manufacturers samples have the smallest range?
A. A B. B C. C D. D E. There is insufficient information to answer this question.

4
Data Analysis 34 A random sample of golf scores gives the following summary statistics: n = 20, x = 84.5, Sx = 11.5, minX = 68, Q1 = 78, Med = 86, Q3 = 91, maxX = 112. What can be said about the number of outliers? A B. 1 C. 2 D. At least 1 E. At least 2

6
Data Analysis 35 Which of the following statements are true?
I. Two students working with the same set of data may come up with histograms that look different. II. Displaying outliers is less problematic when using histograms than when using stemplots. III. Histograms are more widely used than stemplots or dotplots because histograms display the values of individual observations. A. I only B. II only C. III only D. I and II E. II and III

8
Data Analysis 36 Consider the following three scatter plots.

9
Which has the greatest correlation coefficient r ?
A. I B. II C. III D. They all the same correlation coefficient E. The question cannot be answered without additional information.

11
Data Analysis 37 A simple random sample of 25 world-ranked tennis players provides the following statistics: number of hours of practice per day x-bar = 7.3, sx = 1.2, yearly winnings y-bar = $1,820,000, sy = $310,000, Correlation r = 0.23. Based on this data, what is the resulting linear regression equation? A. Winnings = 1,390, ,400 hours B. Winnings = 1,300, ,300 hours C. Winnings = -63, ,000 hours D. Winnings = -443, ,000 hours E. Winnings = -10,000, ,620,000 hours

13
Data Analysis 38 Given this back-to-back stemplot, which of the statements on the following slide are true?

14
I. The distributions have the same mean.
II. The distributions have the same range. III. The distributions have the same variance. A. II only B. I and II C. I and III D. II and III E. I, II, and III

16
Data Analysis 39 Using the most commonly accepted definition of outliers, a set has five outliers. If every value of the set is increased by 20%, how many outliers will there now be? A. Fewer than 5 B. 5 C. 6 D. More than 6 E. It is impossible to determine without further information.

18
Data Analysis 40 Which of the following statements about the correlation r are true? I. When r = 0, there is no relationship between the variables. II. When r = 0.2, 20% of the variables are closely related. III. When r = 1, there is a perfect cause-and-effect relationship between the variables. A. I only B. II only C. III only D. I, II, and III E. All the statements are false.

20
Data Analysis 41 Given the histogram below, and using the most commonly accepted definition of outliers, what values would be considered outliers? (Answers on next slide)
")
21
A. Between 115 and 120 B. Between 110 and 120. C. Between 50 and 55, or between 115 and 120. D. Between 50 and 55, or between 110 and 120. E. There are no outliers.

23
Data Analysis 42 Suppose a study finds that the correlation coefficient relating job satisfaction to salary is r = +1. Which of the following are proper conclusions? I. High salary causes high job satisfaction. II. Low salary causes low job satisfaction. III. There is a very strong association between salary and job satisfaction. A. I only B. II only C. III only D. I and II E. I, II, and III

25
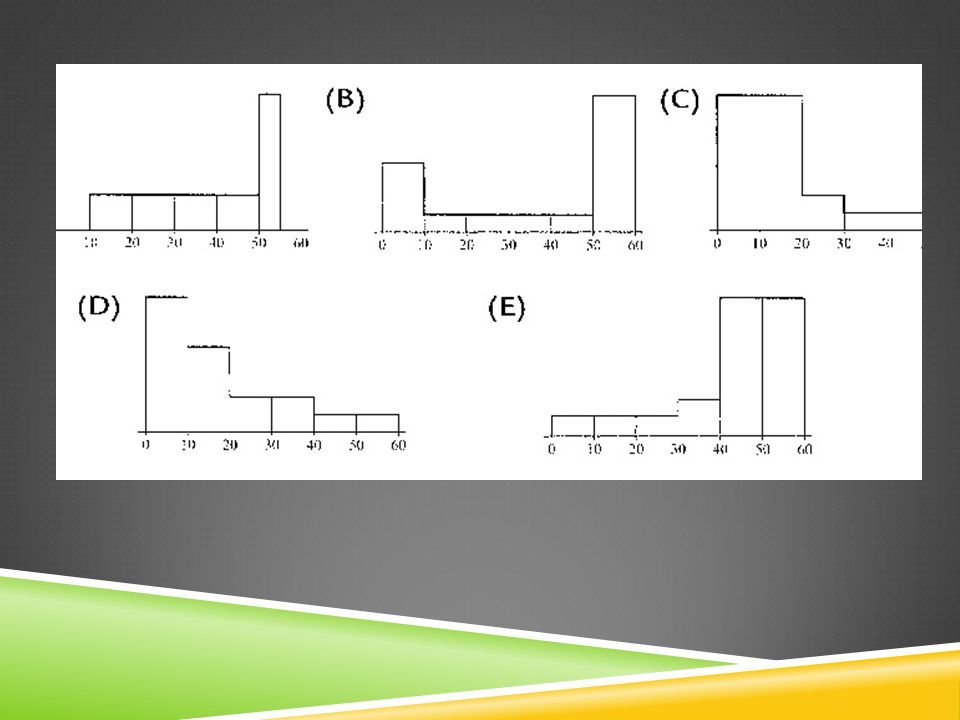
Data Analysis 43 To which of the following histograms can the boxplot correspond?

28
Data Analysis 44 When a set of data has suspect outliers, which of the following are preferred measures of central tendency and of variability? A. Mean and standard deviation B. Mean and variance C. Mean and range D. Median and range E. Median and interquartile range

30
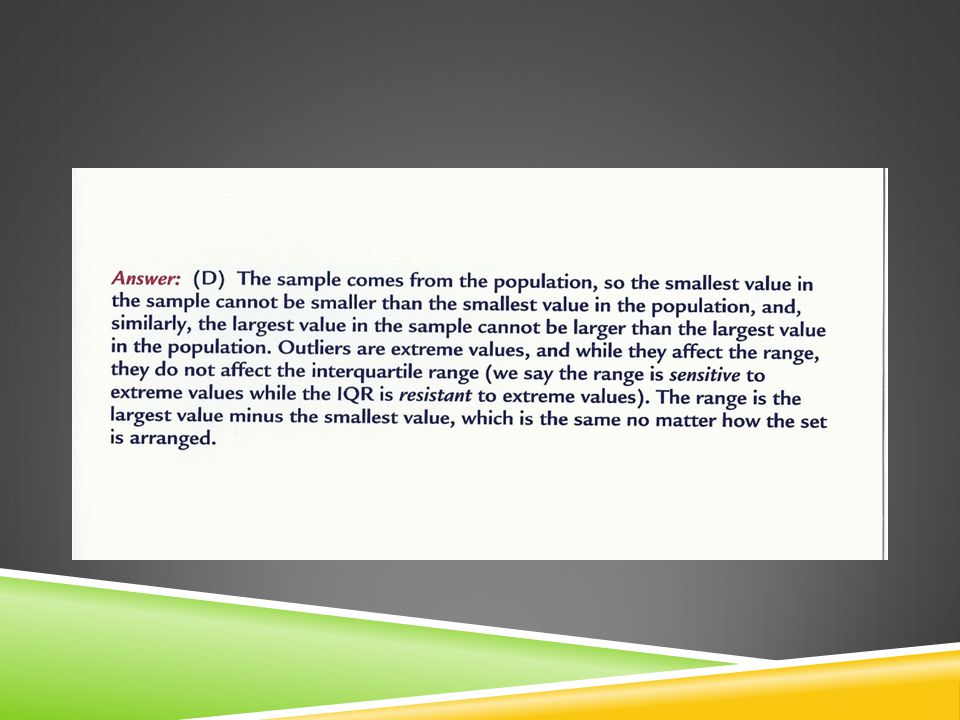
Data Analysis 45 Which of the following statements are true? I. The range of the sample data set can never be greater than the range of the population. II. While the range is affected by outliers, the interquartile range is not. III. Changing the order from ascending to descending changes the sign of the range. A. I only B. II only C. III only D. I and II E. I and III

32
Data Analysis 46 Which of the following are possible residual plots? A. I only B. II only C. III only D. I and II E. I, II, and III

34
Data Analysis 47 A scatterplot of a company’s revenues versus time indicates a possible exponential relationship. A linear regression on y = log(revenue in $1,000) against x = years since 2005 gives ŷ = x with r = Which of the following are valid conclusions (on next slide)?
 against x = years since 2005 gives ŷ = x with r = Which of the following are valid conclusions (on next slide)")
35
I. On the average, revenue goes up 0. 63 thousand dollars per year. II
I. On the average, revenue goes up 0.63 thousand dollars per year. II. The predicted revenue for year 2009 is approximately 1,862 thousand dollars. III. 46% of the variation in revenue can be explained by variation in time. A. I only B. II only C. III only D. I and III E. None of the above are valid conclusions.

37
Data Analysis 48 Given these parallel boxplots, which of the statements on the following are true?

38
I. All three have the same range.
II. All three have the same interquartile range. III. All three medians are between 8 and 12. A. I only B. II only C. III only D. I and III E. II and III

40
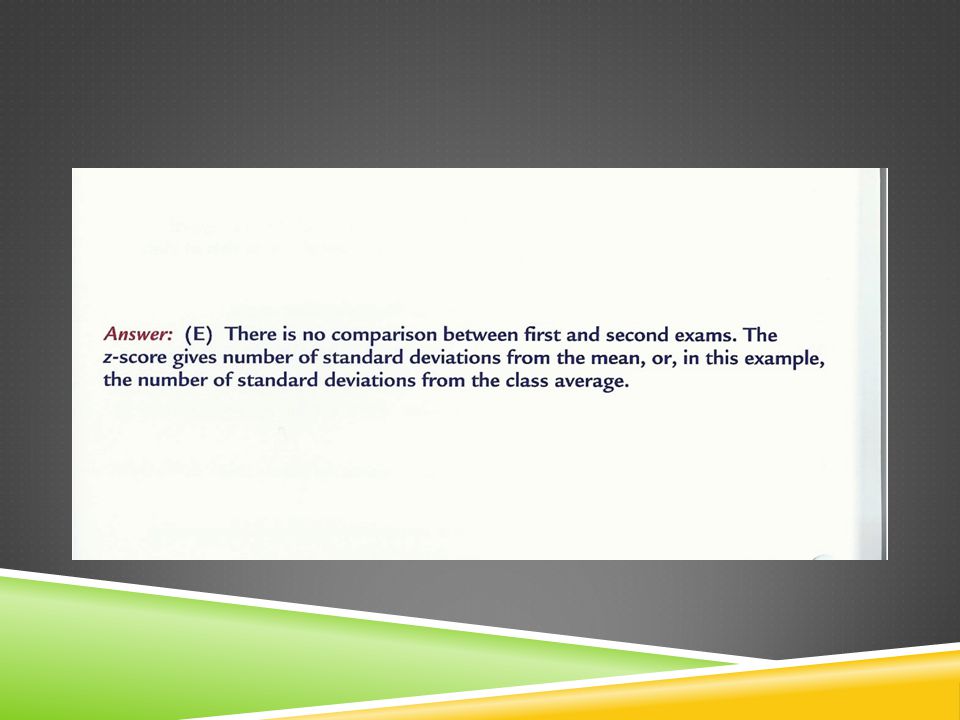
Data Analysis 49 An AP Statistics teacher started using z-scores. On the second major exam of the marking period, a student receives a grade with a z-score of What is the correct interpretation of the grade? A. The student’s grade went down 1.3 points from the first exam. B. The student’s grade went down 1.3 points more than the average grade went down from the first exam. C. The student scored 1.3 standard deviations lower on the second exam than on the first. D. The student scored 1.3 standard deviations lower on the second exam than the class average on the first exam. E. The student scored 1.3 standard deviations lower on the second exam than the class average on the second exam.

42
Data Analysis 50 Given two independent random variables, X with mean 12.3 and standard deviation 0.5, and Y with mean 9.1 and standard deviation 0.3, which of the following is a true statement? A. The mean of X – Y is 21.4 B. The median of X – Y is 3.2 C. The range of X – Y is 21.4 D. The standard deviation of X – Y is 0.8 E. The variance of X – Y is 0.34

44
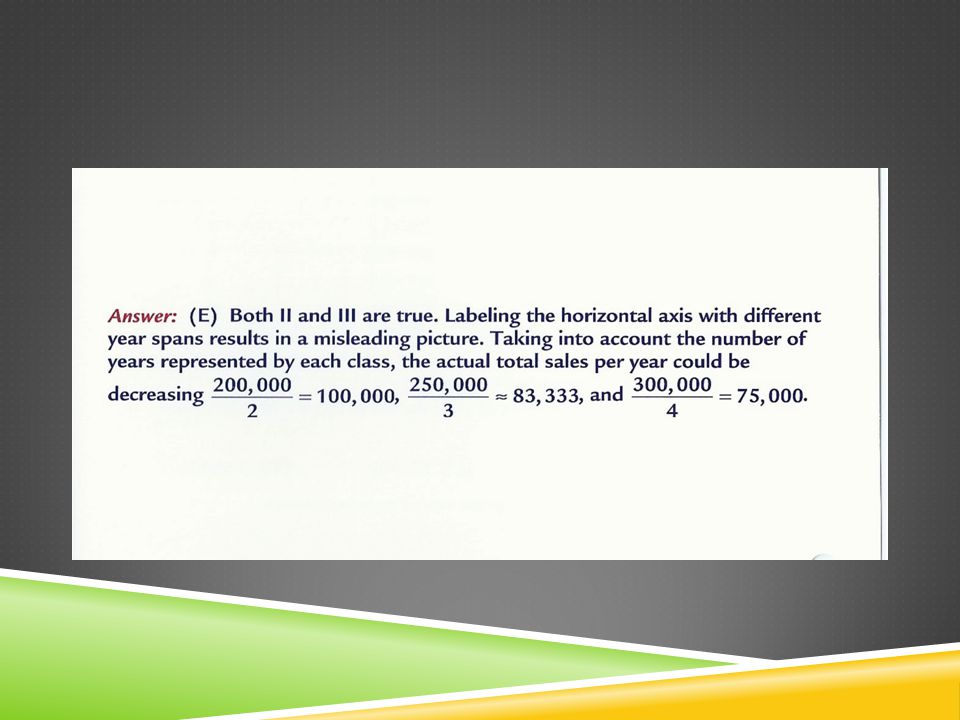
Data Analysis 51 Consider the following total sales histogram. Which of the following are true statements?

45
I. Each year since 1999 the total sales has increased.
II. Labeling has resulted in a misleading picture. III. It is possible that the total sales per year decreased every year between 1999 and 2007. A. I only B. II only C. III only D. I and II E. None of the above gives the complete set of true responses.

47
Data Analysis 52 A study of weekly hours of television watched and SAT scores reports a correlation of r = From this information, we can conclude that: A. Students who watch more TV tend to have lower SAT scores. B. The fewer the hours in front of a TV, the higher a student’s SAT score. C. There is little relationship between weekly hours of TV watched and SAT scores. D. There is a strong negative association between weekly hours of TV watched and SAT scores, but it would be wrong to conclude causation. E. A mistake in arithmetic has been made.

Similar presentations