Download presentation
Presentation is loading. Please wait.

1
3rd Quarter 2013 July 1 – September 30, 2013 EVERY WEEK COUNTS OKLAHOMA AGGREGATE DATA

2
~1 every other day July – September 2013

3
Qtr 1 2011: January 1 – March 31, 2011Qtr 3 2013: July 1 – September 30, 2013 ~8/day ~1 every other day

4
41% 92% 25% *Comparison is difference between Q1 2011 & Q3 2013

5
14%* 10%* 94%* *Comparison is difference between Q1 2011 & Q3 2013

6
2% 7% 18% 10% Comparison is Q1 2011 to Q3 2013

7
94%* *Comparison is difference between Q1 2011 & Q3 2013

8
Baseline Data: Dec 2010 – March 2011 -- July – September 2013 33 Hospitals 6 Hospitals 20 Hospitals

9
<300300 - 499500 - 9991000+ 811 7 7 ORANGE number = approximate number of annual deliveries GREEN number = number of hospitals reporting zero rate July – September 2013

10
Scheduled Deliveries <39 Weeks July – September 2013

11
48 Scheduled Deliveries <39 Weeks 3.4% of Scheduled Deliveries <39 weeks do not have a documented indication July – September 2013

12
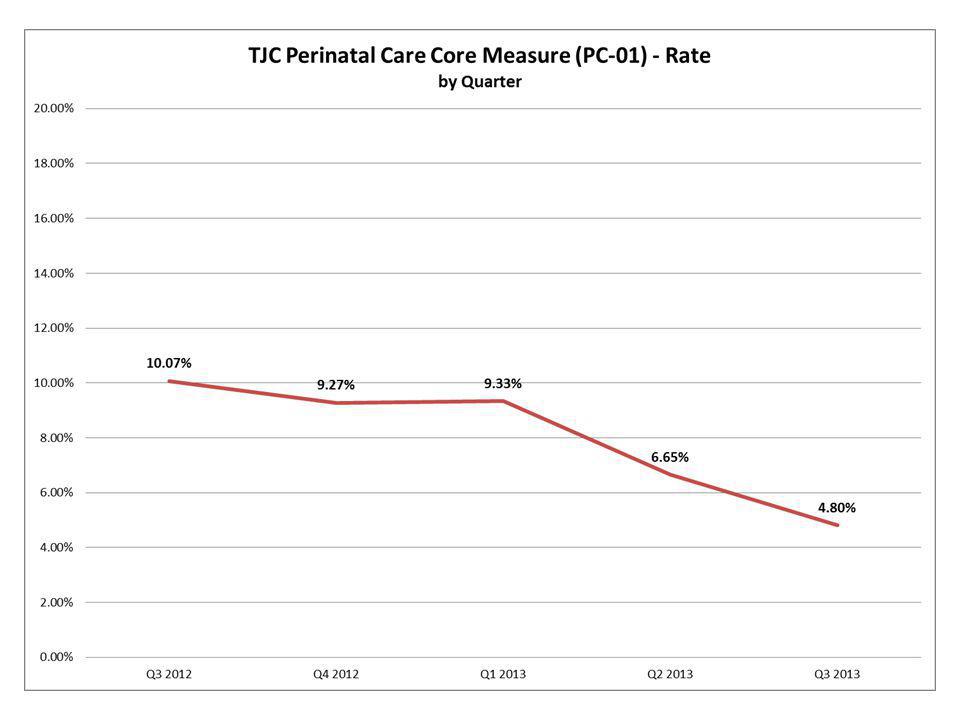
*Data collected via the EWC Data Collection Tool is used to estimate TJC PC-01 Data. TJC PERINATAL CARE CORE MEASURE* PC-01: ELECTIVE DELIVERY

15
July – September 2013 Total Bar = Denominator ( Measure Population ) Red Section = Numerator ( Non-medically Indicated Scheduled Deliveries) (# indicates number of non-medically indicated scheduled deliveries) Blue Section = Remainder (Non-scheduled Deliveries)
 Red Section = Numerator ( Non-medically Indicated Scheduled Deliveries) (# indicates number of non-medically indicated scheduled deliveries) Blue Section = Remainder (Non-scheduled Deliveries)")
16
July – September 2013 overlaid with corresponding hospital’s Core Measure Rate Hospitals with smaller denominators are more likely to have higher rates, unless the numerator is zero.

17
27 Hospitals July – September 2013 22 Hospitals

18
OKLAHOMA BIRTH CERTIFICATE DATA

19
Comparison is Q1 2011 to Q3 2013 Provided by Oklahoma Vital Records

20
1%* 11%* 6%* * comparison is Q1 2011 to Q3 2013 Induction – 39-41 Weeks Induction – 36-38 Weeks Augmentation – 36-38 Weeks Augmentation – 39-41 Weeks Provided by Oklahoma Vital Records EWC Begins 15%*

21
*Oklahoma Birth Certificate Data

Similar presentations