Download presentation
Presentation is loading. Please wait.

1
1

2
Topic 5.3 (SL)
")
3
* Break-even analysis is a method for finding out the minimum level of sales necessary for a firm to just start to make a profit

4
* The level of output at which total sales revenue is equal to total costs of production * When costs are greater than revenue the firm makes a loss * When costs are less than revenue the firm will make a profit * What happens when costs = revenue? The firm will just break even

5
* Fixed costs must be paid regardless of the level of output * Variable costs increase with output but at a constant rate, so if 1 unit cost £5 then 10 units will cost £50 * Every Unit of output produced is sold * Selling price remains constant regardless of units sold

6
* 3 Methods * Using a table showing revenue and costs over a range of output levels * Using a formula * Using a graph

7
00500 115505 2305010 3455015 4605020 5755025 6905030 71055035 81205040 91355045 1015050 111655055 121805060 Units of output Sales Revenue Fixed Costs Variable Costs Total Costs Profit (000’s ) (000’s) (000’s) (000’s) (000’s) (000’s)
 (000’s) (000’s) (000’s) (000’s) (000’s)")
8
* Contribution per unit = selling price – direct cost per unit * This shows the amount that each unit contributes towards fixed costs * Break even = Fixed Costs $) Contribution per unit ($)
 Contribution per unit ($)")
9
Sales Revenue/Costs Units of output 0 0 50 100 150 200 2000 4000 6000 8000 10000 12000 Total Revenue Total Costs Fixed Costs Break Even Point Break even output

10
Based on: * costs * prices * production/sales levels

11
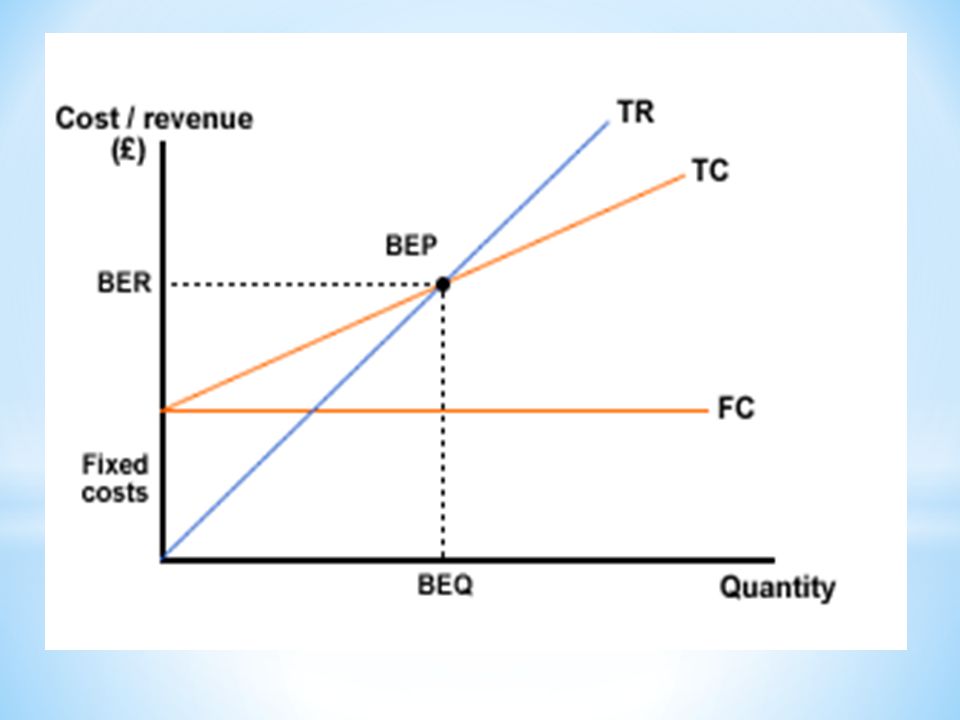
Break-even quantity (BEQ) The level of sales or output where costs equal revenue and the firm is therefore making neither a loss nor a profit.
 The level of sales or output where costs equal revenue and the firm is therefore making neither a loss nor a profit.")
12
* Break-even revenue (BER) The level of sales revenue being earned by the firm at the break-even level of output. * Break-even point (BEP) The position where TC and TR lines cross.
 The position where TC and TR lines cross..")
15
Step 1 Extract the data Step 2 Calculate the BEQ Step 3 Fix the X Axis (quantity/capacity) Step 4 Fix the Y Axis (revenue and costs) Step 5 Plot the TR Axis Step 6 Add the FC point Step 7 Add the TC Line
 Step 4 Fix the Y Axis (revenue and costs) Step 5 Plot the TR Axis Step 6 Add the FC point Step 7 Add the TC Line")
16
FIRST – work out BEQ * FC £480,000 per month. * VC: £60 per unit * Price: £120 per unit

17
* Total Revenue(TR) = Number of items sold x their price * Total costs (TC) = FC + VC(x) * At break-even TR = TC or P(x) = FC + VC(x) * So BEQ = FC/(P - VC) Note: P = price; x = quantity
 = Number of items sold x their price * Total costs (TC) = FC + VC(x) * At break-even TR = TC or P(x) = FC + VC(x) * So BEQ = FC/(P - VC) Note: P = price; x = quantity")
18
* The equation BEQ = FC/(P - VC) $480,000 per month / ($120 - $60 per unit) = $480,000/£60 = 8,000 units per month
 $480,000 per month / ($120 - $60 per unit) = $480,000/£60 = 8,000 units per month")
19
* If you are given a maximum capacity, use that figure. * If not, double the break-even quantity is a good guide figure, or 16,000 units in this case.

20
* In this case the maximum revenue is 16,000 x £120 = £1.92 million (price per unit x maximum possible sales).
.")
22
FC

24
* Add labels to the two axes and give the chart a title. * Marks are awarded for this finishing touch.

Similar presentations


 Before we start studying breakeven it is essential that you understand some key terms: Breakeven is the point at which.>")