Download presentation
Presentation is loading. Please wait.

1
Using Graphics in Science

2
Problem solving often invokes an image of a chess player thinking for hours trying to find the right move, or inventors like the Wright brothers gazing at the birds and waiting for some spectacular, clarifying moment that will solve the problem of flight. In fact, problem solving does not usually involve some brilliant insight that arrives after hours of thinking. Most often, problem solving is a product of experience and memory. Problem Solving ©thebillatwood@gmail 2013 DRAFT2

3
Think of a problem you solved recently. Maybe you had to change a flat tire in a new car, book a reservation on an unfamiliar website, or try to help your friend set their watch to daylight savings time. Chances are that you solved the problem by remembering a similar experience that would give you clues to how to solve the problem. ©thebillatwood@gmail 2013 DRAFT3

4
You might argue, if remembering is all you are doing then you are not facing a true problem. However, most problems we face arent true problems the likes of which we have never seen, but just a tweak of a problem weve seen before. The trick is to recognize the problem as similar to one youve seen before and remember the experience of solving it. ©thebillatwood@gmail 2013 DRAFT4

5
According to the Common Core State Standards, students are expected to be able to persevere in problem solving. Why dont students persevere? It may be that the problems seem too difficult. Students look at a problem and give up because they dont see the problem as similar to one they have solved before. These graphics are meant to address this issue by exposing students to a variety of problems and science situations. ©thebillatwood@gmail 2013 DRAFT5

6
You can use these graphics in a variety of ways (see slides 12 and 13). But, begin by showing a graphic and asking students simple questions like: 1.What do you notice or know about this graphic? What is this problem about? 2.What vocabulary is related? 3.What questions do you expect to be asked? 4.What kinds of errors or misconceptions should you watch out for? ©thebillatwood@gmail 2013 DRAFT6

7
Next, ask low and high level questions about the graphics that simulate the kinds of rich and complex problems students will be expected to solve. ©thebillatwood@gmail 2013 DRAFT7

8
You are using these graphics as a tool to introduce and review concepts from previous study. Remember, the more times students have seen and solved problems like these, the greater their bank of experiences, the better they will be able to persevere in solving problems. ©thebillatwood@gmail 2013 DRAFT8

9
Six Benefits to Using the Graphics 1.Students become familiar with the common graphics in science and feel less intimidated and frustrated by them. 1.Students begin to see patterns among problems and recognize new problems as similar to ones they have solved before. 1.Students learn to focus on the key information in a problem before solving it. ©thebillatwood@gmail 2013 DRAFT9

10
10 Six Benefits Continued 4. Students review and recall key vocabulary and concepts from previous instruction. 5. Students learn to break down problems by focusing on a small part or important sub-step. 6. Students verbally rehearse the approach: What do I know? What do I need to do or answer? What vocabulary is related? How do I start my answer?

11
Many graphics developed by Massachusetts Dept. of Education have appeared on publically released tests or items.. ©thebillatwood@gmail 2013 DRAFT11

12
Five Ways to Use the Graphics 1.Flash graphics onto a screen and pepper students with questions. (See guidelines for pepper, slide 14) Use the sample slides (19-25) to give you an idea of the kinds of questions you might ask. 1. If students are nervous, allow them to quickly confer in two person groups before answering. 1. Have all students respond on white board. Or with a hand-signal for multiple choice, true false, or answers with a number. ©thebillatwood@gmail 2013 DRAFT12
 Use the sample slides (19-25) to give you an idea of the kinds of questions you might ask. 1. If students are nervous, allow them to quickly confer in two person groups before answering. 1. Have all students respond on white board. Or with a hand-signal for multiple choice, true false, or answers with a number DRAFT12.")
13
©thebillatwood@gmail 2013 DRAFT13 Five Ways to Use the Graphics Continued 4. Use the graphics as a quick written brainstorm (Type One) or quick quiz (Type Two). Ask: a. List 4+ pieces of information you know or notice. b. List 5+ vocabulary words related to this. c. List 3+ questions that will likely be asked. d. Describe 2+ mistakes to avoid. e.Describe the method to find the answer. 5.After practicing with these, design Student-to- Student Pepper Cards in math for an example (see www.collinsed.com/billatwood.htm) to have students practice by themselves or with partner.
 or quick quiz (Type Two). Ask: a. List 4+ pieces of information you know or notice. b. List 5+ vocabulary words related to this. c. List 3+ questions that will likely be asked. d. Describe 2+ mistakes to avoid. e.Describe the method to find the answer. 5.After practicing with these, design Student-to- Student Pepper Cards in math for an example (see to have students practice by themselves or with partner..")
14
©thebillatwood@gmail 2013 DRAFT14 Guidelines for Peppering Students The idea of peppering students comes from a baseball drill. A player stands a few feet away from a pitcher who tosses soft pitches. The batter repeatedly taps back to the pitcher. The goal is to get many hitting repetitions in a short amount of time. The academic game is explained in Teach Like Champion by Doug Lemov. (See the video on youtube http://www.youtube.com/watch?v=PARfIwF215k.) Here are 4 important points to remember: 1.Explain to students why you are playing. Explain that you are calling on everyone without hands raised. You are not not trying to embarrass, but only to get everyone a lot of at bats. 2.Remind students, there is no hand-raising. Students should be trying to answer every question in their heads. 3.Remember the format: Ask a question, pause, then call on a student. Mix your pace from quick to slow. Dont get too excited by correct answers. 4.If students dont know an answer they can say, I need help. This is not a big deal. Other students can now raise their hand and give the answer. Go back to the student and repeat the same question.
 Here are 4 important points to remember: 1.Explain to students why you are playing. Explain that you are calling on everyone without hands raised. You are not not trying to embarrass, but only to get everyone a lot of at bats. 2.Remind students, there is no hand-raising. Students should be trying to answer every question in their heads. 3.Remember the format: Ask a question, pause, then call on a student. Mix your pace from quick to slow. Dont get too excited by correct answers. 4.If students dont know an answer they can say, I need help. This is not a big deal. Other students can now raise their hand and give the answer. Go back to the student and repeat the same question..")
15
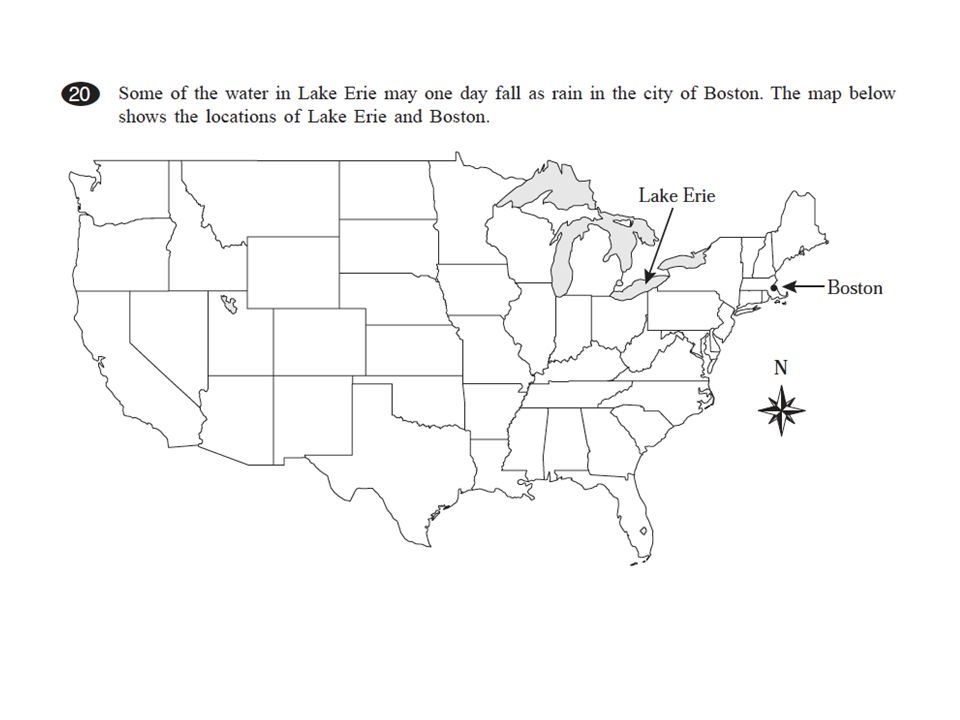
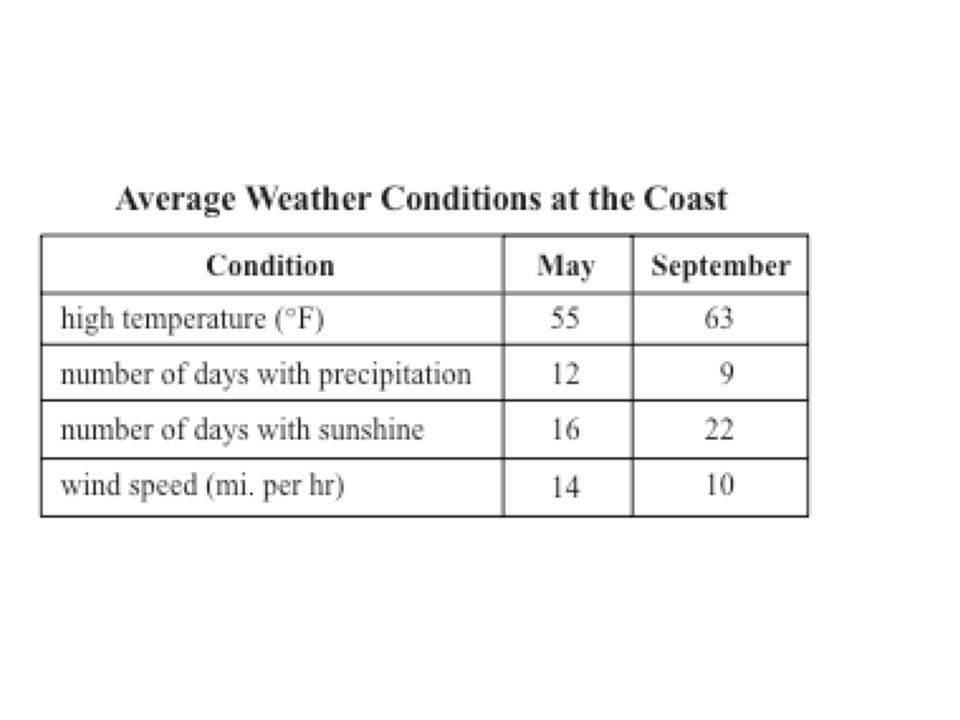
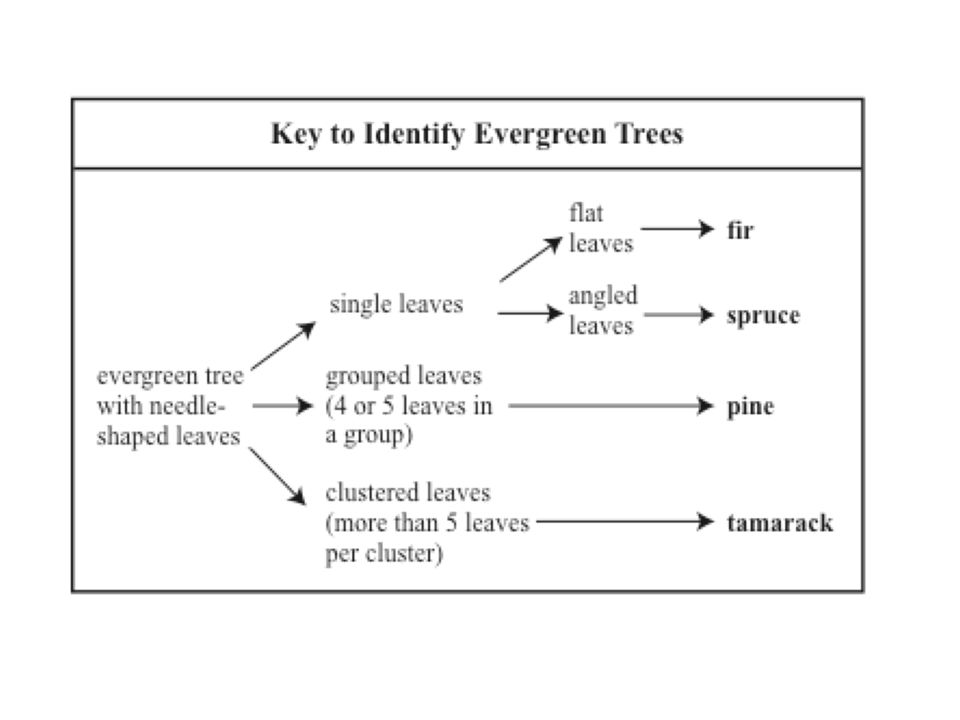
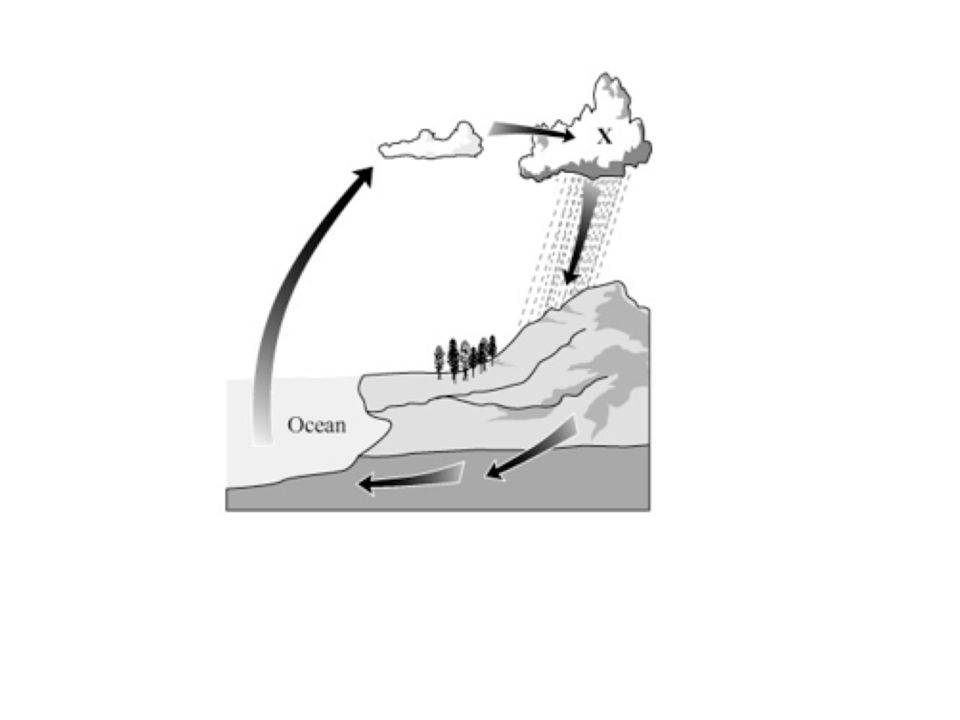
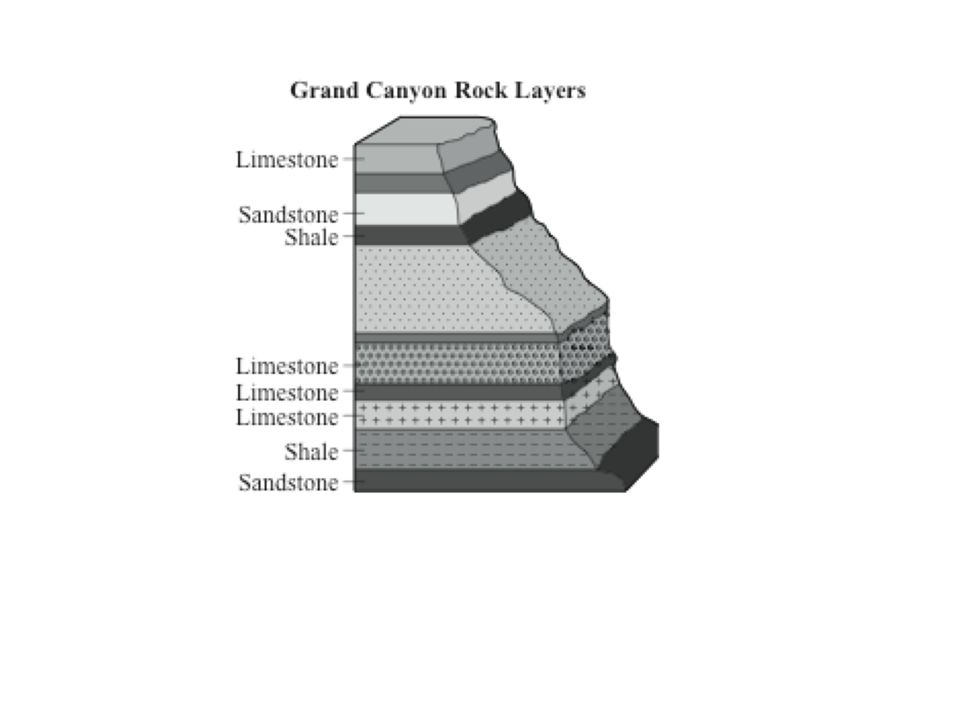
The following slides offer sample of the kinds of oral questions you might ask. Remember, you do not have to ask all of the questions These are just samples of question types. Mix up higher level and lower level questions. Remember, a geometry question can become a fraction question with a little skill. What fraction of these lines are parallel? My favorites question types include: 1.Who and what is it about? What do you know or notice? 2.What math words go with this? 3.What question might be asked? What might you need to find? 4.How do you solve this kind of problem? Describe the steps. 5.What mistakes will be made? How would you check it? 6.Ask a what if or a go backwards question. (What if you wanted to design a garden with double the area? With this area, what are the dimensions?) 7.Generalize or use variables. Can you describe a pattern to solve for any situation? Perimeter of a regular hexagon is 12x + 18, what are sides? 8.Try to mix math strands: Use geometry with algebra and percent with measurement. Always ask for units. 90 what? 90 degrees. ©thebillatwood@gmfail 2013 DRAFT15
 7.Generalize or use variables. Can you describe a pattern to solve for any situation. Perimeter of a regular hexagon is 12x + 18, what are sides. 8.Try to mix math strands: Use geometry with algebra and percent with measurement. Always ask for units. 90 what. 90 degrees DRAFT15.")
Similar presentations


 Pertemuan 11-12 Matakuliah: G0454/Class Management & Education Media Tahun: 2006.>")


