Download presentation
Presentation is loading. Please wait.

1
When Urban Air Quality Meets Big Data
Yu Zheng Lead Researcher, Microsoft Research

2
Background Air quality Why it matters Reality NO2, SO2
Air quality monitor station Air quality NO2, SO2 Aerosols: PM2.5, PM10 Why it matters Healthcare Pollution control and dispersal Reality Building a measurement station is not easy A limited number of stations (poor coverage) Beijing only has 15 air quality monitor stations in its urban areas (50kmx40km)
 Beijing only has 15 air quality monitor stations in its urban areas (50kmx40km)")
3
2PM, June 17, 2013

4
Challenges Air quality varies by locations non-linearly
Affected by many factors Weathers, traffic, land use… Subtle to model with a clear formula S11:Dongchengdongsi S12: Nongzhanguan Statistics. Two stations are supposed to be similar. However, according the data of the past 1 year, over 35% time, the deviation of pm2.5 between the two stations are larger than 100. which is about a 2 level distance. That is, when one station is moderate, the other one could be unhealthy. It is not surprising…. So, we cannot do a simple interpolation. Proportion >35%

5
We do not really know the air quality of a location without a monitoring station!
30,000 + USD, 10ug/m3 202×85×168(mm)
")
6
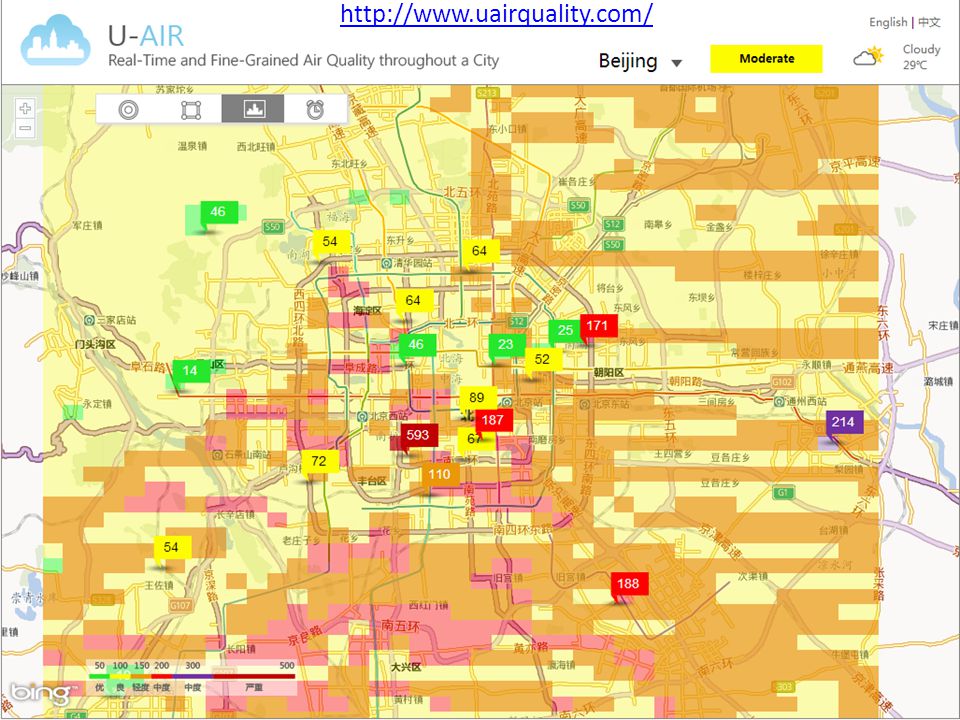
Inferring Real-Time and Fine-Grained air quality
throughout a city using Big Data Meteorology Traffic POIs Road networks Human Mobility Historical air quality data Real-time air quality reports Finer granularity inference

8
Applications Location-based air quality awareness
Fine-grained pollution alert Routing based on air quality Identify candidate locations for setup new monitoring stations A step towards identifying the root cause of air pollution

9
Cloud Cloud + Client MS Azure http://urbanair.msra.cn/ Clients
Our system uses a framework that combines cloud with clients. The cloud continuously collects real-time data, processes the data and provides online services. Users can access the air quality information through either a windows phone app or a website. The mobile client allows users to query the air quality of any location at anytime and anywhere. You can download the app by scanning the 2d bar code. The website provides a broader view and more comprehensive information of air quality throughout a city. Clients

10
Difficulties Incorporate multiple heterogeneous data sources into a learning model Spatially-related data: POIs, road networks Temporally-related data: traffic, meteorology, human mobility Data sparseness (little training data) Limited number of stations Many places to infer Efficiency request Massive data Answer instant queries
 Limited number of stations. Many places to infer. Efficiency request. Massive data. Answer instant queries.")
11
Methodology Overview Partition a city into disjoint grids
Extract features for each grid from its impacting region Meteorological features Traffic features Human mobility features POI features Road network features Co-training-based semi-supervised learning model for each pollutant Predict the AQI labels Data sparsity Two classifiers

12
Semi-Supervised Learning Model
Philosophy of the model States of air quality Temporal dependency in a location Geo-correlation between locations Generation of air pollutants Emission from a location Propagation among locations Two sets of features Spatially-related Temporally-related Spatial Classifier Co-Training Temporal Classifier

13
Evaluation Datasets Data sources Beijing Shanghai Shenzhen Wuhan POI
2012 Q1 271,634 321,529 107,061 102,467 2012 Q3 272,109 317,829 107,171 104,634 Road #.Segments 162,246 171,191 45,231 38,477 Highways 1,497km 1,963km 256km 1,193km Roads 18,525km 25,530km KM 6,100km 9,691km #. Intersec. 49,981 70,293 32,112 25,359 AQI #. Station 22 10 9 Hours 23,300 8,588 6,489 6,741 Time spans 8/24/ /8/2013 1/19/ /8/2013 2/4/ /8/2013 2/4/2013-3/8/2013 Urban Size (grids) 50×50km (2500) 57×45km(2565) 45×25km (1165)
 50×50km (2500) 57×45km(2565) 45×25km (1165)")
14
Evaluation Overall performance of the co-training Accuracy

15
Status http://urbanair.msra.cn/
Publication at KDD 2013: U-Air: when urban air quality inference meets big data Website is publicly available via Azure A mobile client ”Urban Air” n WP App store Component of Urban Air is in CityNext platform On Bing Map China Now Working on prediction

16
Thanks! Yu Zheng Homepage

Similar presentations


 concentrations over China: 2004-2012 Guannan Geng, Qiang Zhang, Aaron van Donkelaar, Randall.>")
 Raw Sensor Data Inference of time-varying probability distributions Creating probabilistic.>")


